Weekly recap of the crypto derivatives markets by BlockScholes.
At a Glance

Key Insights:
- BTC ANNUALISED YIELDS – resume their recovery after a short drop at the end of November to trade flat near zero.
- ETH ANNUALISED YIELDS – trade less flat, between -2% and 0% at all tenors shorter than 1Y.
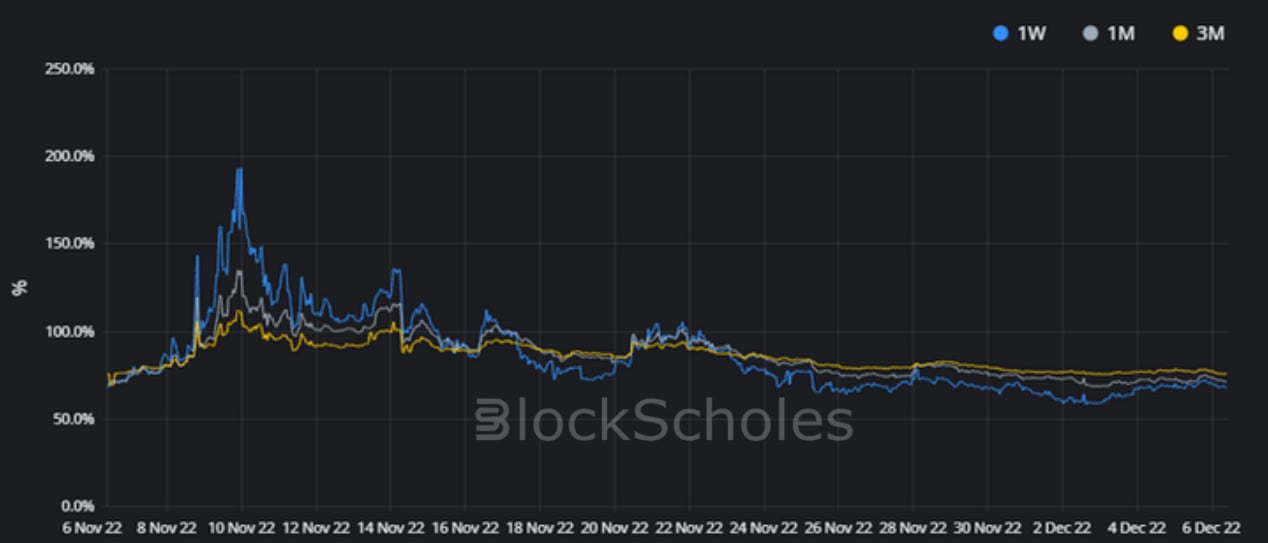
- BTC SABR ATM IMPLIED VOLATILITY – has now dropped to the lowest levels since Nov 2020.
- ETH SABR ATM IMPLIED VOLATILITY – falls alongside BTC’s implied vol, but to a level seen at several periods throughout 2022.
- BTC IMPLIED VOL SURFACE – continues to cool across both the tenor and strike domains, with more extreme falls at longer-dated tenors.
- ETH IMPLIED VOL SURFACE – sees the same surface-wide cooling, but remains 10-20 vol points higher at almost all points.
- BTC SABR RHO – continues to trend towards regular levels, skewing slightly towards OTM puts as it has throughout 2022.
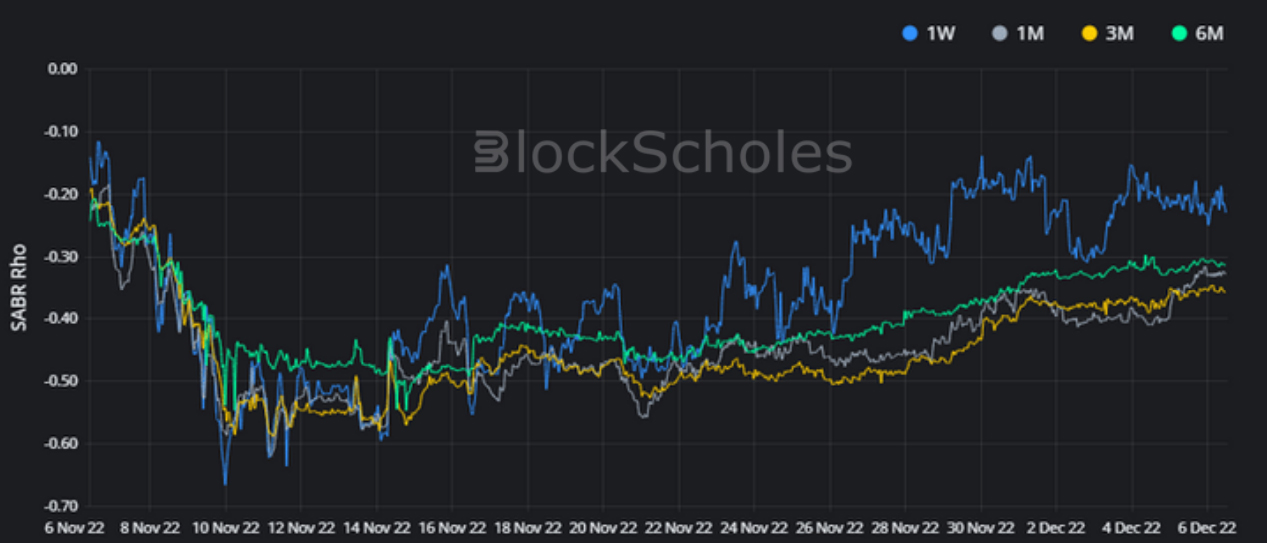
- ETH SABR RHO – also falls towards the slightly pessimistic pricing that it has traded at during periods of calm throughout 2022.
The sombre recovery from the previous month’s uncertainty continues into this week, as the ATM volatility of both BTC and ETH has dropped to remarkably low levels, with BTC’s reaching levels last seen in Nov 2020. This is contrasted by a volatility smile that is still significantly skewed towards OTM puts, indicating a brace against further crises as it has been throughout the past 12 months. This downwards glance is not reflected in the futures-implied yields, which have trended up towards zero over the past two weeks.
Futures

BTC ANNUALISED YIELDS – resume their recovery after a short drop at the end of November to trade flat near zero.
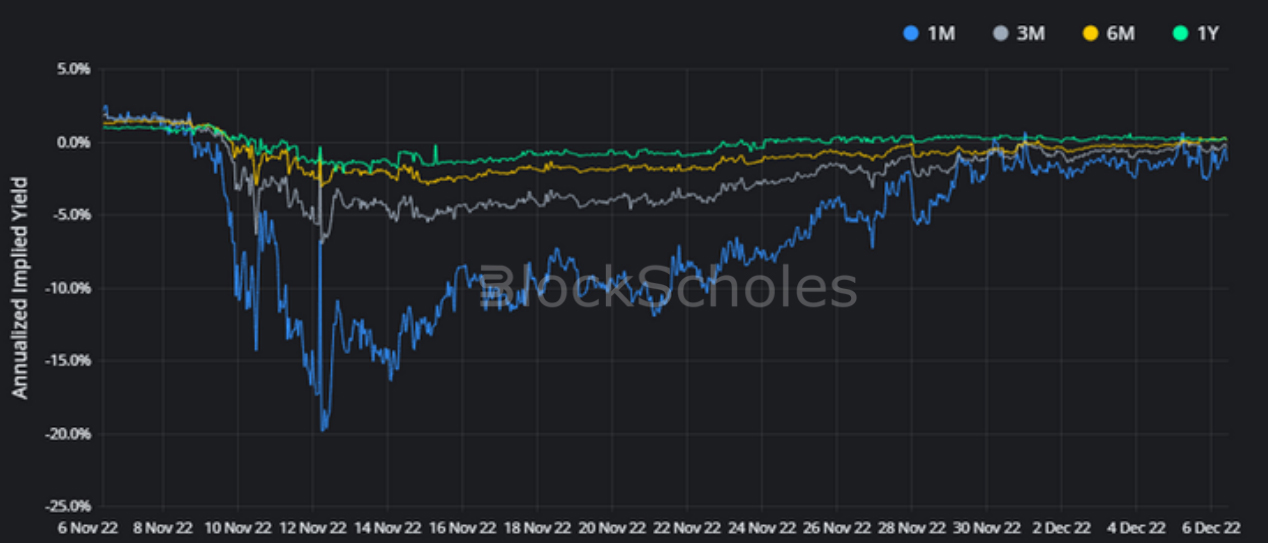
ETH ANNUALISED YIELDS – trade less flat, between -2% and 0% at all tenors shorter than 1Y.

Options

BTC SABR ATM IMPLIED VOLATILITY – has now dropped to the lowest levels since Nov 2020.
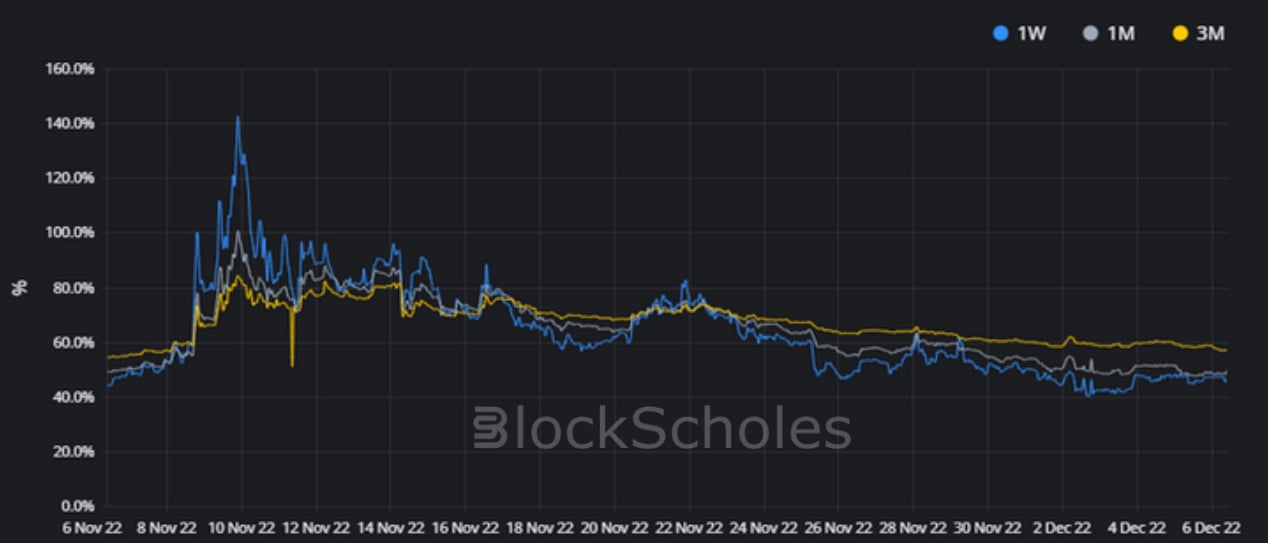
ETH SABR ATM IMPLIED VOLATILITY – falls alongside BTC’s implied vol, but to a level seen at several periods throughout 2022.
Volatility Surface
BTC IMPLIED VOL SURFACE – continues to cool across both the tenor and strike domains, with more extreme falls at longer-dated tenors.
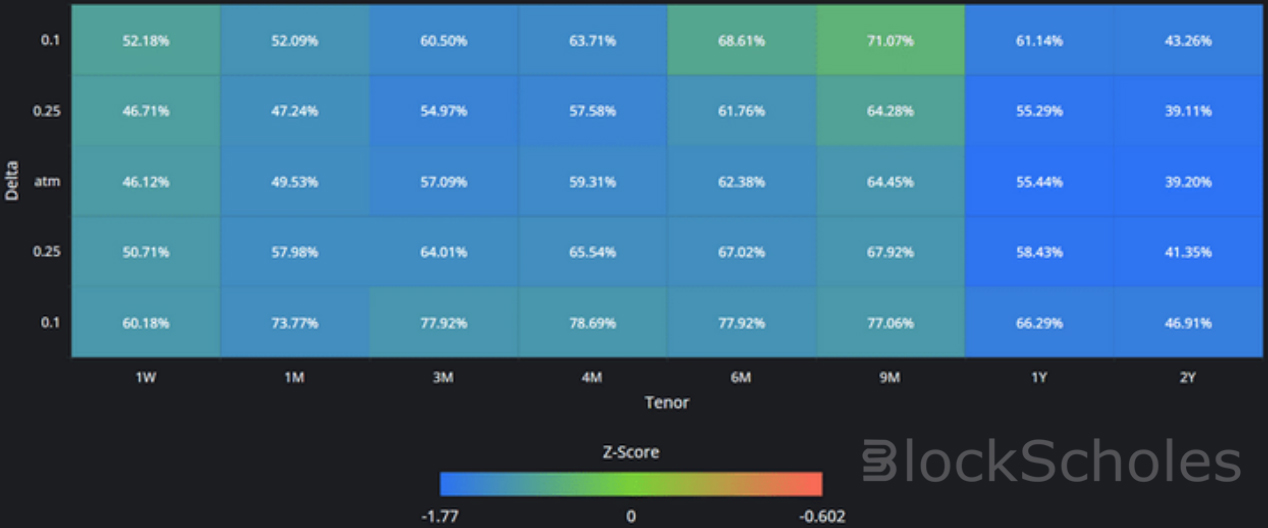
ETH IMPLIED VOL SURFACE – sees the same surface-wide cooling, but remains 10-20 vol points higher at almost all points.

Z-Score calculated with respect to the distribution of implied volatility of an option at a given delta and tenor over the previous 30-days of hourly data, timestamp 10:00 UTC.
SABR Rho

BTC SABR RHO – continues to trend towards regular levels, skewing slightly towards OTM puts as it has throughout 2022.
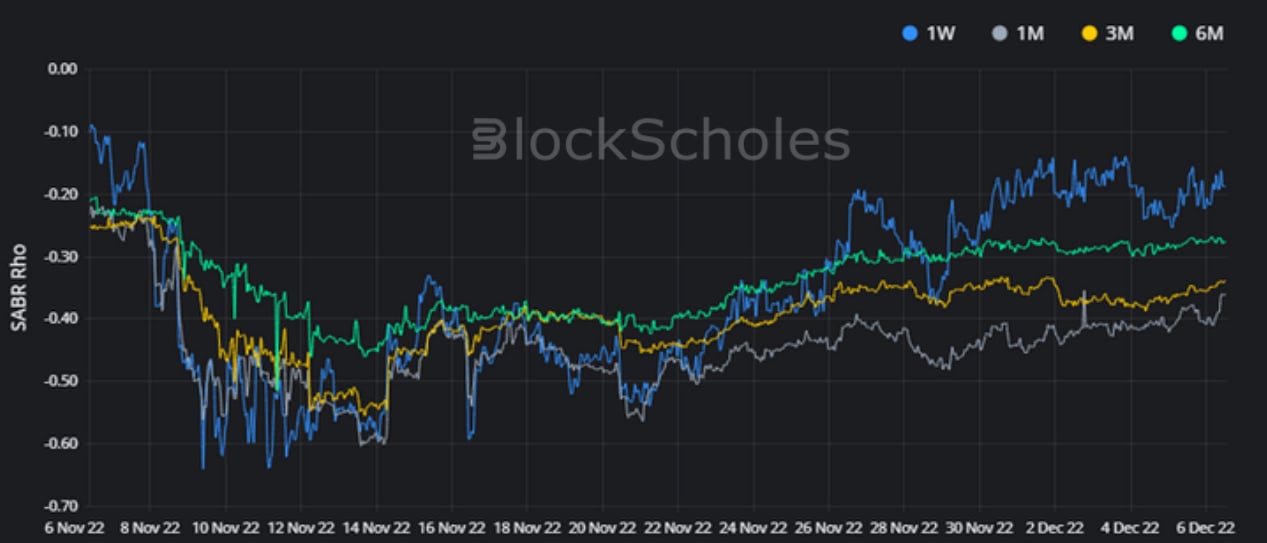
ETH SABR RHO – also falls towards the slightly pessimistic pricing that it has traded at during periods of calm throughout 2022.
Volatility Smiles
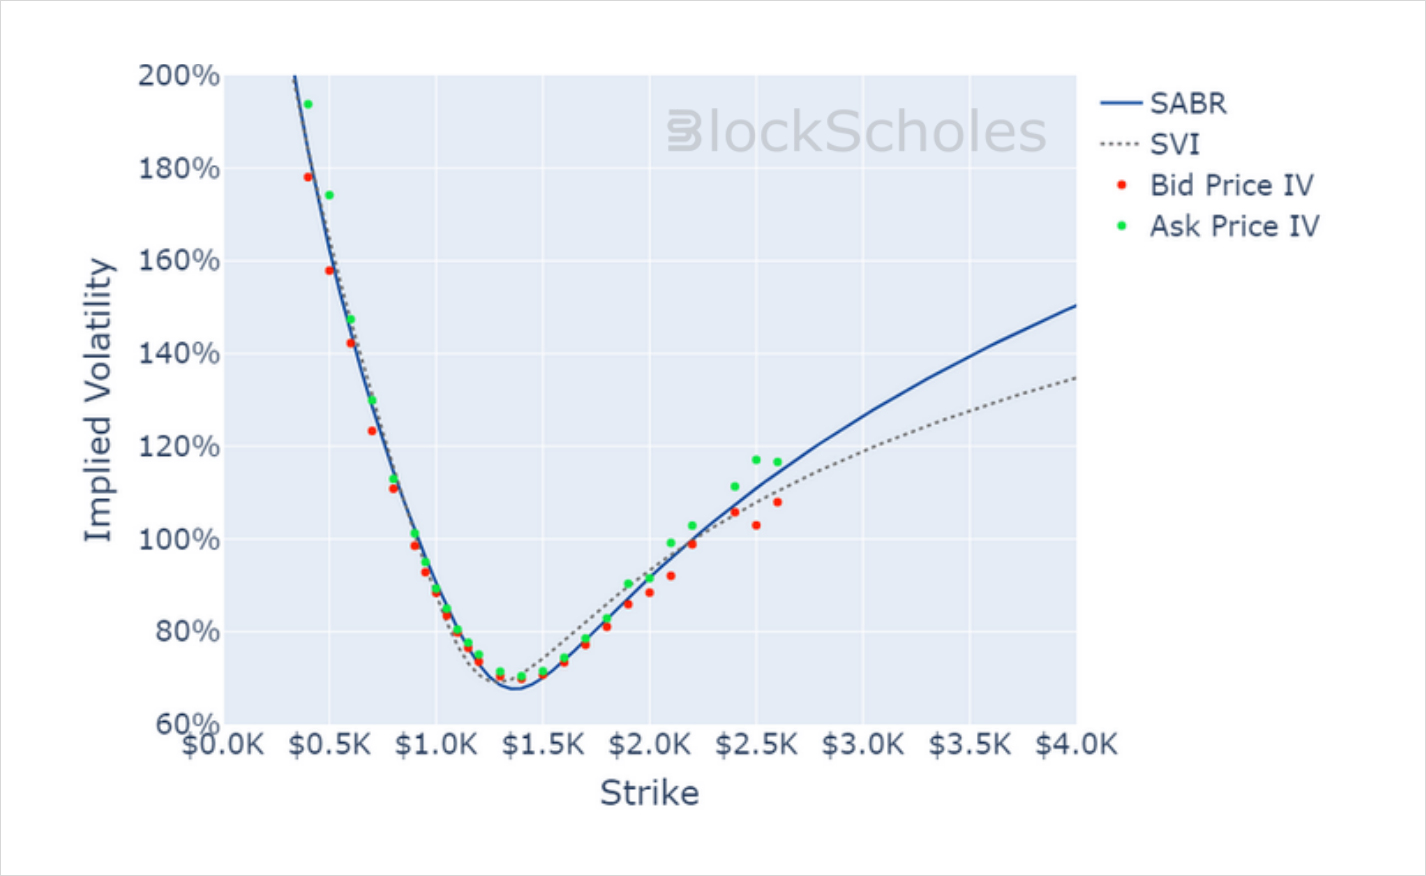
BTC SMILE CALIBRATIONS – 30-Dec-2022 Expiry, 10:30 UTC Snapshot.
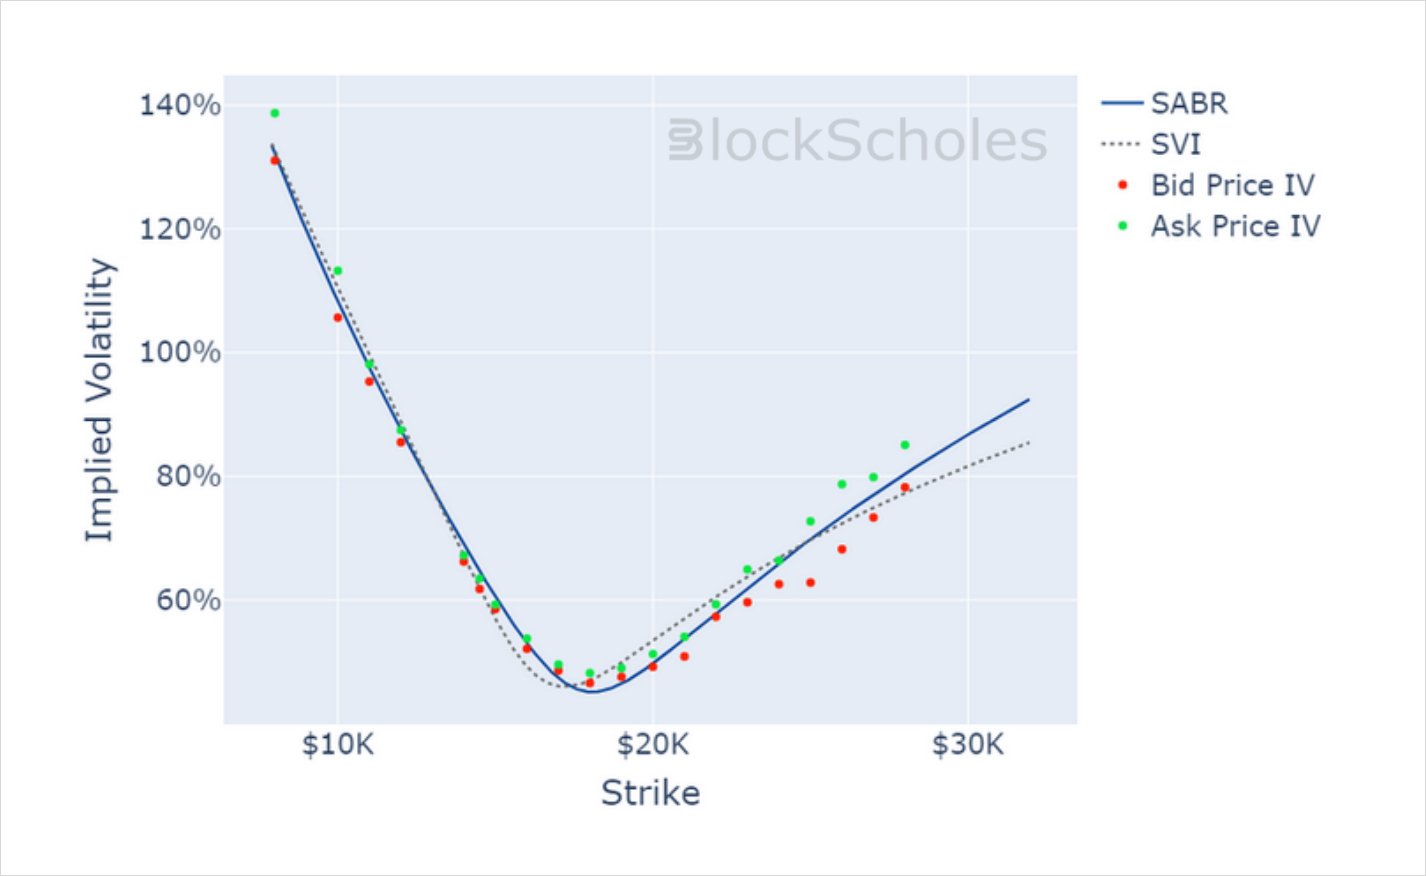
ETH SMILE CALIBRATIONS – 30-Dec-2022 Expiry, 10:30 UTC Snapshot.
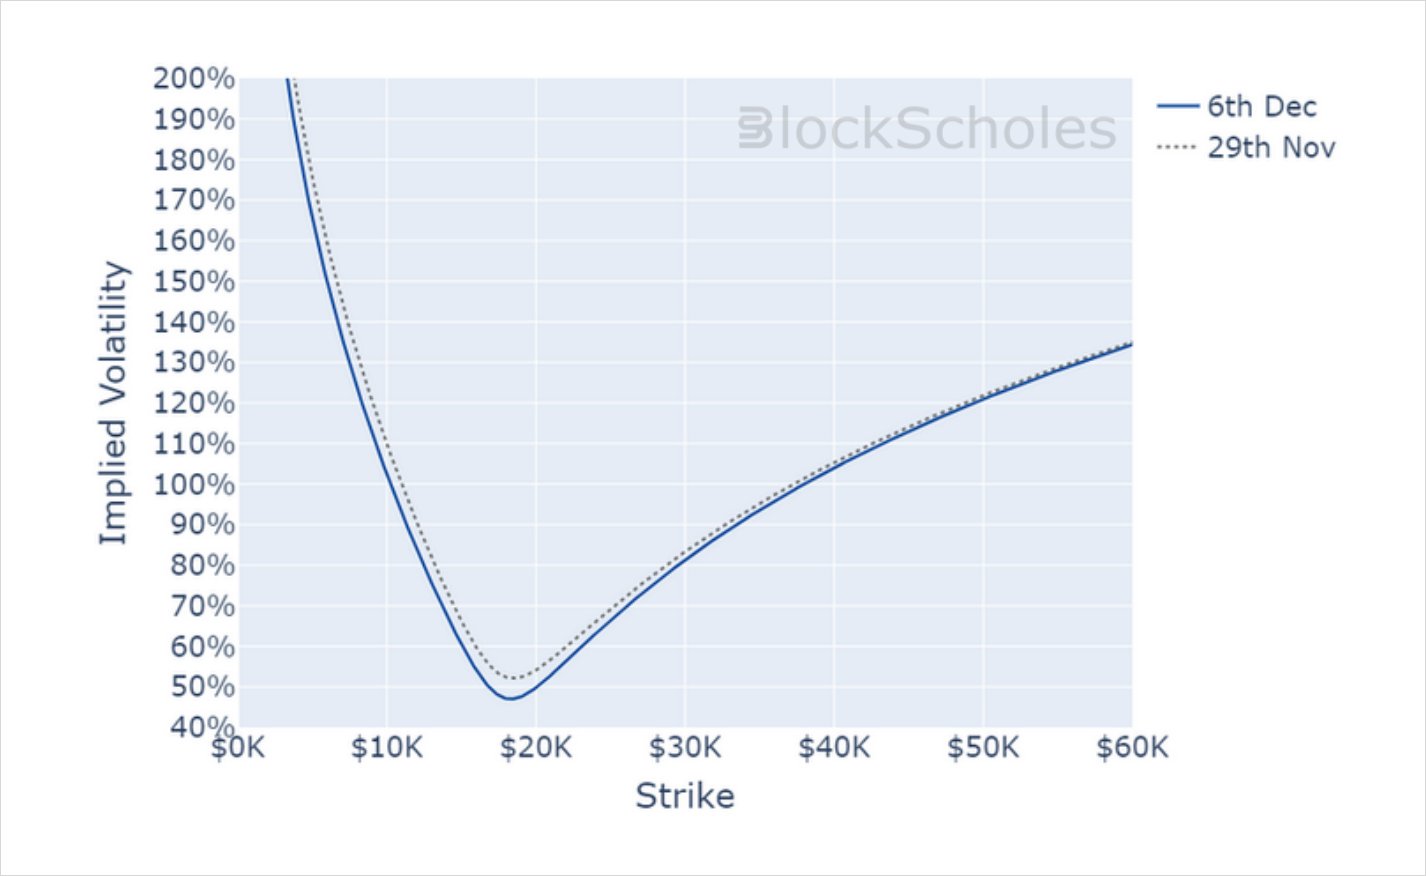
Historical SABR Volatility Smiles
BTC SABR CALIBRATION – 30 Day Tenor, 10:00 UTC Snapshot.
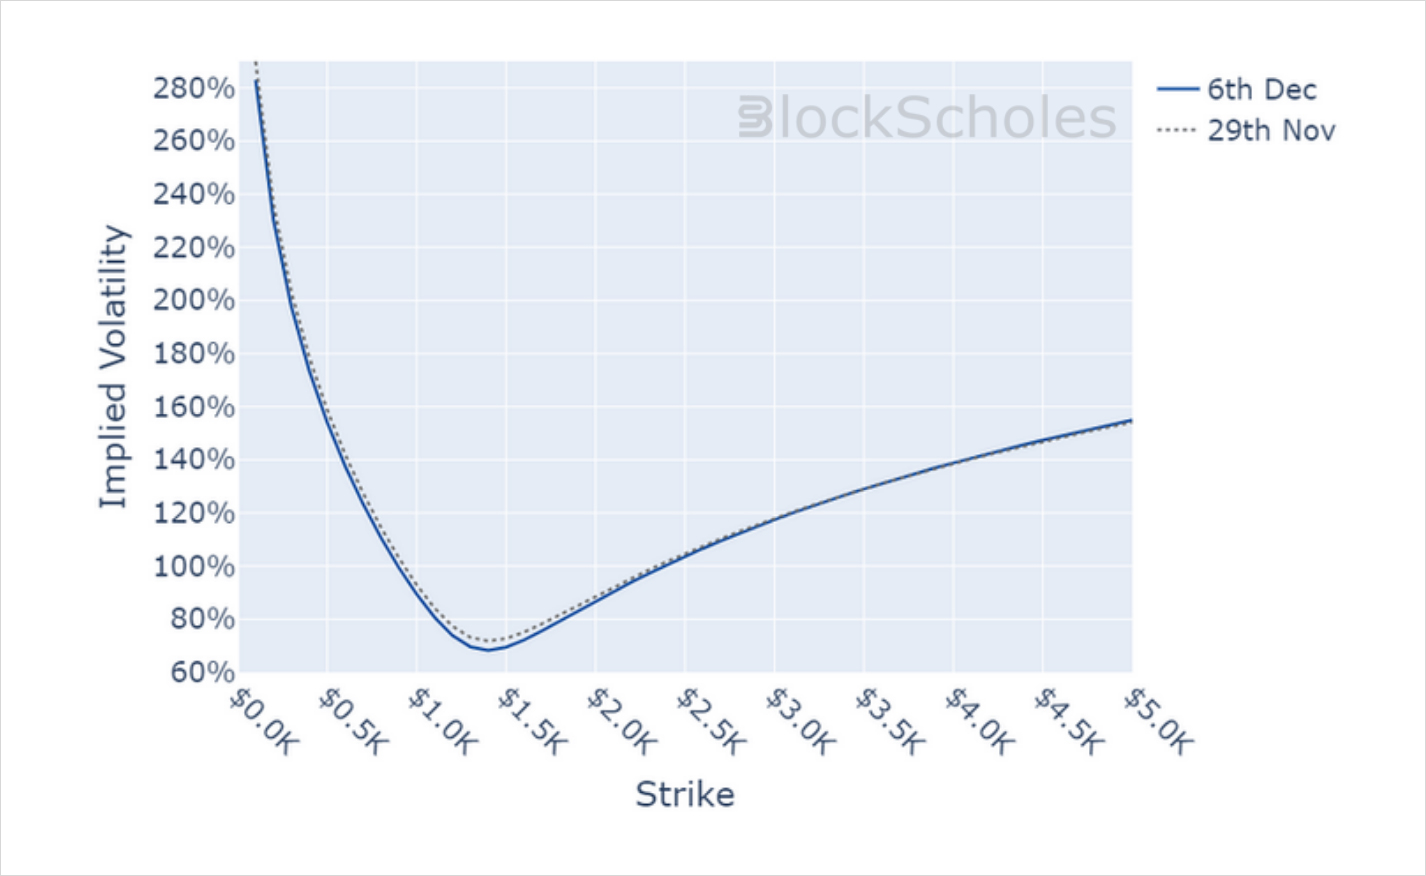
ETH SABR CALIBRATION – 30 Day Tenor, 10:00 UTC Snapshot.
AUTHOR(S)
