
Weekly recap of the crypto derivatives markets by BlockScholes.
At a Glance

Key Insights:
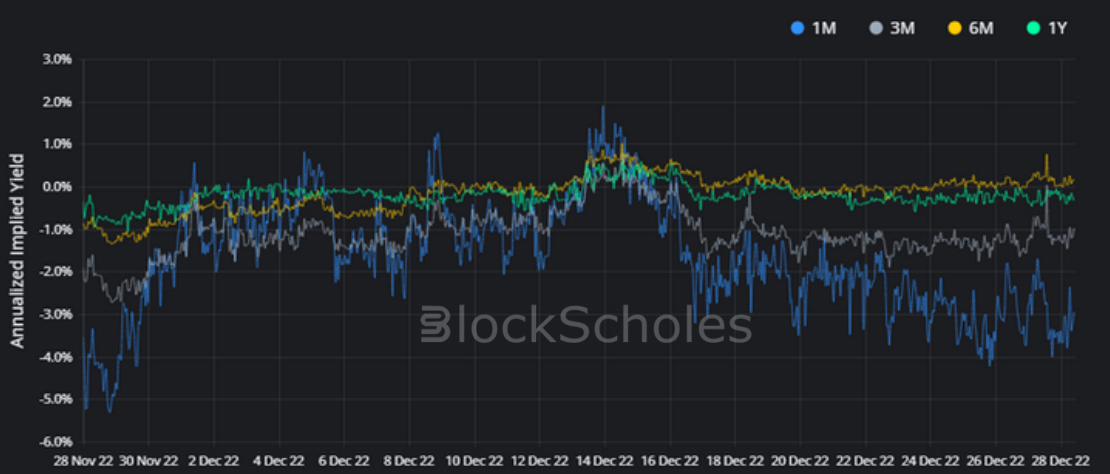
- BTC ANNUALISED YIELDS – shorter-dated futures continue to fall below spot, whilst futures at 6M and 1Y tenors remain closer to 0%.
- ETH ANNUALISED YIELDS – shorter-dated tenors fall deeper negative, but remained supported just above the level of BTC’s.
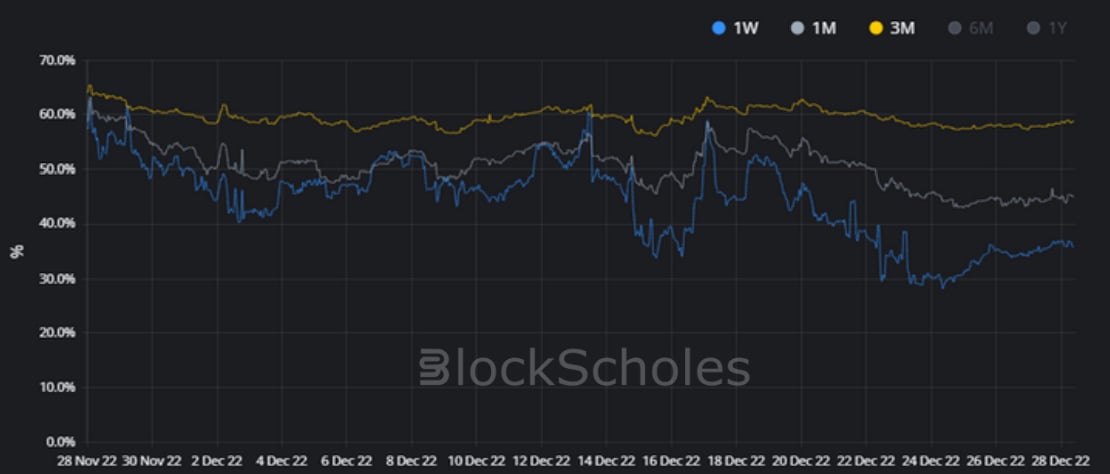
- BTC SABR ATM IMPLIED VOLATILITY – oscillates near to Nov 2020 lows, with short-dated options between 35-45%.
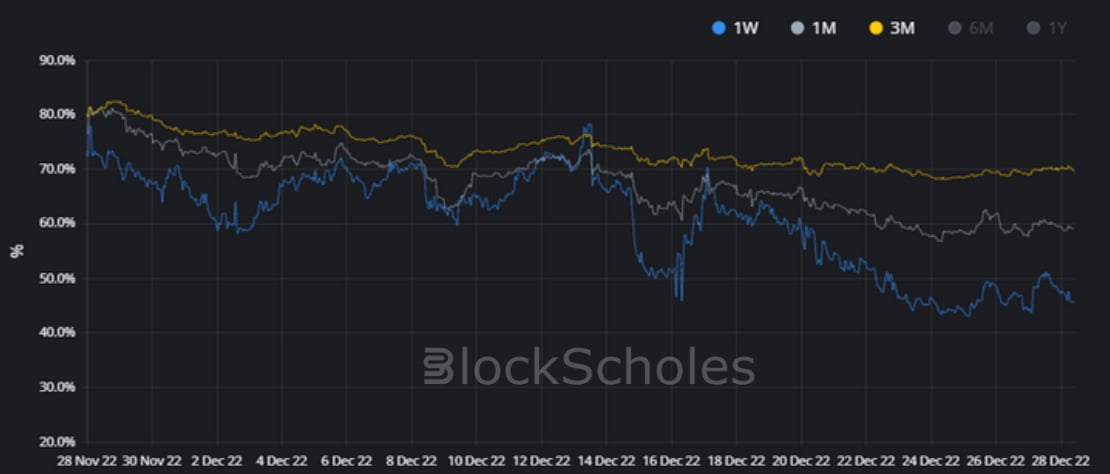
- ETH SABR ATM IMPLIED VOLATILITY – mirrors BTC’s movements as it trades near to all-time low levels.
- BTC IMPLIED VOL SURFACE – almost every point on the surface is down compared to its recent history, with shorter tenors seeing the most extreme fall in implied volatility.
- ETH IMPLIED VOL SURFACE – cools across the surface, with the implied volatility of shorter dated tenors falling fastest.
- BTC SABR RHO – the trend towards a neutral skew in the volatility smile returns at a 1W tenor, before a dramatic reversal in the last 24 hours.
- ETH SABR RHO – sees the same trend towards a neutrally skewed smile, as well as the sharp return to a skew towards OTM puts in the last 24 hours.
A historically low realised volatility in December has led to a similarly low ATM implied volatility. Whilst the skew towards OTM puts has attempted to sustain a trend towards a neutral volatility smile, particularly at short-dated tenors, this has been reversed quickly in the last 24 hours. That return to downside protection being priced at a premium is coupled with futures prices trading consistently below spot at all tenors shorter than 1Y.
Futures

BTC ANNUALISED YIELDS – shorter-dated futures continue to fall below spot, whilst futures at 6M and 1Y tenors remain closer to 0%.

ETH ANNUALISED YIELDS – shorter-dated tenors fall deeper negative, but remained supported just above the level of BTC’s.
Options

BTC SABR ATM IMPLIED VOLATILITY – oscillates near to Nov 2020 lows, with short-dated options between 35-45%.
ETH SABR ATM IMPLIED VOLATILITY – mirrors BTC’s movements as it trades near to all-time low levels.
Volatility Surface
BTC IMPLIED VOL SURFACE – almost every point on the surface is down compared to its recent history, with shorter tenors seeing the most extreme fall in implied volatility.
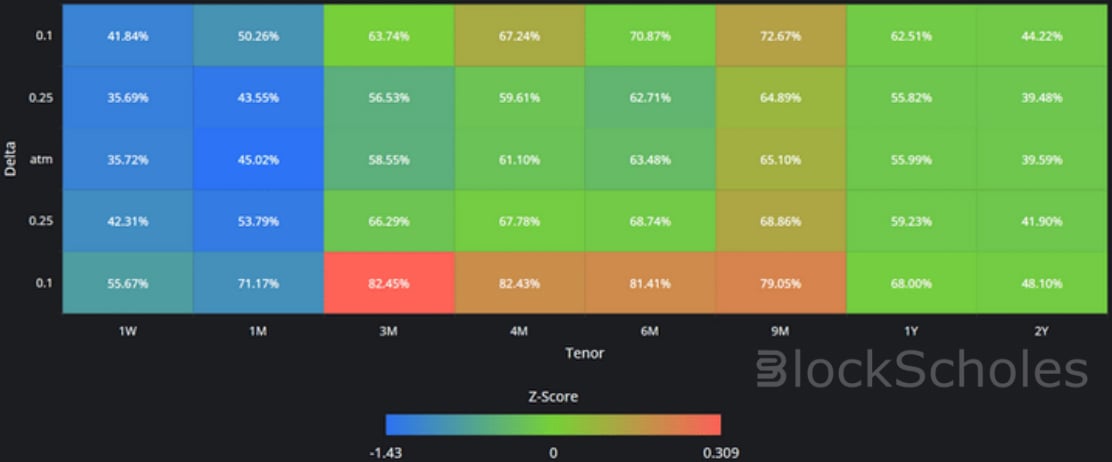
ETH IMPLIED VOL SURFACE – cools across the surface, with the implied volatility of shorter dated tenors falling fastest.
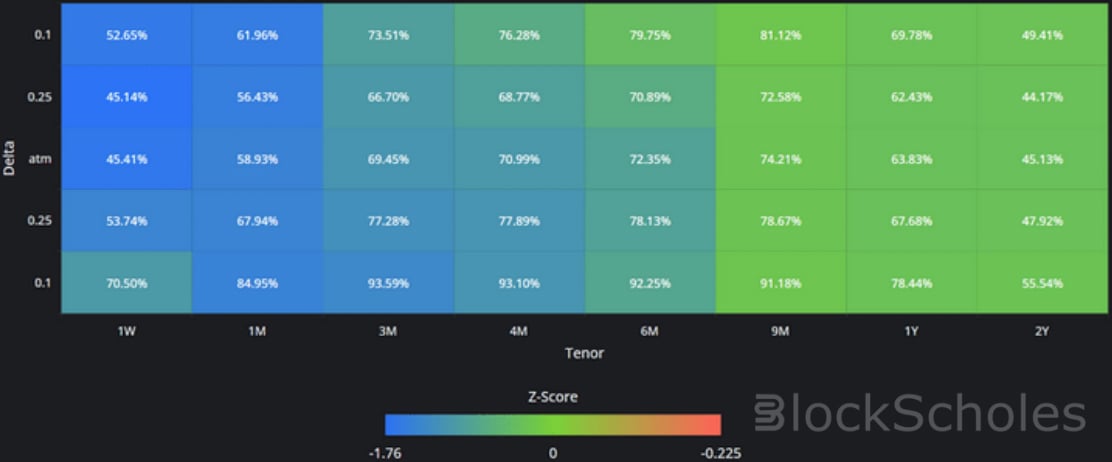
Z-Score calculated with respect to the distribution of implied volatility of an option at a given delta and tenor over the previous 30-days of hourly data, timestamp 10:00 UTC.
SABR Rho

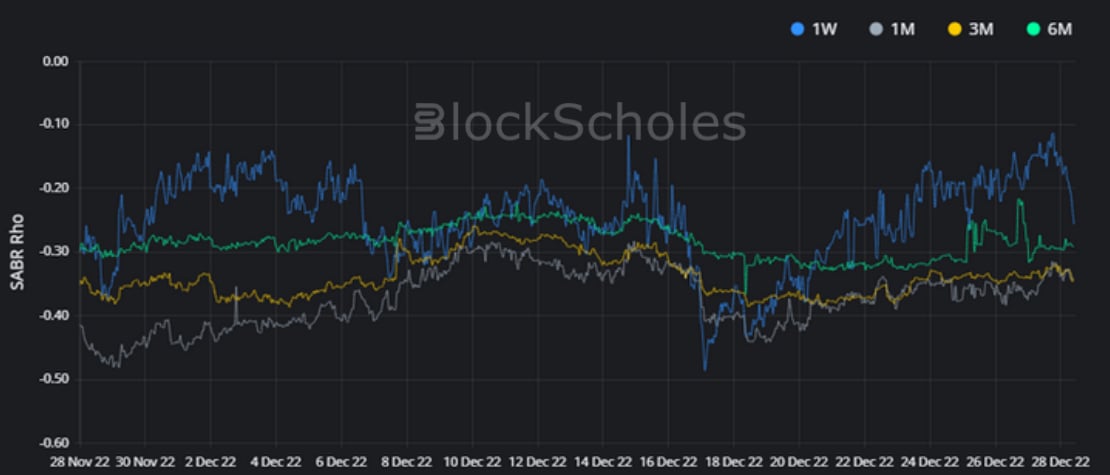
BTC SABR RHO – the trend towards a neutral skew in the volatility smile returns at a 1W tenor, before a dramatic reversal in the last 24 hours.
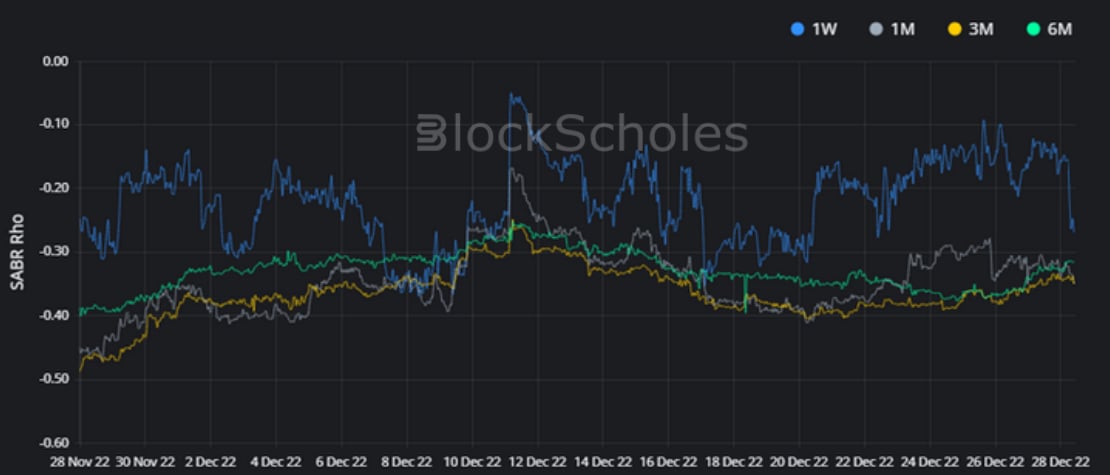
ETH SABR RHO – sees the same trend towards a neutrally skewed smile, as well as the sharp return to a skew towards OTM puts in the last day.
Volatility Smiles
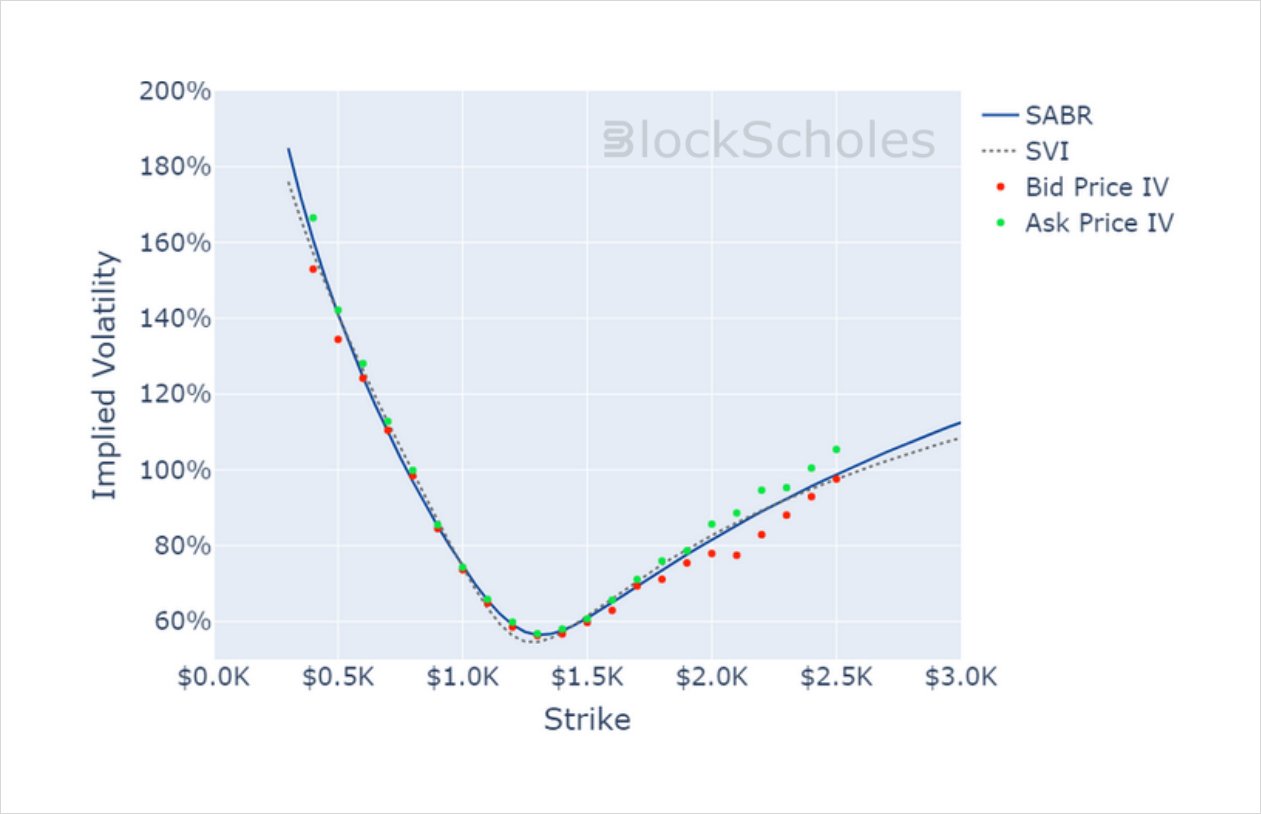
BTC SMILE CALIBRATIONS – 27-Jan-2023 Expiry, 11:00 UTC Snapshot.
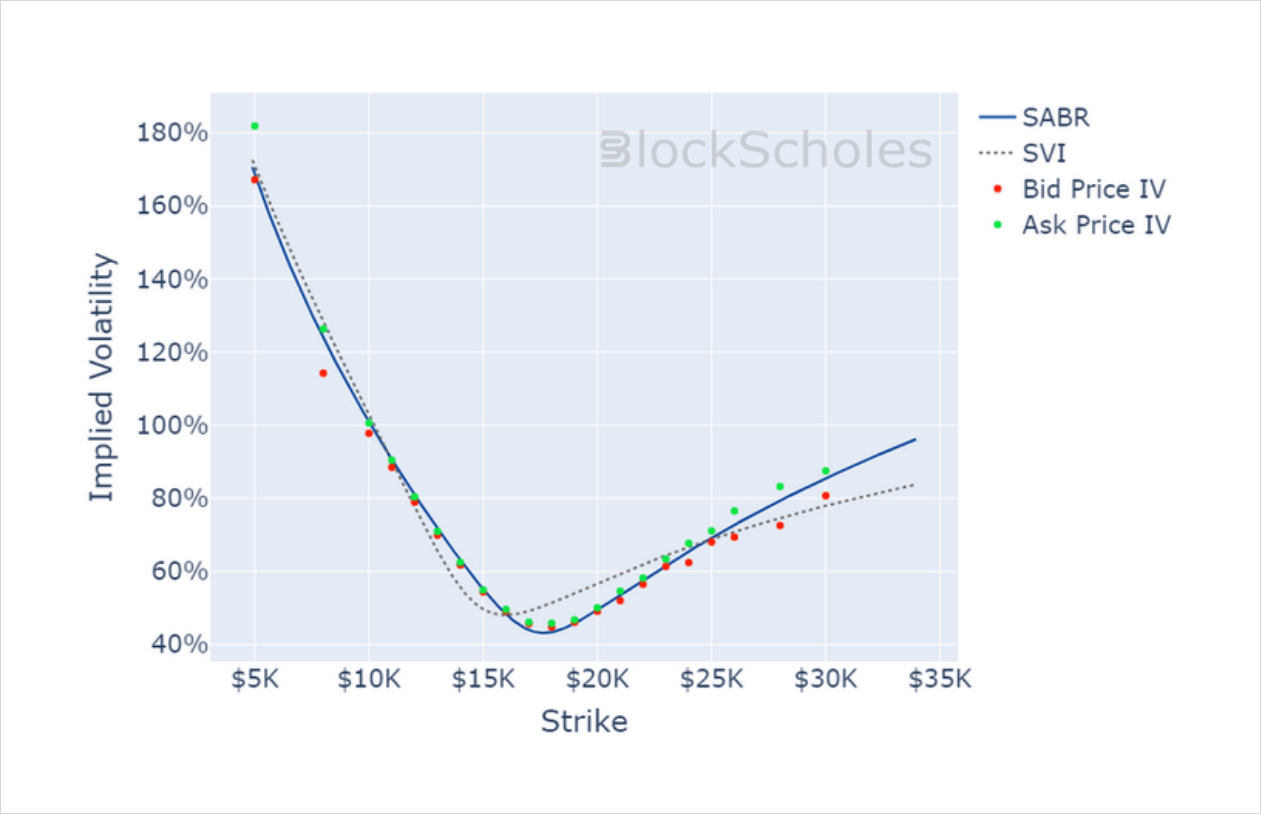
ETH SMILE CALIBRATIONS – 27-Jan-2023 Expiry, 11:00 UTC Snapshot.
Historical SABR Volatility Smiles
BTC SABR CALIBRATION – 30 Day Tenor, 10:00 UTC Snapshot.
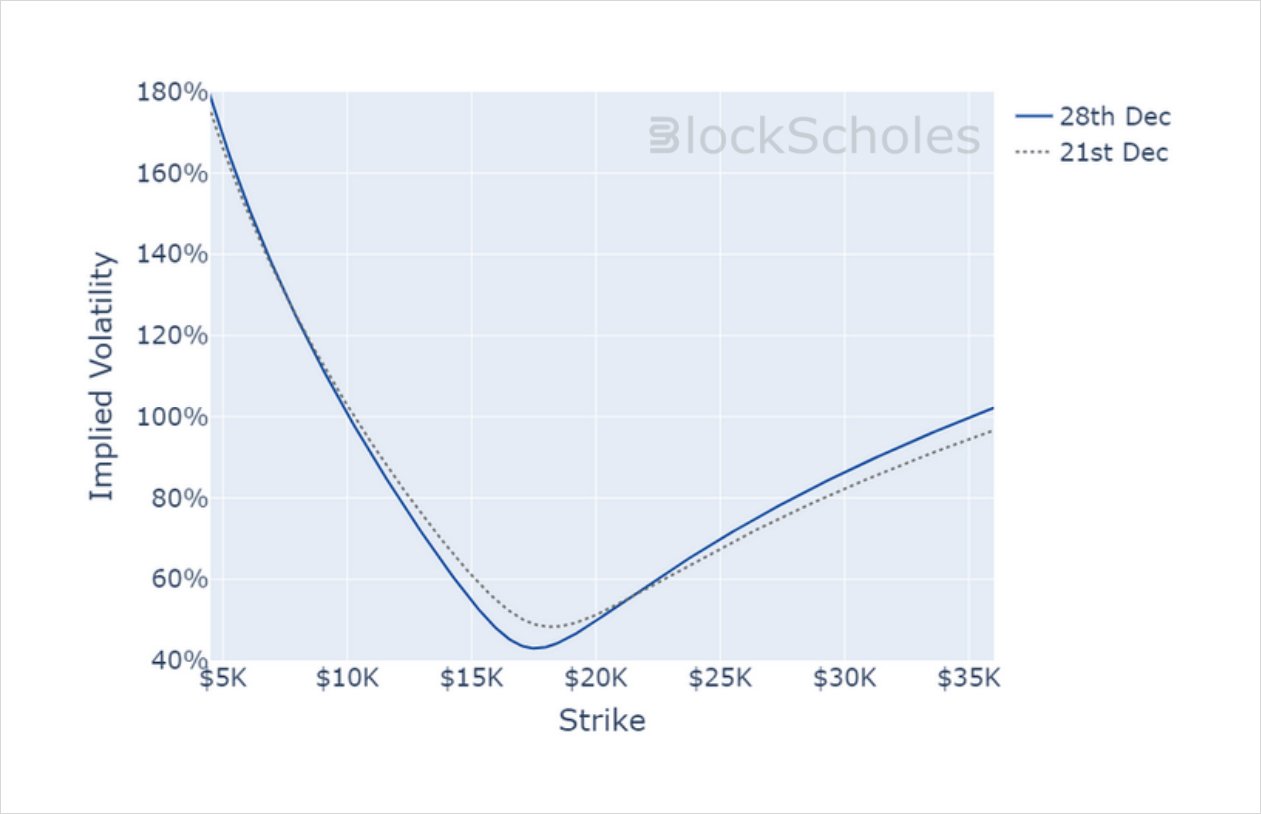
ETH SABR CALIBRATION – 30 Day Tenor, 10:00 UTC Snapshot.

AUTHOR(S)
