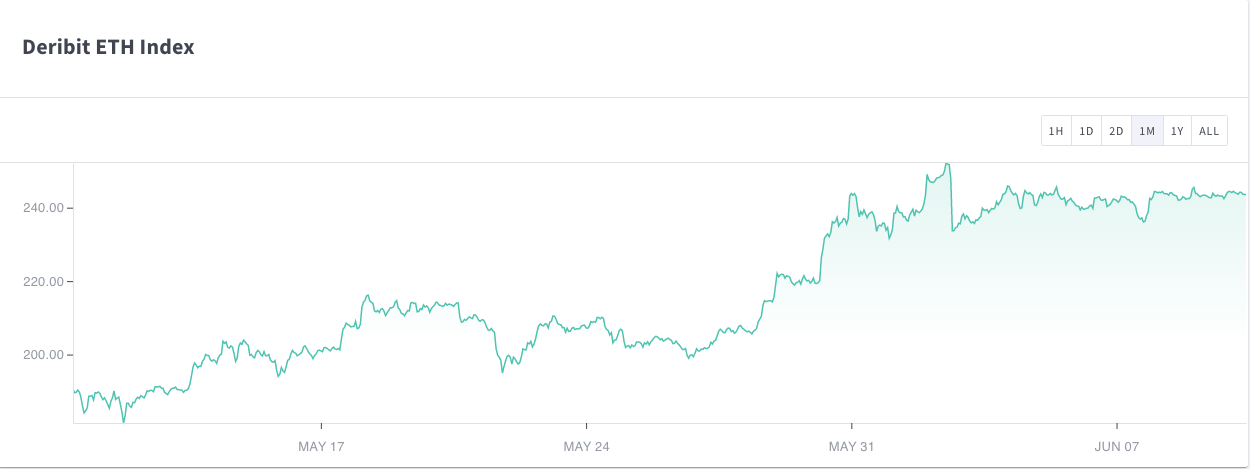
As Ethereum approaches Phase 0 of its Serenity upgrade — dubbed Ethereum 2.0 — there appears to be a wave of optimism surrounding this milestone. One of the most covered news along these lines is the 700% premium that Grayscale’s Ethereum Trust is trading at relative to spot prices. While this can be interpreted as a sign of institutional interest in Ethereum, on-chain data and derivatives indicators provide a clearer image of how Ethereum holders are behaving. Leveraging IntoTheBlock’s metrics we are able to derive insightful patterns emerging as the initial phase of Ethereum 2.0 approaches.
Addresses’ Profitability Points to ETH Holders Buying the Dip
IntoTheBlock’s Historical In/Out of The Money (HIOM) indicator analyzes positions on the blockchain, based on addresses’ average cost for a particular token in this case – ETH. Based on this, the HIOM calculates the percentage and the total number of addresses that are “in the money”, or profiting on their positions on paper, borrowing from options terminology. Moreover, by comparing variations in the HIOM over time we can ascertain buying/selling activity based on the number of addresses profiting at a specific price level.

At the time of writing, the price of Ether sits at approximately $244. The last time when ETH prices held around this level for a prolonged period was in early March prior to the 40% price drop incurred during Black Thursday, March 12. At that moment, 18.16 million addresses (just under half of those with a balance) were in the money, and 17.29 million addresses (47%) would have lost money if they sold. As panic ensued as a result of the coronavirus pandemic, Ether prices dropped significantly but managed to recover within three months.
If we compare the Historical In/Out of The Money today versus what we saw in early March, we observe signs of new buyers entering the market and existing addresses accumulating at lower prices. In the graph below we can see how the number of addresses in the money at an ETH price of $244 increased by over 4 million in just three months:

Since the total number of addresses holding Ether also increased during this period, this indicates that new buyers have entered the market during the period following Black Thursday. Additionally, the number of addresses out of the money decreased by 1 million, pointing to some users realizing losses on their positions. Finally, with over 55% of Ether holders now profiting from their positions, it is also likely that many holders accumulated ETH at lower prices bringing their average cost down.
Ethereum Hodlers & Addresses with a Balance at an All-time High
Another sign of adoption of Ethereum can be observed by analyzing the total number of addresses that hold a positive balance of Ether. As previously mentioned, the total number of addresses holding Ether has increased since March. In fact, it has been on a constant upward trend since 2017, as seen in the image below:

Year to date, 6.36 million addresses with a balance have joined the Ethereum network, making it over one million a month. This remarkable growth in the number of addresses holding Ether has led it to surpass the number of addresses holding Bitcoin, making Ethereum the only blockchain with over 40 million addresses with a balance.
Similarly, the number of Ether hodlers — which IntoTheBlock classifies as addresses with a holding period of over a year — are at an all-time high. The volume of tokens held for over a year reached 61.27 million, meaning that 55% of the 111 million Ether in circulation belongs to hodlers. Moreover, the number of hodlers has been increasing steadily throughout the year despite the volatility seen in March. These patterns can be interpreted as a sign of long-term investment in the Ethereum blockchain, as Ethereum 2.0 appears to be on track for Phase 0 this summer.

Perpetual Swaps Open Interest Remains Near Quarterly Highs
Perpetual swaps, and derivatives in general, have become a prominent part of the crypto ecosystem in recent years. As derivatives have grown significantly in proportion to spot markets, their impact on token prices has become more closely monitored. The trend observed in the Ethereum derivatives class adds to the narrative of increased institutional adoption.
Even though the first US-regulated Ethereum futures contract was launched last month on ErisX, unregulated exchanges still dominate the market.
By aggregating the open interest for Ethereum perpetual swaps, we are able to observe the total dollar amount of outstanding positions for Ethereum contracts. As can be seen in the graph below, open interest on Ethereum perpetual swaps reached $411.35 million on 1 June. Similarly, to the patterns seen with on-chain indicators, this is the first time this level has been reached since early March of this year.

Having increased by 56% over the last month, the rising open interest levels paired with the 30% increase in Ether’s price show bullish positioning in derivatives markets. Despite dropping slightly since 1 June, the overall trend in open interest for Ethereum perpetual swaps potentially signals an increasing institutional exposure for the second-largest cryptocurrency.
Overall, several on-chain and derivatives indicators point to the adoption and use of Ether as Ethereum 2.0’s initial phase approaches. With key metrics such as total addresses with a balance and number of addresses hodling at an all-time high, Ethereum’s fundamentals appear to be stronger than at its 2017 peak.
Furthermore, the significant increase in holders’ profitability and perpetual swaps open interest demonstrates investors have been going long on Ethereum following the crash on Black Thursday. While it is uncertain that price will follow these metrics, Ethereum’s key indicators show strong adoption and optimism ahead of its anticipated protocol upgrade.
To learn more about ETH, go to Deribit Market Data or visit IntoTheBlock’s derivatives section, which tracks key indicators for both perpetual swaps and futures, with options coming soon to the platform.
AUTHOR(S)
