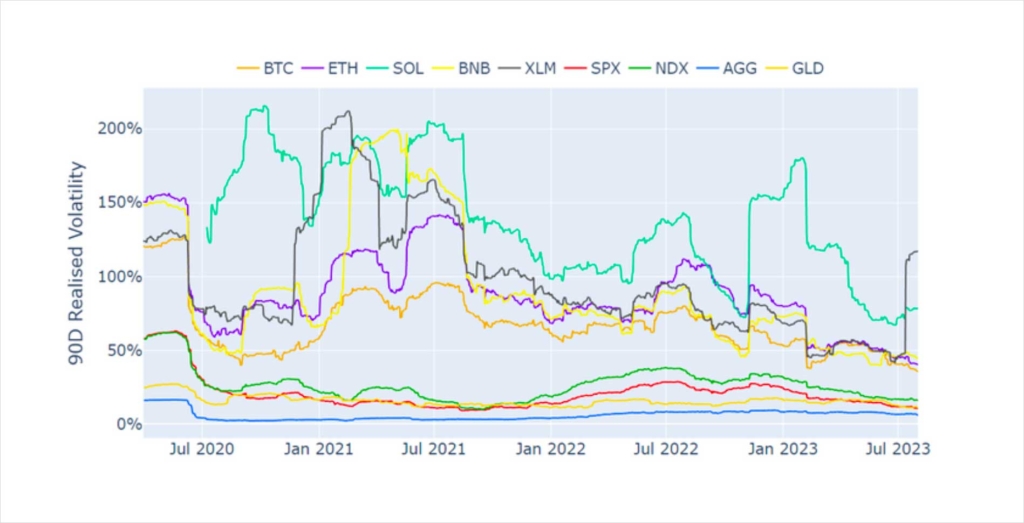
The ultra-low implied volatility of BTC and ETH has occured happening at the same time as historically low realised volatility across the crypto-asset market. With the exception of XRP and XLM, we observe spot prices moving with the lowest level of volatility in the last three years, which for some assets constitutes their entire history. Historically, crypto-asset volatility has shown low correlation to equities, instead clustering within the crypto-asset market. A recent increase in that correlation has fallen closer to zero following the passing of early November out of the lookback window of each asset.
Falling Realised Volatility

Figure 1 Rolling 90-day standard deviation of log-returns for several major crypto-assets, alt-coins, and ‘traditional’ asset class indices. Source: Yahoo Finance, Block Scholes
- The fall in crypto-assets realised volatility has reached an all-time low across the market.
- We have previously noted the low values recorded for major coins BTC and ETH when highlighting the drivers of their historically low volatility implied by their option prices.
- We find that this is also true of many smaller cap or alt-coins, as well as for several benchmark indices for gold, US equities, bonds, and tech stocks.
- Notable exceptions include XLM and XRP following the dismissal of some regulatory allegations earlier this month.
Historical Correlation

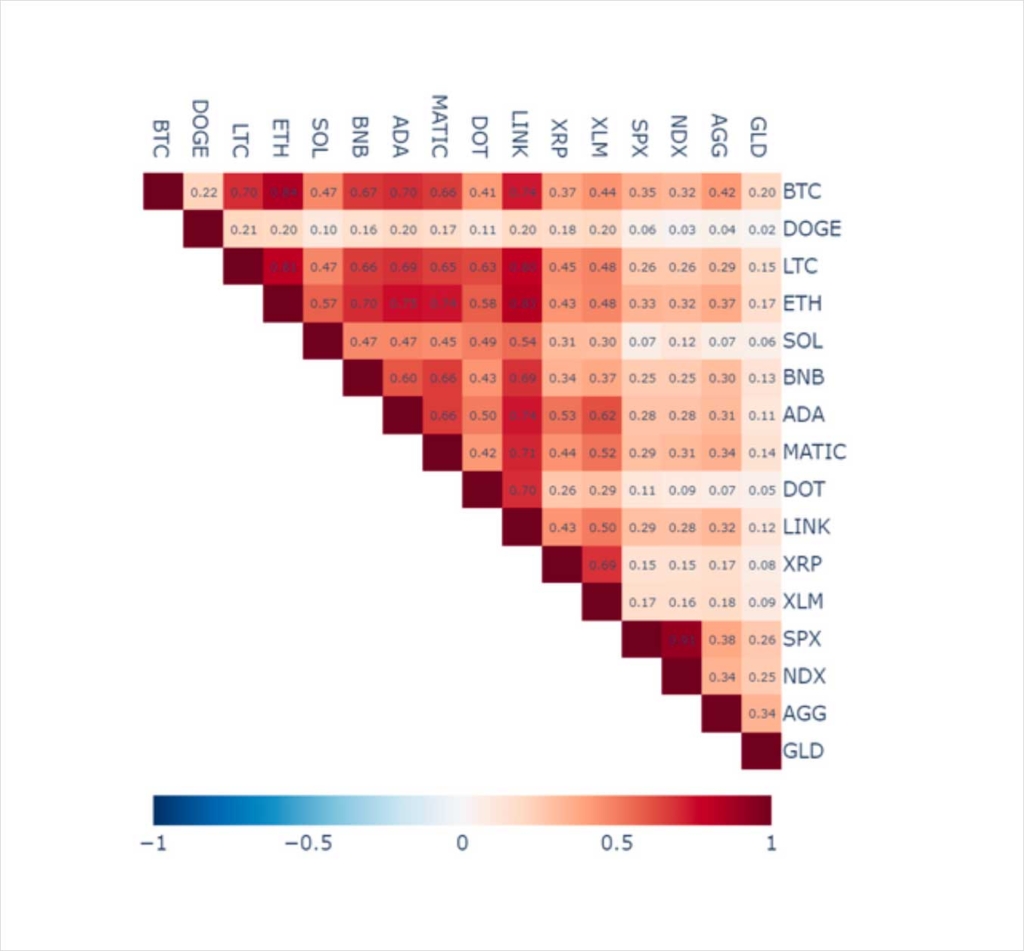
Figure 2 Pairwise correlation of changes in realised volatility between major crypto-assets, selected alt-coins, and major investment asset class indices. Source: Yahoo Finance, Block Scholes
- We see no negative correlation in the realised volatility of any pair of assets considered.
- In particular, we see strong correlation within the crypto-asset cluster.
- However, we do see a noticeable drop in correlation when considering the realised volatility of a crypto-asset with a traditional asset such as bonds, equities, and gold.
- The realised volatility of DOGE has been least correlated to the wider crypto-asset market, whilst LINK, likely owing to its close relationship with other DeFi protocols, saw volatility move closely with many of the other crypto-assets considered.
Volatility Correlations

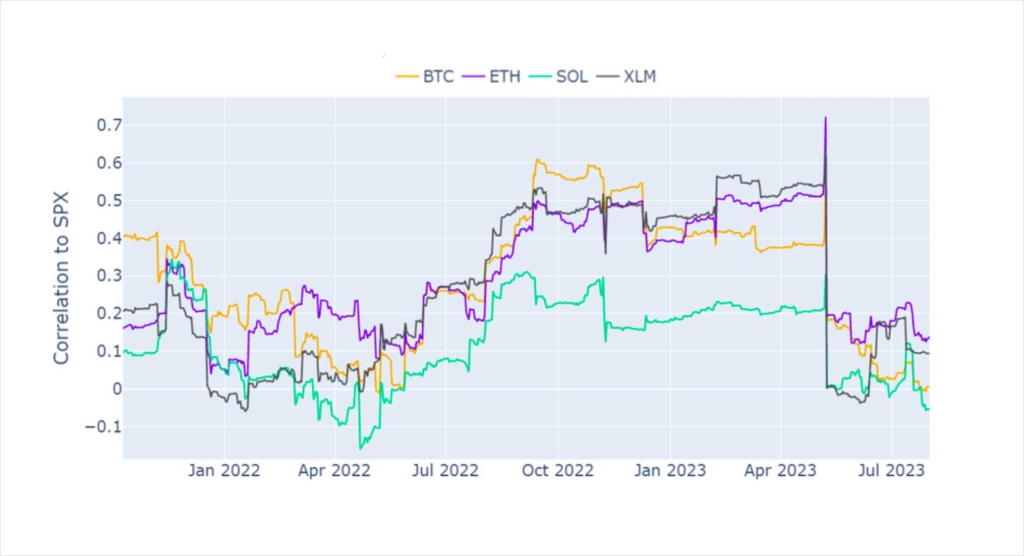
Figure 3 Rolling correlation of the realised volatility of selected crypto-assets to that of US equities, as measured by the SPX index. Source: Yahoo Finance, Block Scholes
- The correlation of crypto-asset realised volatility to that of equities has been low since early May.
- This is 90 days after the realised volatility fell dramatically for all assets, after remaining elevated since the FTX crash in crypto-assets coincided with a similarly volatile event in equities.
- Prior to that, we had observed crypto-asset volatility move similarly to that of equities since the middle of last year.
AUTHOR(S)
