The recent spot really saw crypto prices increase all across the wider crypto market, with ETH and altcoins alike observing higher returns than BTC. This action dampens the uptrend in Bitcoin dominance (a metric which measures Bitcoin market capitalisation relative to the whole crypto market), one that has been observed in the 2018 bear market.
BTC out-performing ETH

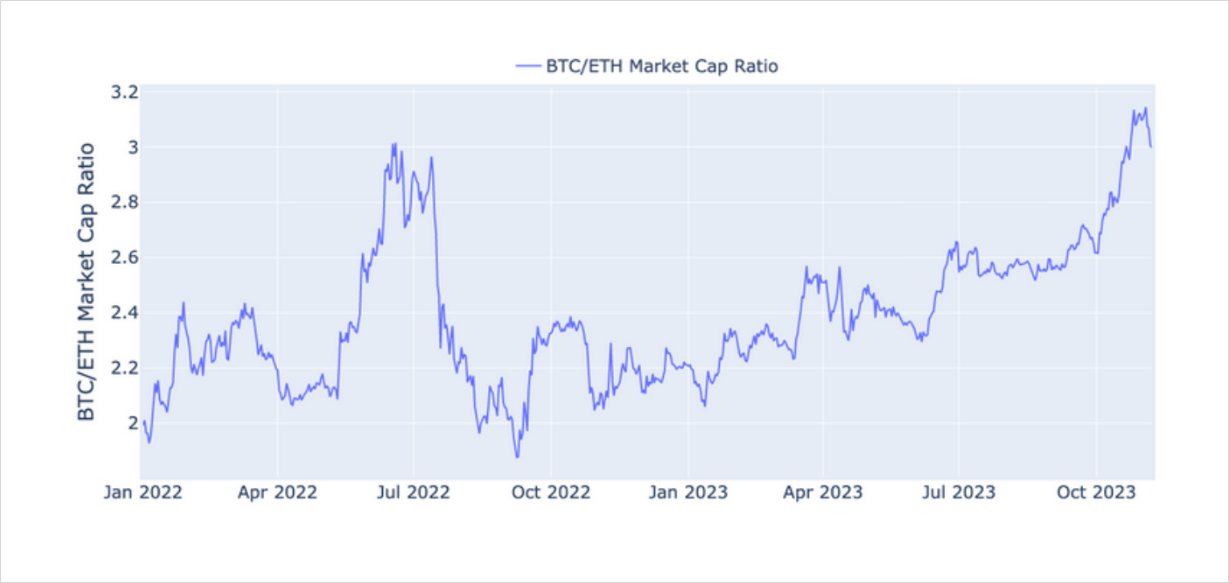
Figure 1 Daily Market Cap ratio of Bitcoin against ETH since January 1, 2020. Source: CoinGecko
- Since the early bear market of 2022, we have seen Bitcoin market capitalisation, the total value of all bitcoins in circulation, increase relative to ETH’s.
- More recently since October, this trend has continued at a rapid pace, with bitcoins market cap ratio gaining 16% since the start of the year.
- The most recent spot price rally has seen this ratio decrease, with ETH outperforming BTC.
Bitcoin against Alt-coins

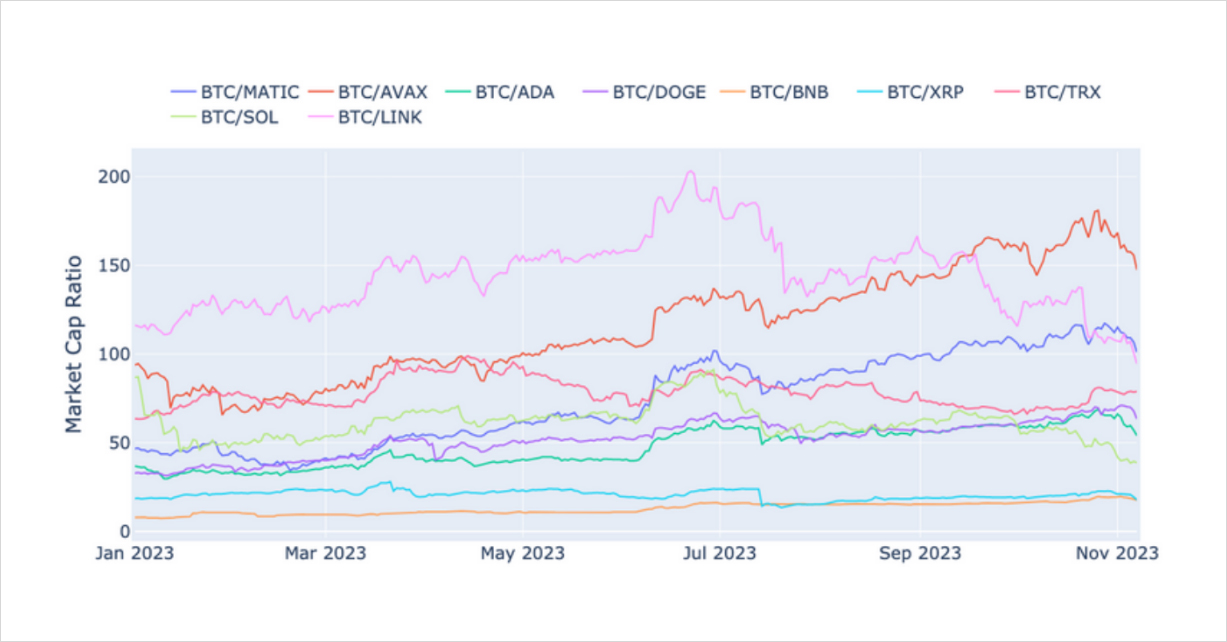
Figure 2 Daily Market Cap ratio of Bitcoin against a range of altcoins since January 1, 2023. Source: CoinGecko
- The upward trend of Bitcoins market cap relative to other altcoins markets had largely been respected.
- The most recent spot price rally has similarly seen Bitcoin’s market cap ratios against other prices decrease as capital flows in altcoins at a faster pace than BTC.
- This ratio has historically trended upward as observed in the 2018 bear market, an indication of consolidation of capital from the more volatile altcoins, into BTC.
Bitcoin Dominance

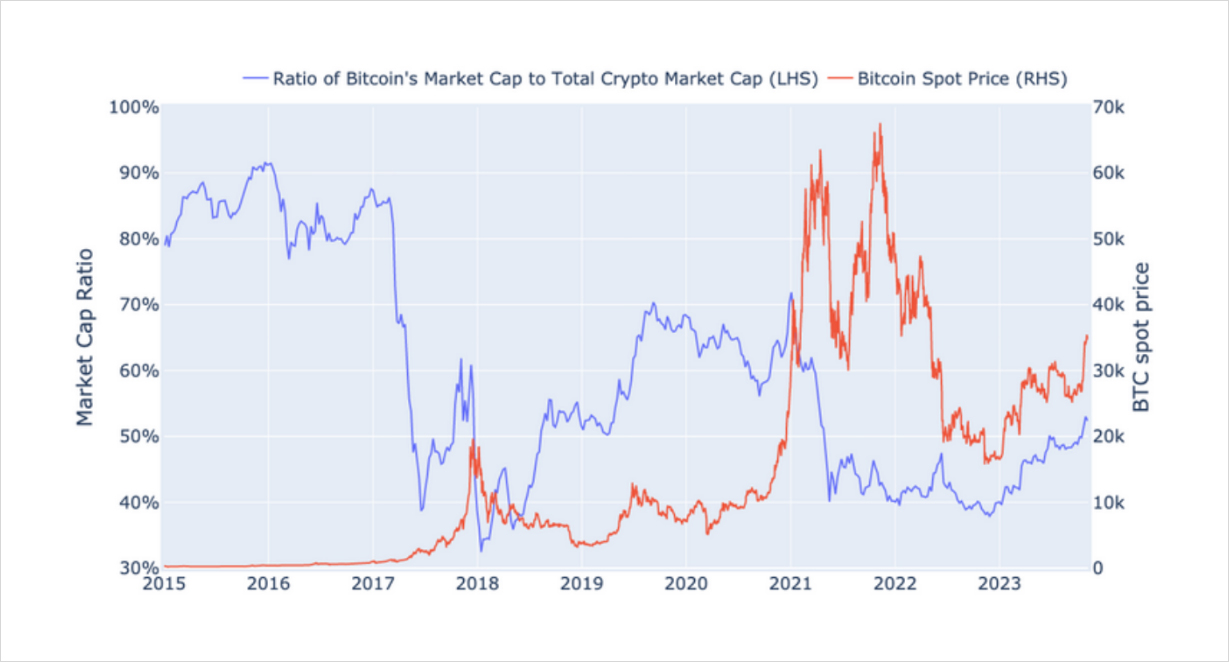
Figure 3 Daily Bitcoin spot prices since January 2015 (Red) and Bi-weekly Bitcoin dominance since January 2015. Source: CoinmarketCap, CoinGecko
- Large downward moves in Bitcoin dominance have typically coincided with Crypto bull markets, as capital flows into more speculative assets during this period.
- We have observed this ratio increasing in the following bear market, a trend that we are currently observing.
AUTHOR(S)
