

In the first part of this option backtest series, I analysed the historical performance of selling weekend bitcoin volatility. In this second part in the series, I’m going to explore what has happened with that same exact strategy in the 8 months following the first part of the series. Has it continued to work, or have Trump news cycles caused a damaging spike in realised vol? The backtest will then be expanded out to execute trades on all days, not just Fridays.
If you missed the previous piece, or just want to refresh your memory, you can read the full article here.
Recap
To briefly recap, although other variations of the opening time and delta parameters were also tested to check for robustness, the details of the initial strategy tested are the following:
Strategy: At 16:00 UTC every Friday, sell a 0.35 delta strangle that expires on Sunday at 08:00 UTC, and hold the options to expiry. Whichever options are closest to the target of 0.35 delta will be sold, up to a maximum delta difference of 0.1.
Fees: The regular Deribit fees are included (0.0003 BTC per option), as is 5% slippage on the premiums collected.
Trade size: The starting balance is assumed to be 1 BTC, and both the put and call are sold with a flat quantity of 1 each week. The trade size does not vary based on any increase/decrease in the balance.
For the period of 2020-01-01 to 2024-08-31, we saw the following results:
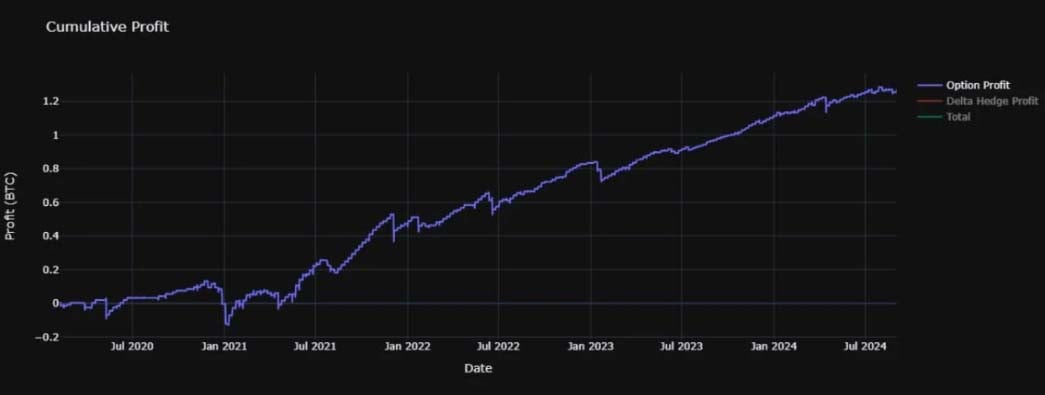
Number of trades: 212 (169 wins, 43 losses)
Net profit: 1.2485 BTC (+124.85%)
Average profit per trade: 0.0059 BTC
APR: 27.4%
Maximum drawdown percentage: 23.8%
Maximum absolute drawdown: 0.27 BTC (27% of starting balance)
What happened next?
As we saw, this strategy would have shown a respectable profit over the backtest period up to the end of August 2024, but how has the same strategy performed in the following 8 months? This latest 8 month time period includes the US election, Trump taking office with his pro-crypto stance, and several news based price moves happening around the weekends (often driven by tariff announcements or posts by Trump or his team). Given this different type of market environment, how will this strategy of selling weekend volatility have performed?
Using the same parameters as before, these are the results for the period of 2024-09-01 to 2025-04-30:
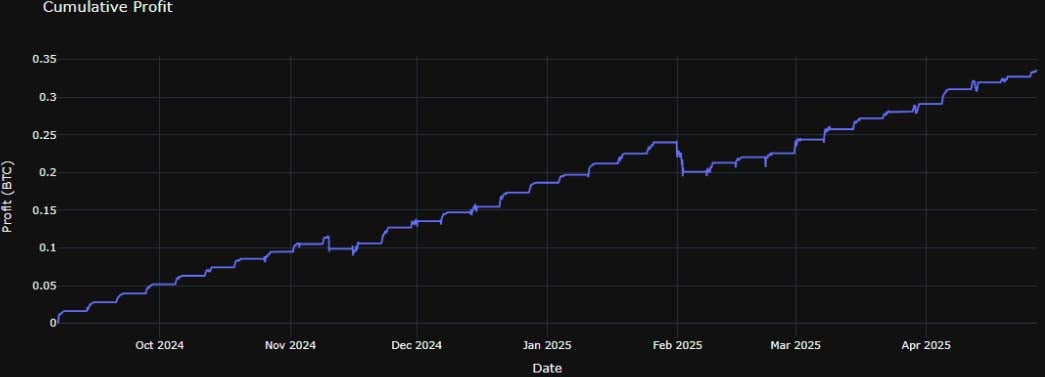
Number of trades: 34 (32 wins, 2 losses)
Net profit: 0.2912 BTC (+29.12%)
Average profit per trade: 0.0086 BTC
APR: 45.8%
Maximum drawdown percentage: 3.9%
Maximum absolute drawdown: 0.05 BTC (5% of starting balance)
A period of excellent performance then. To be clear though, the returns of this strategy are negatively skewed (meaning frequent small wins accompanied by occasional losses of a much larger size), and during this relatively short period of time the strategy simply hasn’t experienced the left tail of the distribution of returns. In other words the strategy has run above expected value in this short period. With the exception of the first week of February, where there was a drawdown of around 5% of the starting balance, the equity line is as close to a straight line up as one could hope for.
This is what a typical negatively skewed distribution looks like:
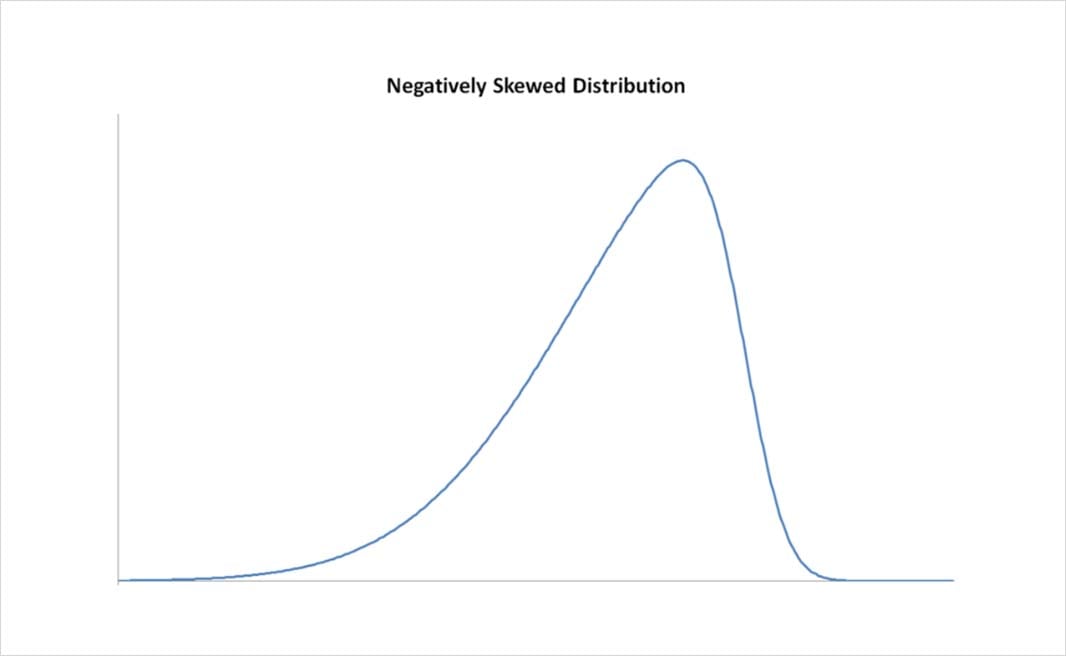
Most of the values are towards the right side of the distribution, with the left tail much longer than the right tail. In the context of returns, this translates to a high frequency of small wins at the peak of the curve, with less frequent but larger losses in the fatter left tail of the distribution.
For strategies that have negatively skewed returns, the shorter the time period looked at in a backtest, the less likely it is that at least one of the expected large losses from the left tail of the distribution will be observed. Therefore the more likely the backtest is to paint an overly optimistic picture of the strategy’s performance.
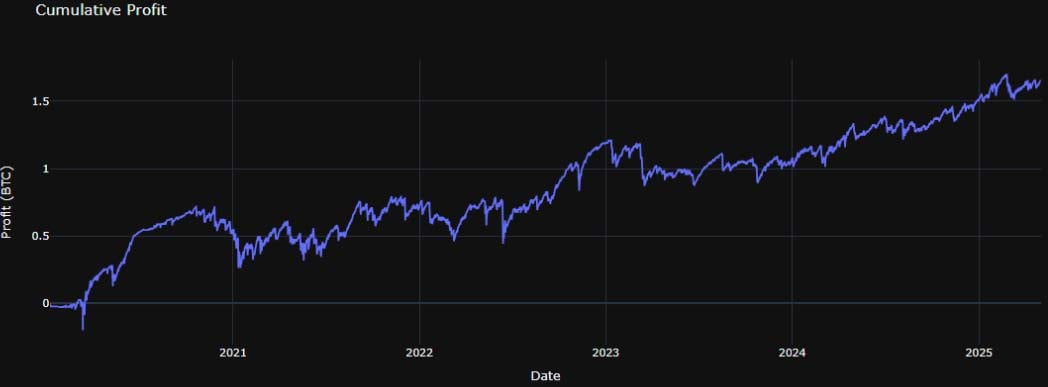
The full period
Looking at the same strategy over the entire period including the last 8 months (2020-01-01 to 2025-04-30), we get the following results:
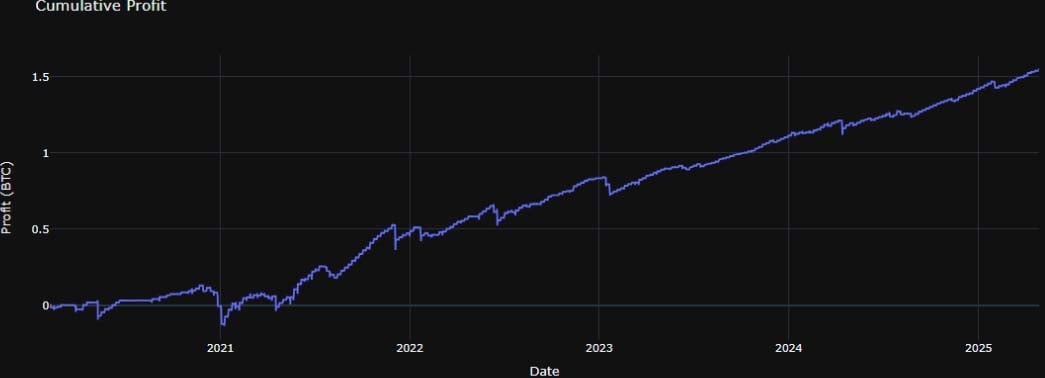
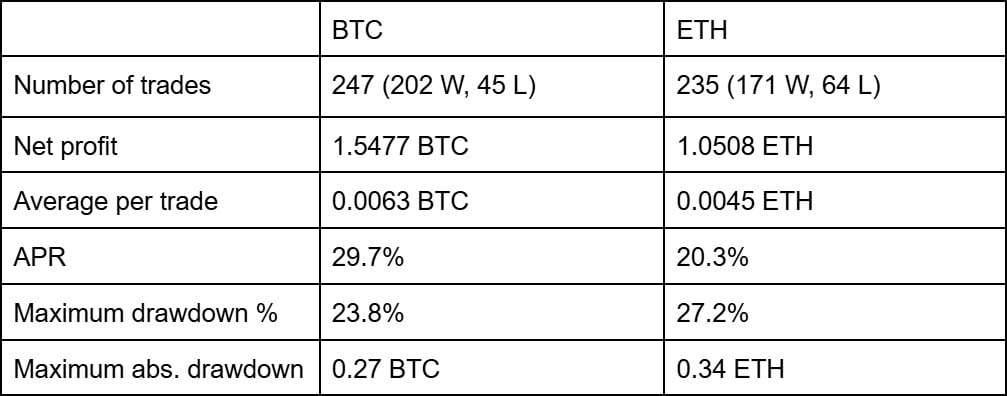
Number of trades: 247 (202 wins, 45 losses)
Net profit: 1.5477 BTC (+154.8%)
Average profit per trade: 0.0063 BTC
APR: 29.7%
Maximum drawdown percentage: 23.8%
Maximum absolute drawdown: 0.27 BTC (27% of starting balance)
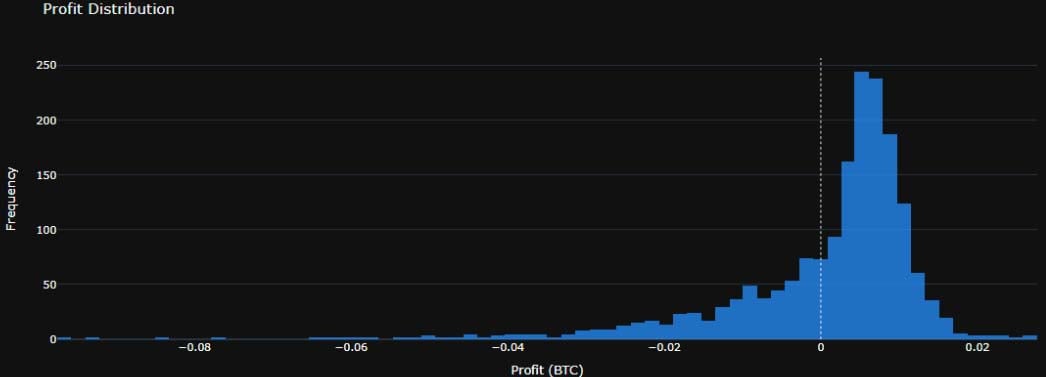
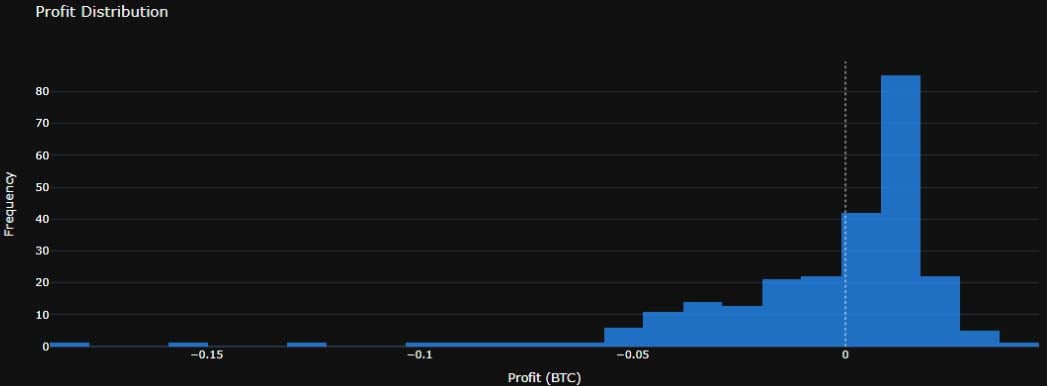
The following histogram shows the distributions of returns over this period:
As the starting balance is 1 BTC, this chart can also be read as percentages of the starting balance, e.g 0.01 = a gain of 1% of the starting balance, -0.05 = a loss of 5% of the starting balance. There are enough trades to start to see the typical shape of a negatively skewed distribution appearing. There are lots of small wins, but also occasional large losses.
TGI Friday?
We’ve only looked at selling on Fridays so far, because the initial idea was to sell weekend volatility specifically. Is this just a Friday phenomenon though, or will selling the same options on any day also perform similarly? To gain some insight into this, let’s now look at how selling a 2 DTE (Days To Expiry) 0.35 delta strangle performs if executed every day.
If looking at each day individually, this is the PNL split by position opening day:
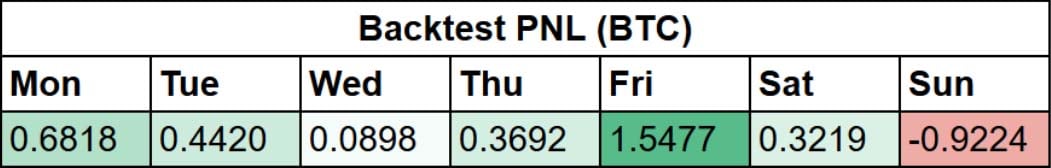
With the exception of Sunday, which will be looked at in more detail shortly, all days show at least a small profit. However, the positions opened on Fridays are clearly providing a significant portion of the performance in this backtest.
The figures in the above table assume position sizes are kept at 1, however in practice this would need to be lowered to make sure a similar amount of risk is being taken to the Friday only strategy. The reason for this is that selling 2 DTE options every day will lead to overlapping positions a lot of the time. For example, if the account first sells options on Monday that expire on Wednesday, and then sells options on Tuesday that expire on Thursday, at that moment in time the account is holding double the position size. Instead of being short just 1 put and 1 call, the account would be short 2 puts and 2 calls.
If the position sizes are halved to 0.5, we get the following results:
Number of trades: 1780 (1228 wins, 552 losses)
Net profit: 1.265 BTC (+126.5%)
Average profit per trade: 0.0007 BTC
APR: 23.8%
Maximum drawdown percentage: 26.5%
Maximum absolute drawdown: 0.45 BTC (45% of starting balance)
This table compares the results from the Friday only backtest and the all days backtest:
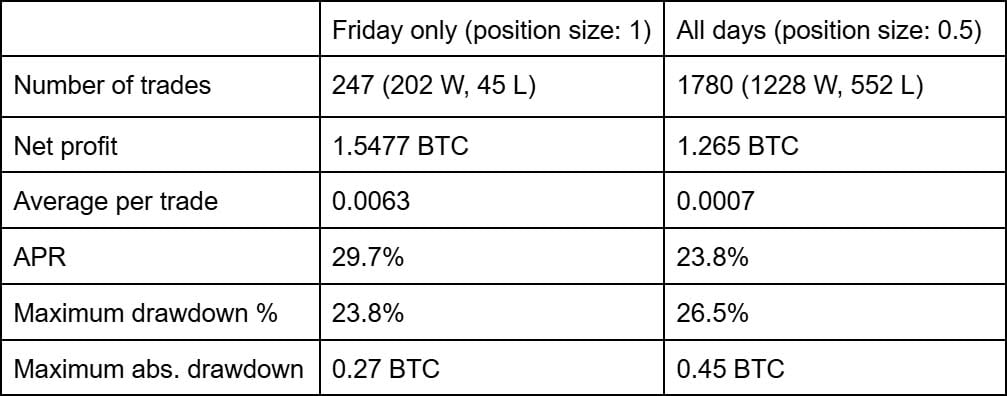
The performance is clearly worse when trading every day at half size. The total profit, and therefore the APR, are a little lower. The profit per trade is much lower.
The increase in the maximum drawdown would seem to jump out as a cause for concern. In percentage terms it doesn’t look too bad, but because flat position sizing is used, rather than adjusting the position size according to the rolling balance, it is the maximum absolute drawdown in BTC that is more relevant. A drawdown of 0.45 BTC means a drawdown of 45% of the starting balance. While this could be due to the other days being inherently riskier than Fridays, it could also simply be that the larger sample size means the left tail is more accurately represented.
Even though the eventual total return is decent, many traders would not be willing to accept a strategy that has a loss of nearly half the capital even in the likely overoptimistic world of a backtest. So, although selling bitcoin volatility systematically every day via 0.35 delta strangles at this size has proven to be profitable on average in the past, it is not optimal.
Bloody Sunday
Given that every other day generated at least a small profit, the size of the loss of positions that were opened on Sundays warrants a closer look. The performance on Sundays is so negative that an account only selling the strangles on Sundays would have been bankrupted. Is this just the result of a few bad results in the left tail of the distribution all happening to come on Sundays, or is there consistently different behaviour exhibited during this part of the week. Let’s isolate the Sunday results and see if things become clearer.
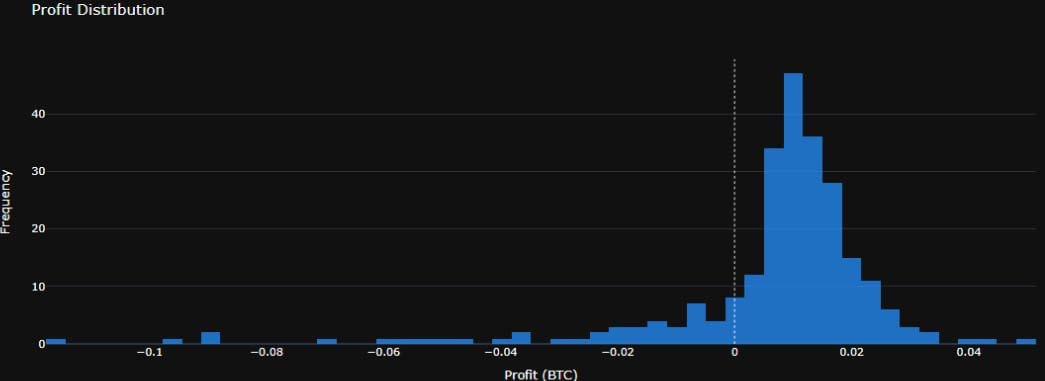
The following chart shows the results of selling the 2 DTE 0.35 delta strangles only on Sundays, with a position size of 1:
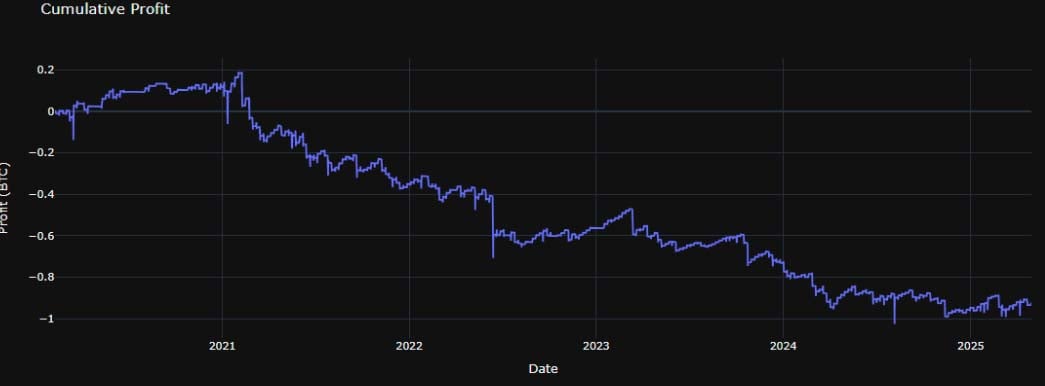
Number of trades: 251 (153 wins, 98 losses)
Net profit: -0.9224 BTC (-92.24%)
Average profit per trade: -0.0037 BTC
APR: -17.7%
Maximum drawdown percentage: 102.1%
Maximum absolute drawdown: 1.21 BTC (121% of starting balance)
Note: My backtest code does not stop when the starting balance is depleted, so it is possible to have a drawdown of over 100% recorded. In reality of course the account would have been liquidated as the balance approached zero. Or to be more precise, the open position would have been liquidated as the equity dropped below the maintenance margin requirements for that position, and this would then have left the account with insufficient funds to open a new position.
There were a handful of large losses, including a particularly large loss of 0.1867 BTC, but these were not the only source of the negative returns. Nearly 40% of the trades were losers, so as well as a few large losses, there were many smaller losses.
The following histogram shows the distribution of returns:
Bitcoin markets on crypto exchanges like Deribit are open 24/7, but could this more consistent underperformance be linked to the hours of traditional markets? Is it the result of selling the options on typically low volatility Sunday mornings, and then price moving more than the options implied when traditional markets open on Mondays?
It would be logical given the relatively consistent decrease in the PNL when selling on Sundays to wonder if buying the strangle on Sundays instead would have performed well. However, after fees and slippage, the APR was only 2.1%, and the results included a 0.45 BTC drawdown. If a strategy is a consistent loser in a backtest, it gives a strong indication that the strategy should be avoided, but it doesn’t necessarily make the opposite side of the trade a good choice.
What about ETH?
BTC remains dominant, with the majority of volume on Deribit still being contributed by the BTC options markets. However, for those traders that prefer the lower notional size and the typically higher volatility levels of ETH, the following shows the results of the same strategy of selling 2 DTE 0.35 delta strangles every Friday at 16:00 UTC, but this time on ETH:
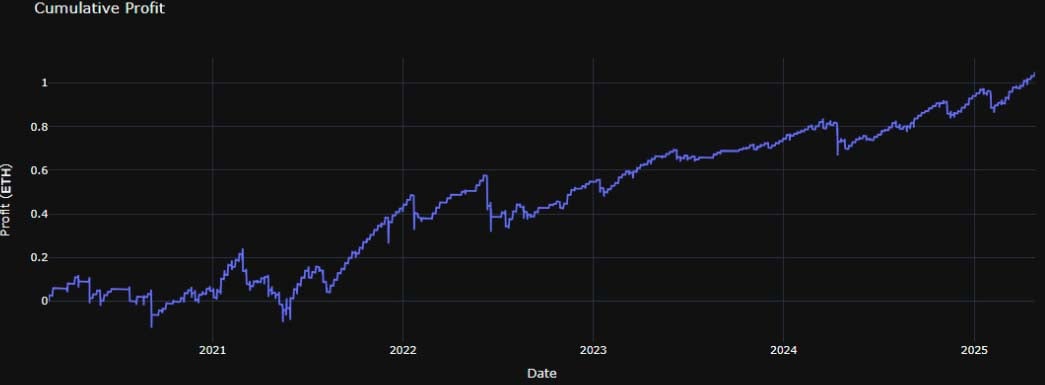
Note: Daily ETH options were added to Deribit in February 2020, so there are no ETH trades for this 2 DTE strategy in January 2020.
Number of trades: 235 (171 wins, 64 losses)
Net profit: 1.0508 ETH (+105.08%)
Average profit per trade: 0.0045 ETH
APR: 20.3%
Maximum drawdown percentage: 27.2%
Maximum absolute drawdown: 0.34 ETH (34% of starting balance)
Comparing this to the performance of the same strategy on BTC, we can see that while performance was somewhat similar, it was worse on ETH. The profit was lower, and the largest drawdown was larger:
Summary
Selling short dated bitcoin options just before the weekend has performed well for several years. As seen in the previous piece on this subject, the positive results were robust to changes in the timing and deltas chosen. As we have continued onto today though, selling options on the weekend itself, particularly on the Sunday, has performed poorly.
Although there are no signs yet of the performance of this Friday strategy failing, it will be interesting to see if these same patterns persist in the future. The growth of the crypto options market, and the entrance of more institutional players and structured products, many of whom will be vol sellers, are certainly things to keep an eye on that could potentially dampen or even destroy the performance.