
The Deribit Position Builder is a powerful tool that allows you to build portfolios and view the portfolio profit/loss chart. The portfolios can consist of multiple positions of both options and futures, and will display the profit/loss for the portfolio as a whole on the chart.
Before diving into some examples let’s take a quick look at the navigation on the page.
Top left menu
In the top left menu you will see the following options:
- Light/Dark Theme – Sets the colour scheme for the page.
- Reset layout – If you have adjusted the page layout, this button will reset it to the default layout.
- Realtime Updates – When green this option will keep pulling live data from the Deribit exchange, including the positions from the account you have logged in to.
- Production Environment – Toggles whether you are connecting to data from the production website (green) or the test website (red).
If you have logged into the Deribit Position Builder you will also see the following additional options in the top left menu:
- Load Portfolio – This will pull in the current positions from the account you have logged in with. They will be listed in the positions table in the ‘Portfolio’ tab at the bottom under the subheading ‘Actual Positions’.
- Clear Portfolio – Will remove all positions from the table at the bottom. This only affects the Position Builder and has no effect on the positions in the exchange account itself.
- Share Portfolio – A URL link is generated enabling you to easily share your portfolios and ideas with friends, work colleagues or on social media.
Logging in
If you just want to build theoretical positions and portfolios without sharing them, logging in is not compulsory. However if you would like to pull in your live positions and/or share links to what you have built then you will need to log in.
To log in click the ‘Log in’ button in the top right. You can log in to test or production accounts, but make sure you have the correct one toggled in the left menu before attempting to log in, as the details from one will not work on the other.
Authorising the application
As the Deribit Position Builder will require access to your account through the API, authorisation will need to be given when logging in for the first time.
During your first log in you will get the following pop up:
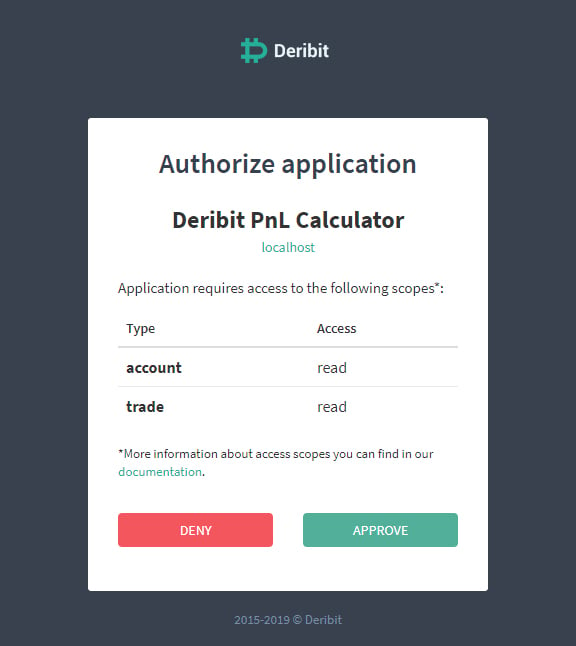
As you can see the permissions required are limited to read only access. Click ‘Approve’ to give the Position Builder permission to read this data from your account.
You can also revoke this permission at any time by navigating to the API page of the settings in your account on the Deribit exchange website. On this page, at the bottom, you will see the ‘Authorised applications’ section.
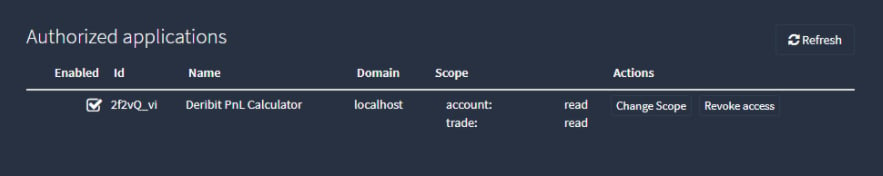
This will list any applications such as the Deribit Position Builder along with their permissions. If you wish to stop the application having access at any time, simply click ‘Revoke access’.
Choosing the currency
At the top of the Deribit Position Builder you can choose which currency you would like to build a portfolio for, for example Bitcoin or Ethereum.
Just below the currency selection some statistics for the portfolio will be displayed. These include:
– The profit/loss
-Delta
-Gamma
-Theta
-Vega
-Equity of the account
-Margin balance of the account
There is also a tooltip for each of the Greeks explaining what they represent. To see these tooltips hover your mouse over each one. The greeks will all update as positions are added to the portfolio.
Adding an option position to a portfolio
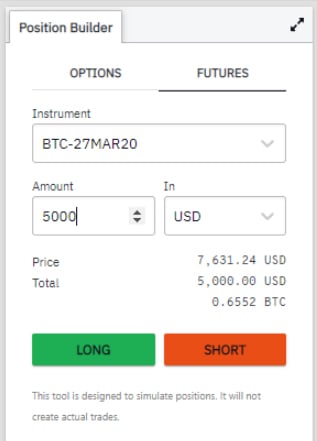
Time to add some positions to the portfolio. For now we’ll stick to Bitcoin. On the left side you will see the ‘Position Builder’ module. This can be used to select instruments to add to the current portfolio.
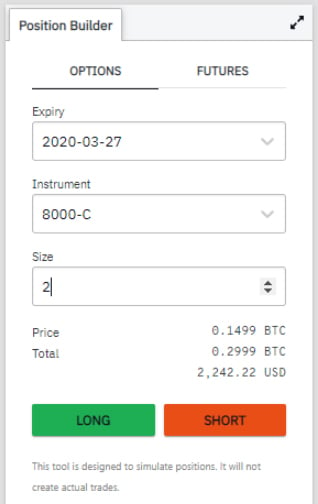
First let’s add an option position. Make sure ‘OPTIONS’ is selected and click the dropdown menu to select the expiry, then instrument, then size.
For this example we will sell 2 of the $8000 call options for the March 2020 expiry (BTC-27MAR20-8000-C) like so:
Once the ‘SHORT’ button is clicked this will add the position to the portfolio module at the bottom, and also to the Profit/Loss chart module. So you will be left with something like this:
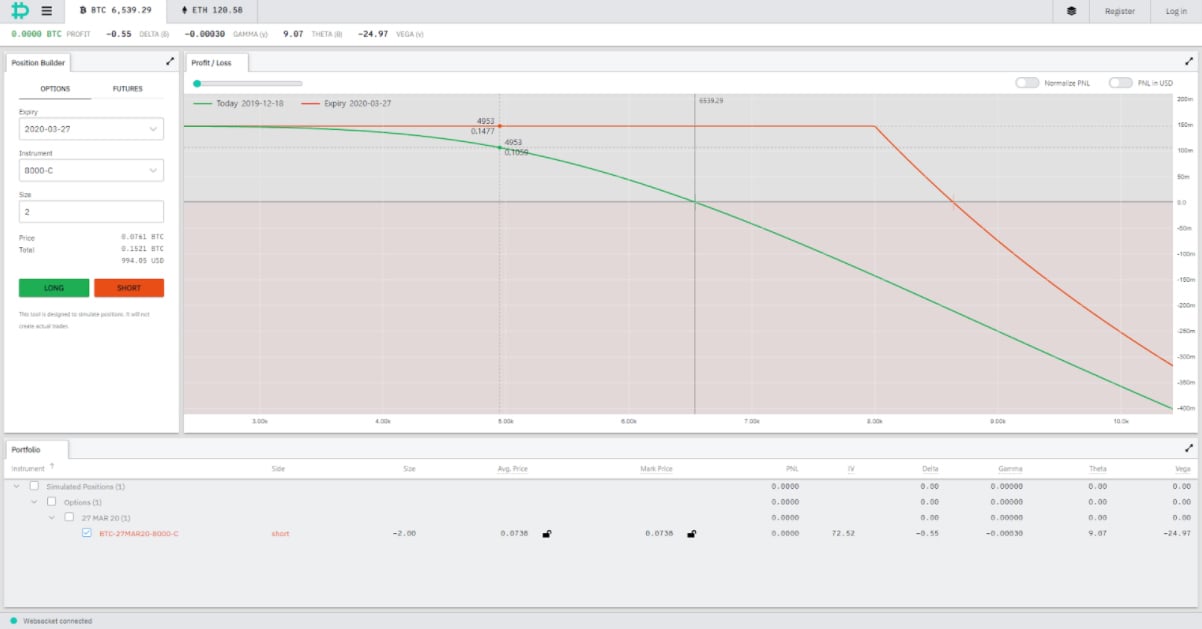
You will notice the profit/loss at expiry is plotted on the chart in red, with the inflection point of course being the chosen strike price of $8,000. The much smoother green line underneath is the profit/loss line for the option today. This line represents what the position would be worth at each underlying price point today, assuming everything else remained unchanged.
In the top left corner of the Profit/Loss chart module there is a slider. You can drag this slider along to the right to move this green line further out in time towards the expiry date. As you do so you will notice the green line gets closer and closer to the red line, until eventually they converge at expiry.
As the time to expiry decreases, there is less time for price movement and so the profit/loss line moves closer to the expiry payoff line.
Adding a futures position to a portfolio
Now let’s add a futures position to this same portfolio. In the ‘Position Builder’ module on the left, select ‘FUTURES’. As we’ve sold an option in the March expiry, let’s add a long position on the March futures like so:
Once the ‘LONG’ button is clicked this will add the position to the portfolio module at the bottom along with our existing option position. Now the Profit/Loss chart module will show data for both positions together, like so:
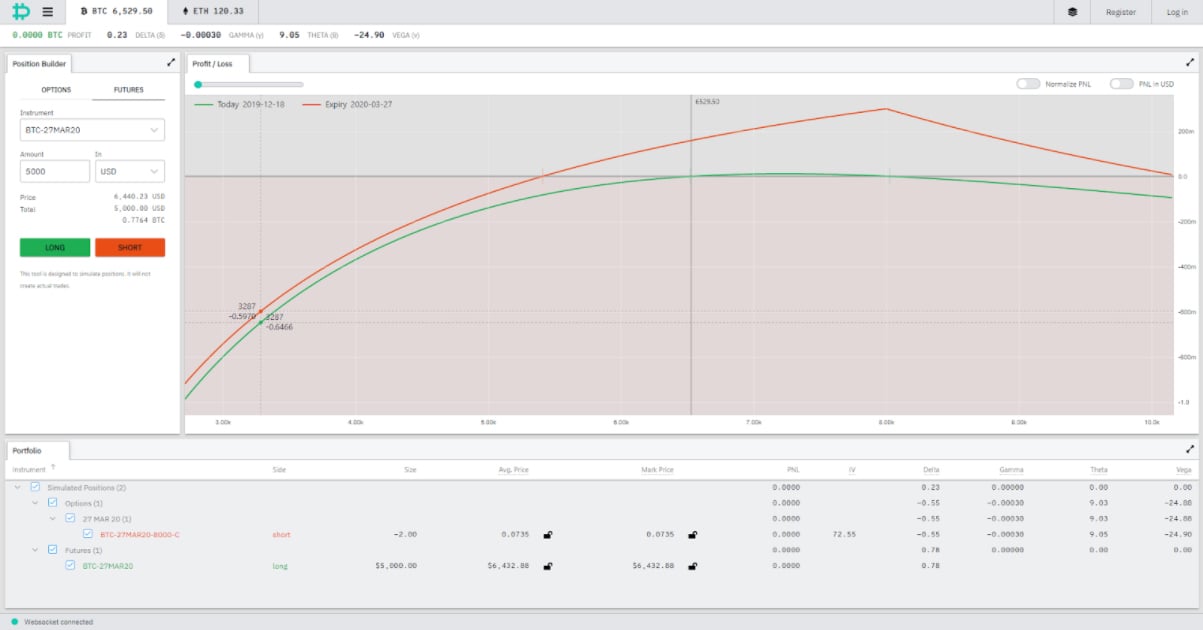
We still have both the expiry payoff and today’s profit/loss, and the slider can still be used to project the ‘today’ line out into the future towards the expiry date.
Adjusting positions directly in the positions table
It is possible to adjust the positions that have already been added, inside the table without having to delete and re-add them. The size, average price and mark price can be adjusted for all positions. For option positions the IV can also be adjusted (this will change the mark price to line up with the chosen implied volatility).
You can also change the direction by altering the size. For example, if you change the size of a $5,000 long to -$5,000, it will become a short of $5,000 instead. If you change the size of a short option position of -2 to +2, the position will be changed to a long option position.
The padlock icons next to the average price and mark prices can be used to ‘lock’ the respective settings. When left unlocked these fields will continue to pull in live values from Deribit.
The checkboxes can be used to select which positions will be included in the portfolio. These are grouped so that you can select or disable positions individually, all the futures or options positions, or the options for a certain expiry date.
Creating a new portfolio
So far everything we’ve done will be in the default portfolio, but it is possible to create and save multiple separate portfolios.
In the top right of the page click the portfolio menu icon. This will drop down a menu like so:
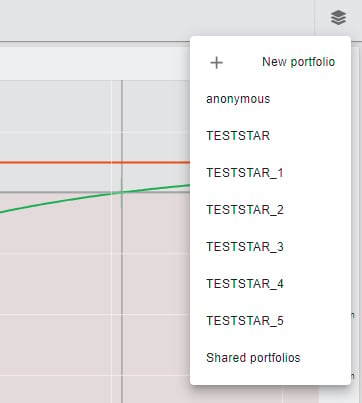
Let’s create a new portfolio named ‘Short Strangle’. Click ‘New Portfolio’ and it will open a pop up like this:
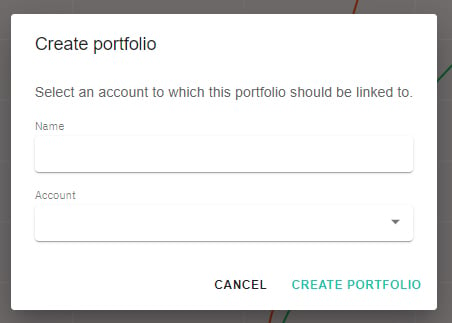
Type in the name, select one of your accounts from the drop down menu, and click ‘CREATE PORTFOLIO’ to add this new portfolio. You can view portfolios by going back to the menu in the top right and hovering over the relevant account.
As we’ve named it Short Strangle, add a short put with a strike price of 6000 and a short call with a strike price of 10000. You should have something like this:
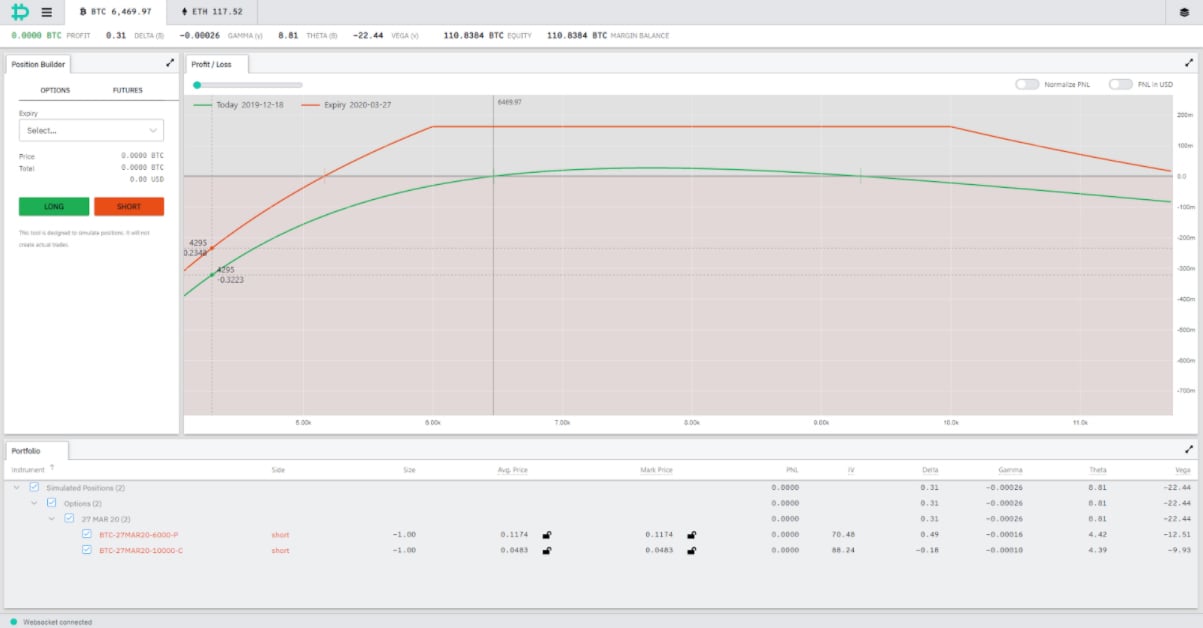
Looking good!
Adjusting the layout
This is quite a wide strangle so it barely fits on the screen currently. Thankfully there are a few things that can be done to customise the page.
In the chart module itself the mouse wheel can be used to zoom in or out. The x and y axis can also be clicked and dragged to adjust the scale. By clicking on the chart and dragging, the whole chart can be moved around so you can focus on any points of interest.
Each of the modules on the page has a fullscreen toggle in the top right allowing as much detail as possible to be on display.
The layout itself is also modular and editable. Each of the three main modules can be resized and even dragged to a new position on the page. So if you prefer something different to the default layout you are free to build whatever suits you and your screen set up best.
Simulated vs actual positions
No trading can be done through this application, however you can pull into it your real positions from the account you’ve logged in with. To do this, click the top left menu, and then click ‘Load Portfolio’.
This will pull in the real positions from your account and add them to the portfolio you are currently editing. Positions pulled from your account will also appear in the table but under a different subheading of ‘Actual Positions’ like so:
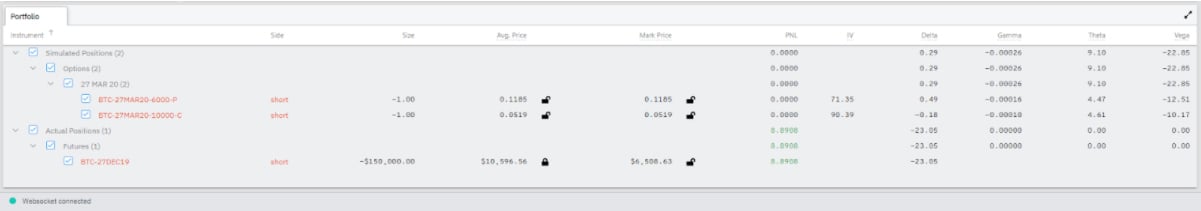
If you have ‘Realtime Updates’ toggled on in the left menu, these will update as you trade in your account. By utilising this feature you can not only see what the potential profit/loss is for your current positions, but also see what would happen if you added/subtracted different combinations of other positions.
AUTHOR(S)
Deribit Content - Spreadsheets, Options, Futures Premiums..
Deribit CM & Educator • Youtuber • Inquiries: [email protected]