Bitcoin option volume and open interest (OI) has been increasing steadily in 2019 and 2020. It is increasing in nominal terms, but also importantly it’s increasing as a percentage of the spot and futures markets. Though there is still some way to go to reach the kind of ratio that can be seen in legacy markets, bitcoin option volume and OI is becoming increasingly relevant in the cryptocurrency market. This is particularly true going into big expiration dates.
Max pain
‘Max pain’ is a calculation that shows at which strike price the lowest amount would be owed to option buyers by option sellers, if price were to expire there.
As this will change depending on the amount of open interest and which strikes this OI is sitting at, the max pain calculation will change over the life of the options in that expiry, and is most interesting leading into expiration with only a few days left.
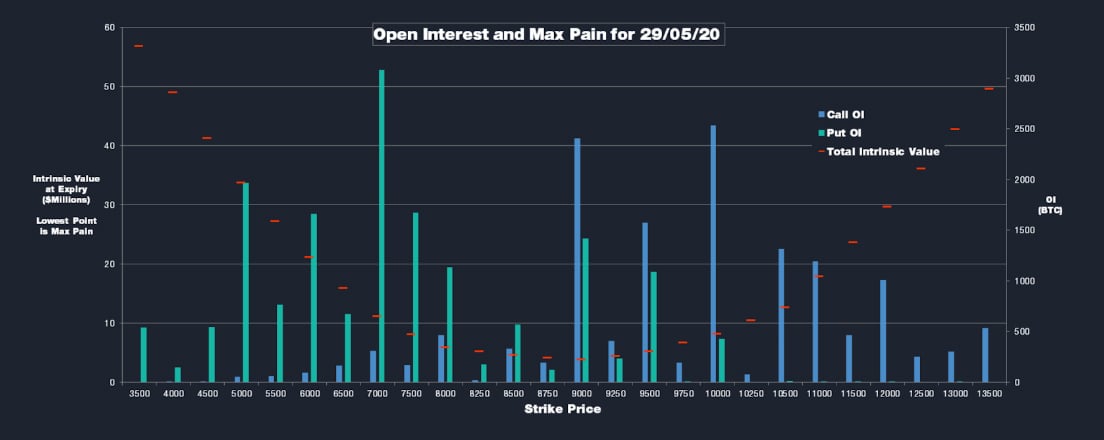
In this lesson we’ll explain how this calculation is done, what it’s showing, and provide a spreadsheet that will do the calculation for you. The spreadsheet also allows you to generate a chart to see the OI and max pain information on a chart like this:

What is open interest and why does it matter?
Open interest tells you the total size of any positions that are currently open for a given instrument, or group of instruments. It’s worth noting that open interest is not the same as volume, as it only includes positions that are still open. Any closed positions will still be included in volume figures but not included in OI figures. For the bitcoin options on Deribit, the OI is given in the number of contracts currently open.
Paying attention to the OI figures for a particular instrument, and even an entire expiration date that encompasses many instruments, can be useful because it can show how much financial interest there is in the underlying price being at a certain point at a specific time (expiration).
A quick note on delivery/settlement price on Deribit: for simplicity in this article we have talked about the price at expiration, however instruments on Deribit are actually settled on a 30 minute time weighted average price (TWAP) of the relevant Deribit index. This prevents anyone manipulating settlement prices by simply executing a trade at a certain price right at the last second.
This tends to be more relevant going into large expirations such as the quarterlies (March, June, September, December). These expirations tend to have much higher OI than the shorter expiration dates like dailies and weeklies.
With larger positions in play, there are larger financial incentives for market participants to move price towards a certain level by the time the options expire. As a simplified example, imagine a trader has sold a large amount of both puts and calls at the $10,000 strike, and that these options are expiring in less than a day. This trader will make by far the most profit from their current option position if price expires as close to $10,000 as possible. If the price is currently sitting at say $9,600, they may well be willing to invest some capital bidding the market up closer to $10,000.
What is max pain?
Max pain is a calculation that shows at what price level option holders (buyers) would as a whole suffer the maximum amount of financial pain. This is calculated based on all open interest for the given expiry date, and is not concerned with any individual trader’s specific position.
To calculate maximum pain a strike price is chosen, then for all options currently still open (at all strikes), the intrinsic value of each option is calculated as if the price had already expired at the chosen strike.
This process is repeated for every available strike price, giving a total intrinsic value of all options if price were to expire at each strike price. The strike price with the lowest intrinsic value, is max pain.
So for example let’s assume a particular expiry has only three available strikes of $8,000, $9,000, and $10,000. First we would calculate the intrinsic value of all options assuming an expiration price of $8,000. Then we calculate the intrinsic value of all options assuming an expiration price of $9,000. Then the same assuming a price of $10,000.
Whichever of these three calculations gives the lowest figure, that strike is said to be ‘max pain’ for option buyers.
Of course in the real world there will be many more strikes than this with varying levels of OI for both the puts and calls, so the calculation would be rather tedious to do by hand. Thankfully it is relatively simple to do using a spreadsheet. You can download a premade excel spreadsheet I made here.
Once you download a copy, with this spreadsheet you’ll just need to enter the expiry date and strikes, then the sheet will do the rest for you.
When is max pain useful and when is it not useful?
This calculation is typically only useful when the time to expiry is low and the open interest for the expiry date in question is relatively high. The larger the open interest, the more financial interest traders will have in where the price expires.
The lower the time to expiry, the shorter the time any entity attempting to move the price would need to keep up their efforts, and therefore the more cost effective it may be. It is unlikely for example that anyone would find the idea of attempting to pin the price to a specific strike for a full month very attractive, just because the max pain happens to currently be there.
Used by itself max pain is a limited tool, but it can be a useful piece of the puzzle when combined with more information. And it’s always useful to know where the open interest and max pain are sitting going into a big expiration, particularly if you have positions expiring then as well.
AUTHOR(S)
