
Unlike most traditional markets, bitcoin trades 24/7, including the weekends, and this also includes the bitcoin option markets on Deribit. This means that the price can move, and options can be traded, at literally any time. However, not every hour or day is equal. For example, weekends typically see less price movement on average than weekdays.
Daily price movement
The following table shows the average percentage move for each day of the week (close to close) since 2020-01-01.

Data source: Yahoo Finance.
Though this of course won’t be the case every single week, the table shows that the weekends see less movement on average than the weekdays, with the average move on Saturdays being particularly low over this period of time.
Option prices
The BTC options are usually also priced lower on weekends, but are they priced low enough to account for the considerably lower realised volatility on the weekends? And if not, are there any ways of profiting from this?
Today we’re going to use backtesting to look at how traders could have used the options on Deribit to take advantage of the lower volatility on the weekends for the last few years.
First, let’s look at how selling Sunday volatility on Friday evening has performed so far in 2024. This will give an indication of how this strategy has performed since the bitcoin spot ETFs launched. (The ETFs started trading on 11th January 2024)
Backtest details
Period: 2024-01-01 to 2024-08-31 (8 months)
Strategy: At 16:00 UTC every Friday, sell a 0.35 delta strangle that expires on Sunday at 08:00 UTC, and hold the options to expiry. Whichever options are closest to the target of 0.35 delta will be sold, up to a maximum delta difference of 0.1.
Fees: The regular Deribit fees are included (0.0003 BTC per option), as is 5% slippage on the premiums collected.
Trade size: The starting balance is assumed to be 1 BTC, and both the put and call are sold with a flat quantity of 1 each week. The trade size does not vary based on any increase/decrease in the balance.
This chart shows the PNL result of this backtest.
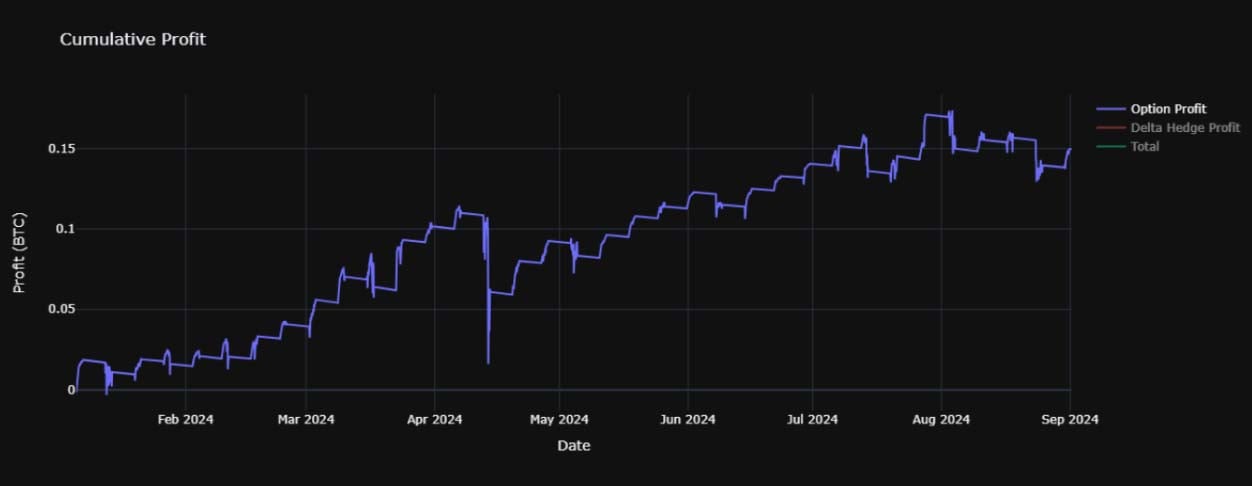
Number of trades: 35 (25 wins, 10 losses)
Net profit: 0.1395 BTC (+13.95%)
Average profit per trade: 0.004 BTC
APR: 21.3%
Maximum drawdown percentage: 8.8%
Maximum absolute drawdown: 0.1 BTC
This is quite an impressive return for such a simple trade, but it’s also quite a small sample size, especially for a negatively skewed strategy. A negatively skewed strategy is one that has infrequent losses that are larger than the more frequent small wins.
So, let’s open up the backtest period all the way back to the start of 2020. This will then include more shock events such as the covid crash and FTX collapse.
The following chart shows the PNL of the exact same strategy but with the new period of 2020-01-01 to 2024-08-31 (4 years and 8 months).
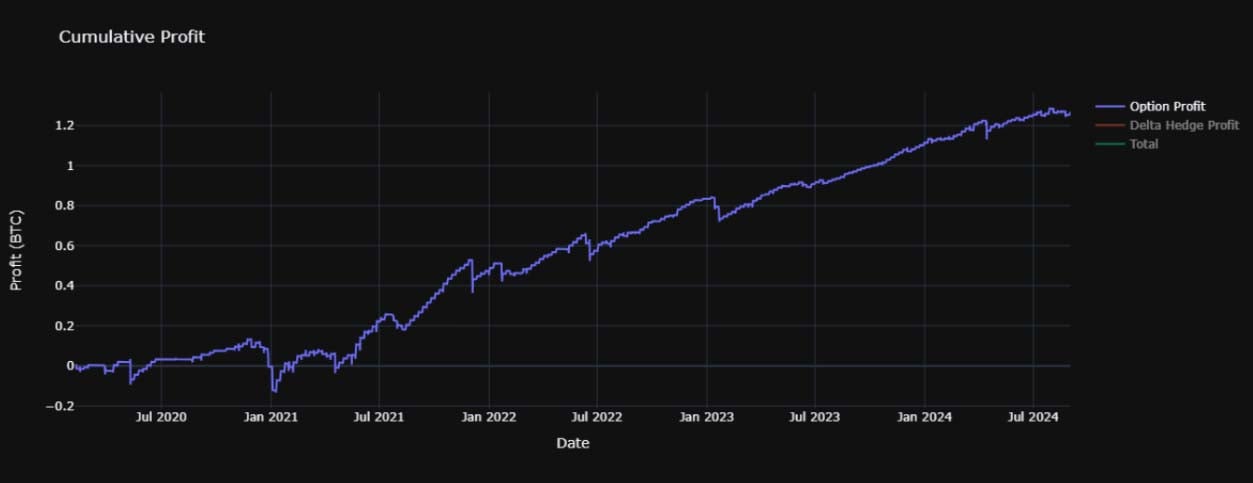
Number of trades: 212 (169 wins, 43 losses)
Net profit: 1.2485 BTC (+124.85%)
Average profit per trade: 0.0059 BTC
APR: 27.4%
Maximum drawdown percentage: 23.8%
Maximum absolute drawdown: 0.27 BTC
By looking at this longer period, the overall performance has actually improved. However, this improvement was not uniform across the full period. The strategy struggled until mid 2021, after which time the performance was strong. The maximum drawdown was also larger.
Tweaking parameters
This certainly looks promising, but let’s look at how tweaking a couple of the parameters affects the performance. This step can help to check whether what we are seeing is really the result of an underlying phenomenon, or whether it’s only this specific choice of settings that just so happens to have performed well.
The strategy that has been tested does not have many entry/exit triggers or additional filters, but we can still check how changing the delta and opening time affects the performance of the strategy. If the performance drops dramatically when these parameters are changed, it would indicate that we may have just got lucky with how the initial choice of settings performed in this set of data. This would mean the backtest would not be convincing evidence that the good performance is likely to continue in future.
The following table shows the APR for different deltas, and different opening times. The APR is calculated as the total percentage return divided by the number of years in the backtest period.
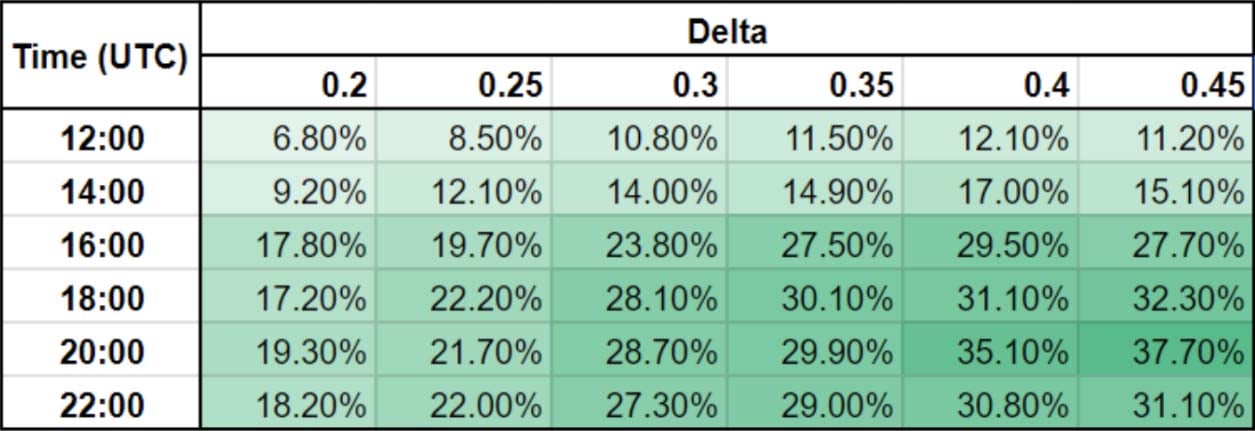
As can be seen, the strategy does still make a profit even when the target delta and opening time are changed. This suggests there is some robustness to the idea of selling Sunday volatility on Friday afternoon/evening, regardless of the exact opening time or delta.
Notice also that the profitability is clearly lower for the two earlier opening times of 12:00 and 14:00 UTC. One possible cause for this is that the US markets do not open until either 13:30 or 14:30 UTC depending on the time of year (this varies due to daylight savings time). This means that no matter what time of year it is, by 16:00 UTC, US markets are open, and any initial moves triggered by that have already happened.
It is also clear that once the delta is reduced to 0.25 and 0.2, the profit is lower. The lower the delta, the further away from the current price the options are and therefore the less likely it is that one of them expires ITM (in the money). However, a lower credit is also collected. This table of results would seem to suggest then that when selling the higher delta options, the extra credit received more than compensates for the greater likelihood of one of the options expiring ITM, leading to a greater total profit.
Drawdowns
The following table shows the largest drawdown in BTC for each backtest. I have chosen to use the largest BTC drawdown rather than the percentage drawdown because flat position sizes have been used in the backtest.
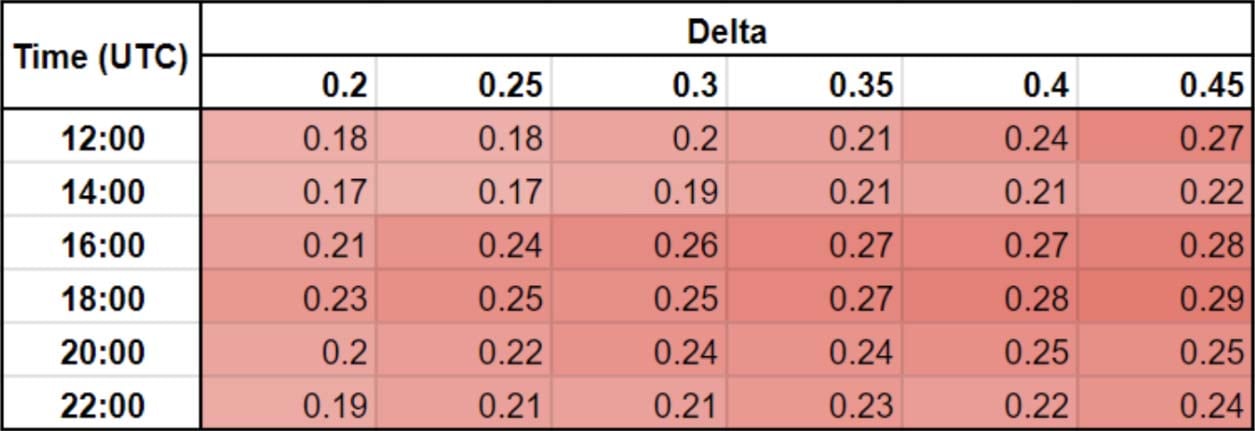
A value of 0.18 in this table represents a drawdown of 0.18 BTC. As we’ve assumed a starting balance of 1 BTC, these values can also be read as a percentage of the starting balance, for example 0.18 is 18% of the starting balance.
Note that the largest drawdowns displayed here are likely to be a slight underestimate due to only using hourly data for the backtests.
Calmar Ratios
If we divide the annual return (APR) by the largest drawdown, we get a Calmar ratio for each backtest. These Calmar ratios are displayed in the following table.
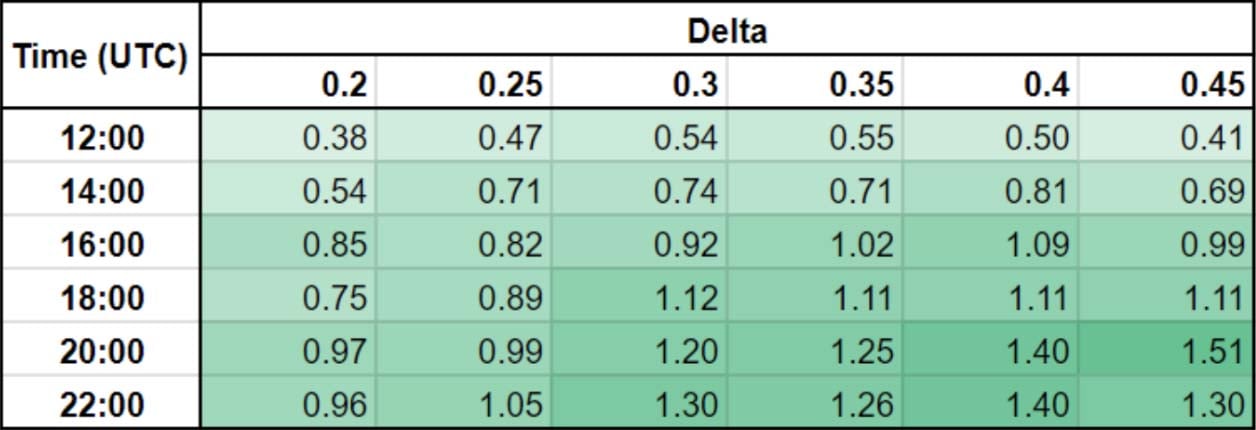
By considering the Calmar ratio as well, rather than just the total return, we can better judge whether the returns of a strategy represent more value being captured, or whether they are simply compensation for taking more risk. A higher Calmar ratio indicates a better risk adjusted return. Any value over 1 indicates that the average annual return was greater than the largest drawdown over the period.
The highest returns were achieved for the higher deltas, and for opening times after the US markets are open. The higher Calmar ratios in the bottom right portion of the table show these higher returns are not simply a result of taking more risk. The returns were also better on a risk adjusted basis.
How useful is backtesting?
Backtesting provides a way to use historical data to confirm whether a trade idea would have worked in the past or not, which can hopefully provide some insight into whether it is likely to work in the future.
I will be making several more posts based on backtests in the coming months, but as I’ve started with a particularly profitable one, it’s worth detailing now some common pitfalls of backtesting.
This is a non-exhaustive list of possible issues
- Past performance is no guarantee of future performance. Even if we find a strategy that had genuine edge during the backtest period, markets evolve, and the effectiveness of a strategy could be reduced or even turn negative. This could happen slowly over time as more traders participate in the same trade, or suddenly in reaction to a specific event.
- Overfitting. This is the process of over optimising a strategy’s performance in the backtest, to the point where the strategy parameters are fit to the noise of the sample rather than any genuine signal there may be. This is likely to result in the future performance of the strategy being considerably worse than the backtest performance. Even if additional overfitting to the data has been avoided, the strategy is still being tested against the one path that the price happened to take over the backtest period, but this isn’t the only path it could have taken, and is unlikely to be exactly the same as the path it takes in future.
- Maximum drawdown underestimate. I have used hourly data to perform these backtests, which means any big dips in equity that were recovered before the next hourly datapoint will not be visible. Therefore the maximum drawdown of the backtest is likely to be an underestimate of what would truly have been experienced. Even if we accurately measure the drawdown during the backtest period, this is unlikely to be the largest possible drawdown.
- Extreme market events not seen before. The period looked at today includes the covid crash, the collapse of Luna, and the collapse of FTX, however this does not mean an even more extreme event could not happen in future.
- Sample size. The sample size on the first backtest was 35 trades. Even when we extended the backtest period to over 4 years, the number of trades taken was 212. This is certainly better, but is still not a large sample size, particularly for a negatively skewed strategy.
- Look-ahead bias. This is when data that couldn’t have been known at the time is used in the backtest. I don’t believe the individual backtests themselves contain any look-ahead bias, however, did you notice that the initial idea to look at selling weekend volatility came from looking at the average daily move over the same period as the backtest? This is not information that would have been available at the start of the period. (There was a similar pattern of lower weekend volatility in the previous four years as well, but it was much less pronounced.)
Despite these possible issues, backtesting remains a useful tool for checking the viability of possible trading strategies. I’ll cover more backtests in future pieces, and I’ll also introduce the idea of hedging the strategies, either via dynamic delta hedging, or by combining the primary option strategy with some other options.
Historical option data
I recorded over 6 months of Deribit BTC option data in my own database and made it available for free here. The parquet file linked to in the tweet contains hourly snapshots of all BTC options on Deribit from 2024-01-13 to 2024-07-27. This is an ideal dataset to use for some initial coding and testing work.
If you would like to purchase some more comprehensive historical option quote data to perform your own backtesting, this is available via a number of Deribit’s data partners, such as Tardis and Kaiko. You can find links to Deribit data partners on this page.
AUTHOR(S)
