
Weekly recap of the crypto derivatives markets by BlockScholes.
Key Insights:
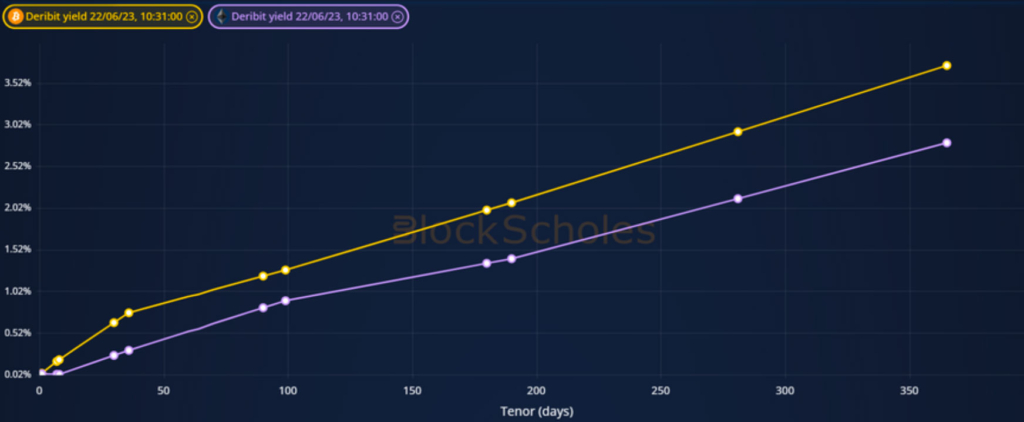
Signs of the entry of traditional finance institutions to the crypto-space have lifted the pessimistic sentiment that has clouded BTC and ETH derivatives over the past few months. However, despite both BTC and ETH spot prices sharing in the rally, the former’s derivatives markets have priced for nearly 5% higher implied volatility across the term structure. In addition, we do not see the same steepness in ETH’s future’s term structure, nor do we see the same high funding rate paid by long positions.
Futures implied yield term structure.
Volatility Surface Metrics.


*All data in tables recorded at a 10:03 UTC snapshot unless otherwise stated.
Futures

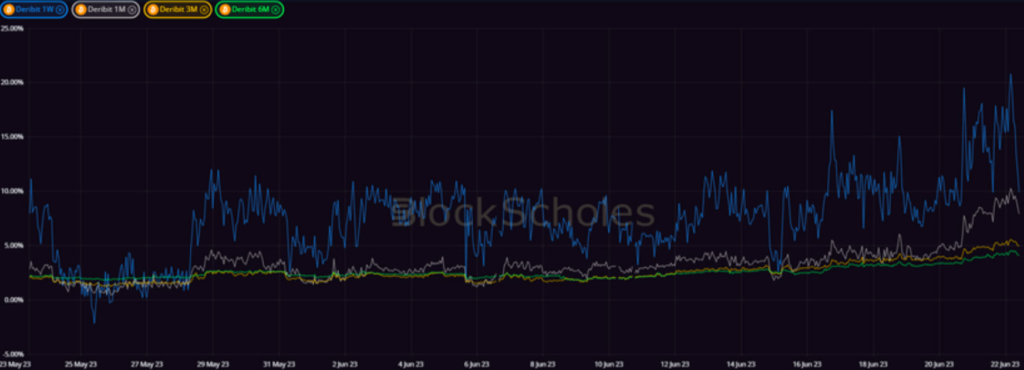
BTC ANNUALISED YIELDS – show that short tenor futures’ prices have drifted upwards of 15% at annualised rates.
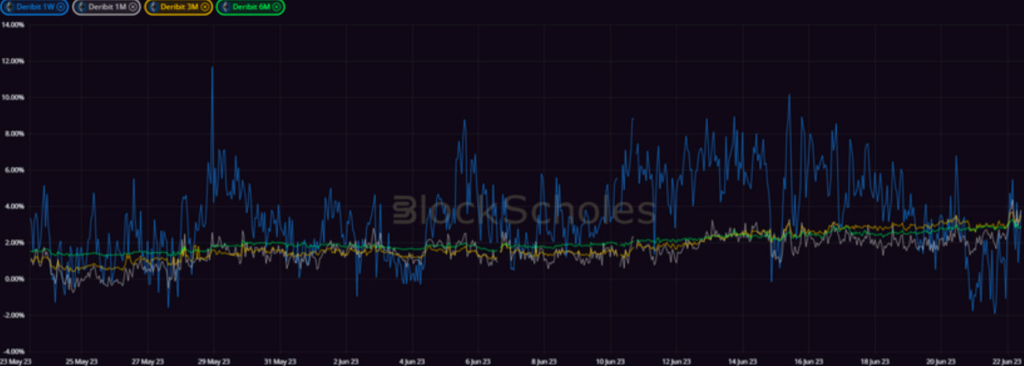
ETH ANNUALISED YIELDS – remain much lower than BTC’s during the bullish rally in the spot prices of both assets.
Perpetual Swap Funding Rate
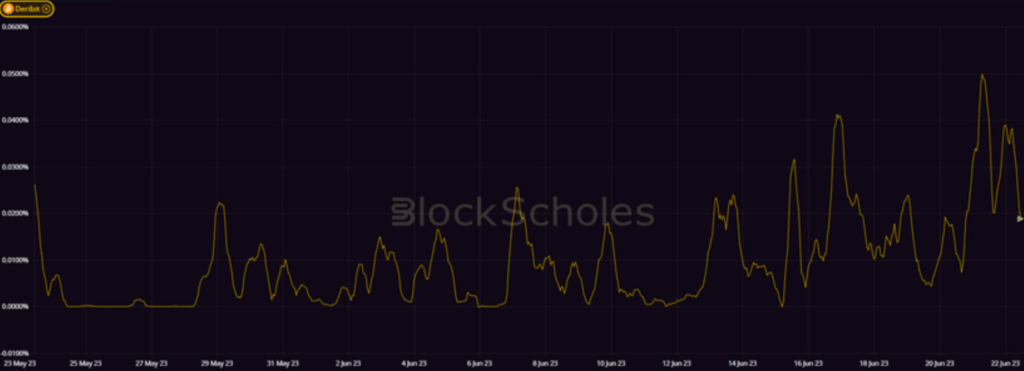
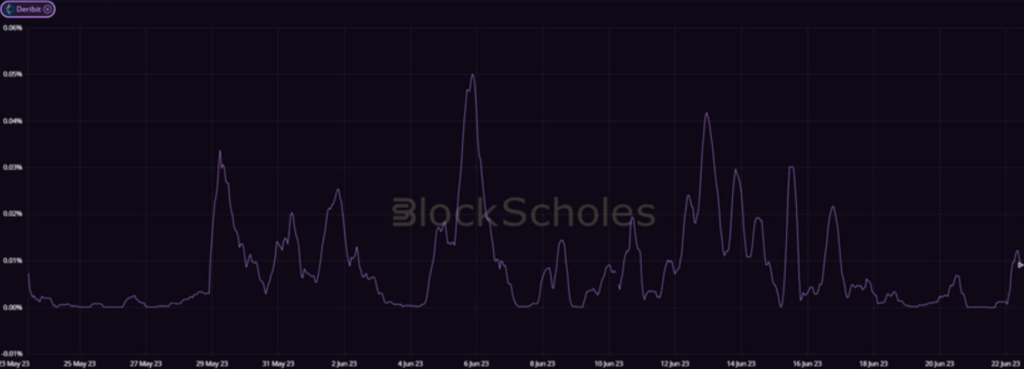
BTC FUNDING RATE – have recently priced long exposure through the perpetual swap contract at the highest levels in the last month.
ETH FUNDING RATE – does not express the same outsized demand for spot exposure through ETH’s perpetual swap contract.
BTC Options

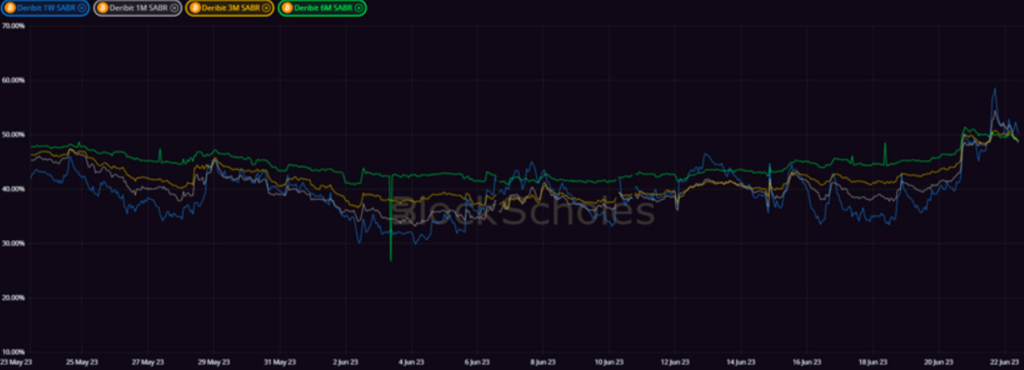
BTC SABR ATM IMPLIED VOLATILITY – has risen to its highest levels in the last 30 days before settling near to 50% at all tenors.
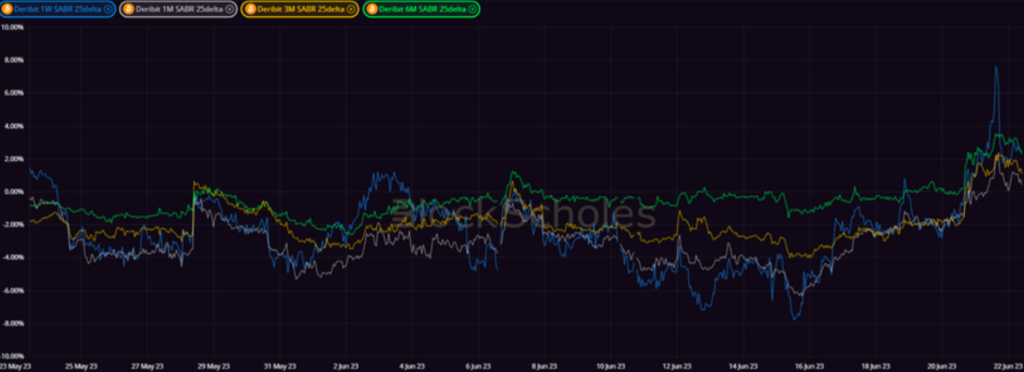
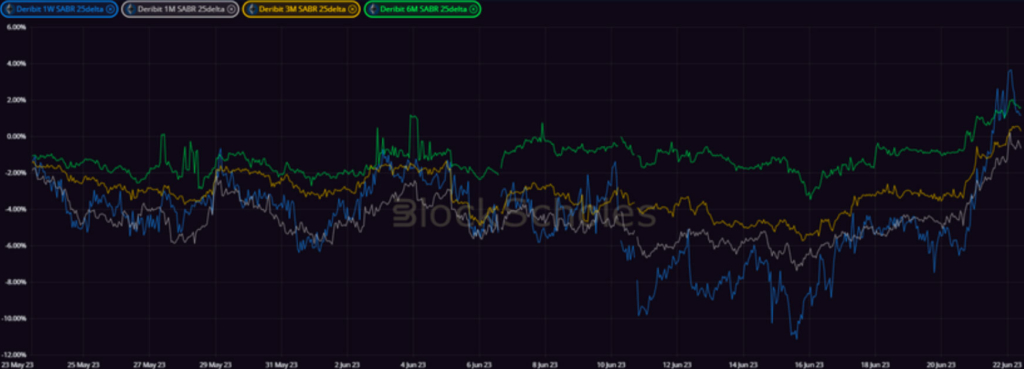
BTC 25-Delta Risk Reversal – bullish spot price action has lifted sentiment as expressed by the relative pricing of the IV of OTM puts and calls.
ETH Options

ETH SABR ATM IMPLIED VOLATILITY – has risen alongside BTC’s, but remains nearly 5 vol points lower across the terms structure.
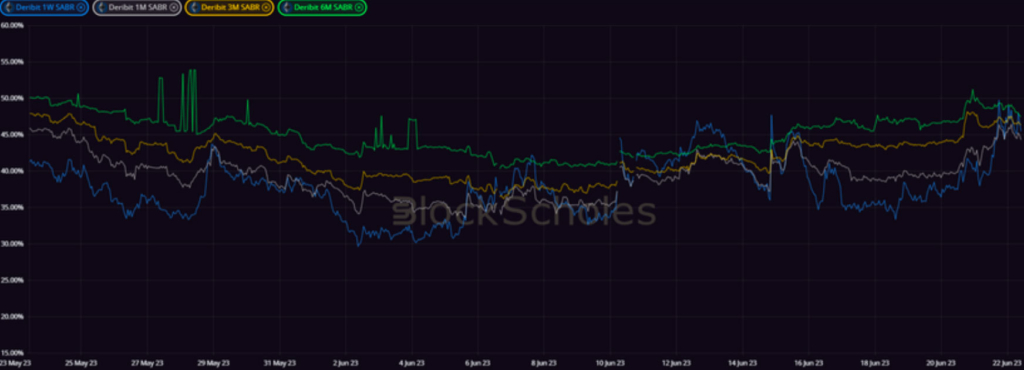
ETH 25-Delta Risk Reversal – prices up- and down-side protection at similar levels in the middle of the term structure, with a slightly higher impied vol of OTM calls at 1W and 6M tenors.
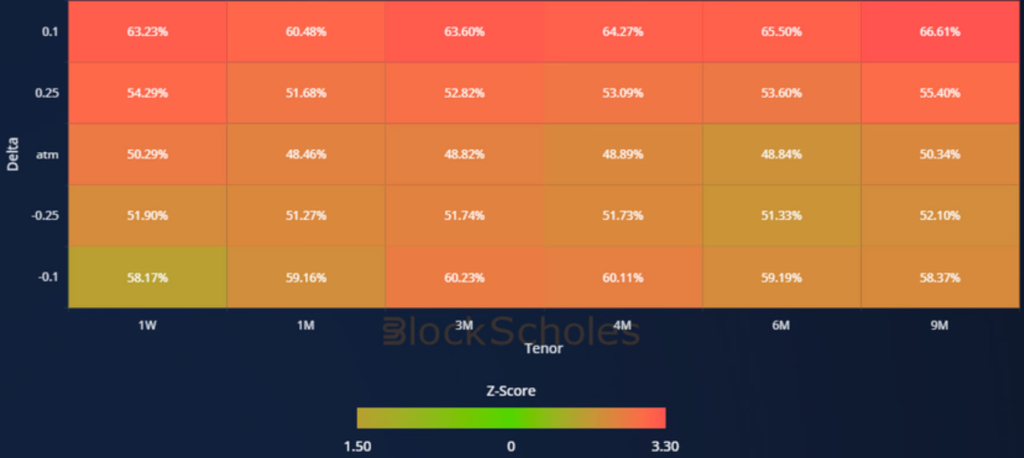
Volatility Surface
BTC IMPLIED VOL SURFACE – showcases the strong performance in implied volatility across the tenor and strike domains in the last month.
ETH IMPLIED VOL SURFACE – whilst also showing an increase, highlights the smaller rally in implied vol across ETH’s options market.
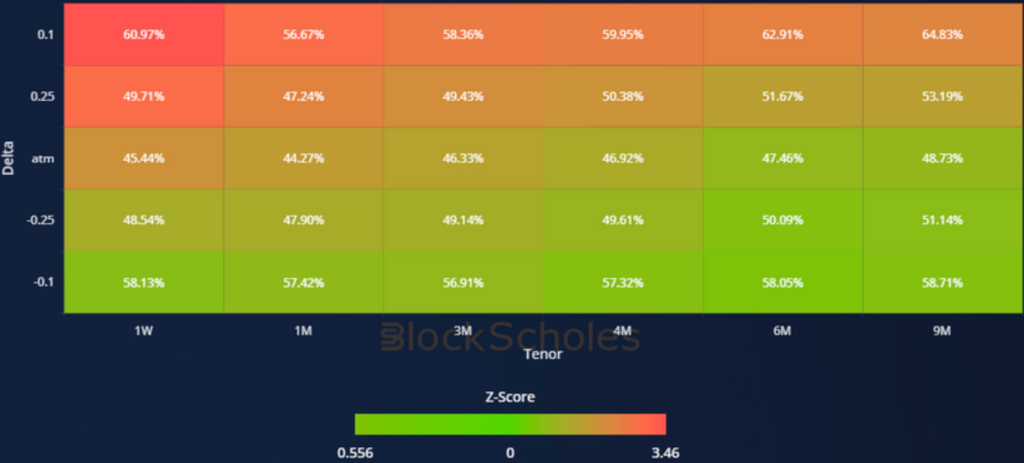
Z-Score calculated with respect to the distribution of implied volatility of an option at a given delta and tenor over the previous 30-days of hourly data, timestamp 10:00 UTC, SABR smile calibration.
Volatility Smiles
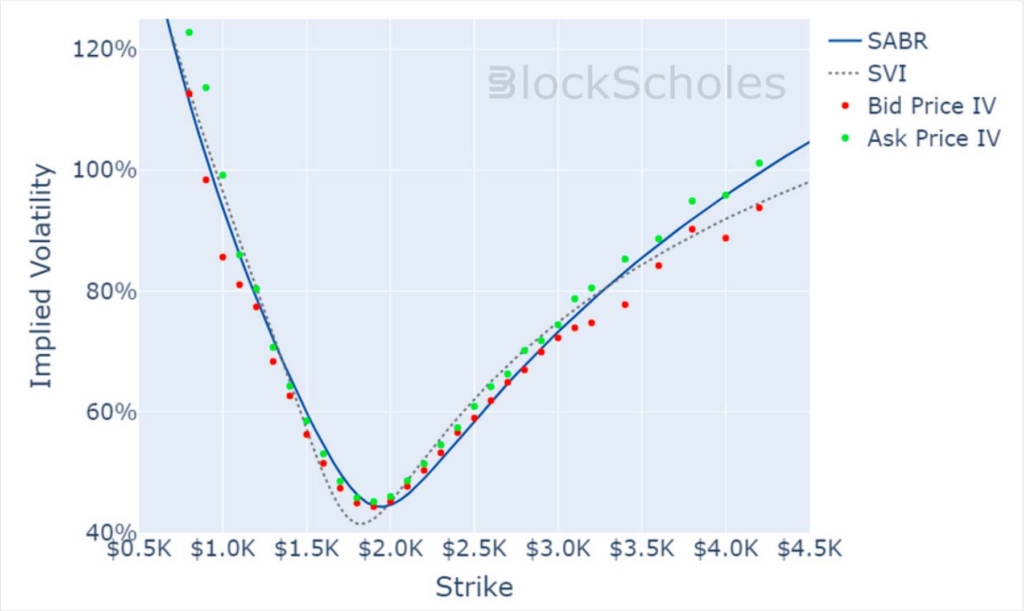
BTC SMILE CALIBRATIONS – 30-Jun-2023 Expiry, 10:00 UTC Snapshot.
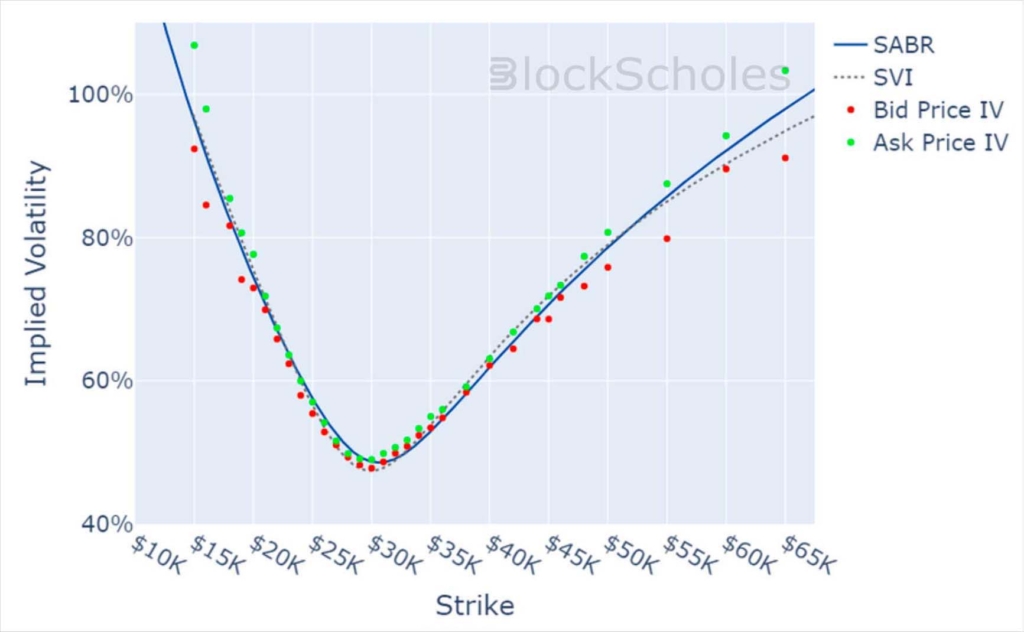
ETH SMILE CALIBRATIONS – 30-Jun-2023 Expiry, 10:00 UTC Snapshot.
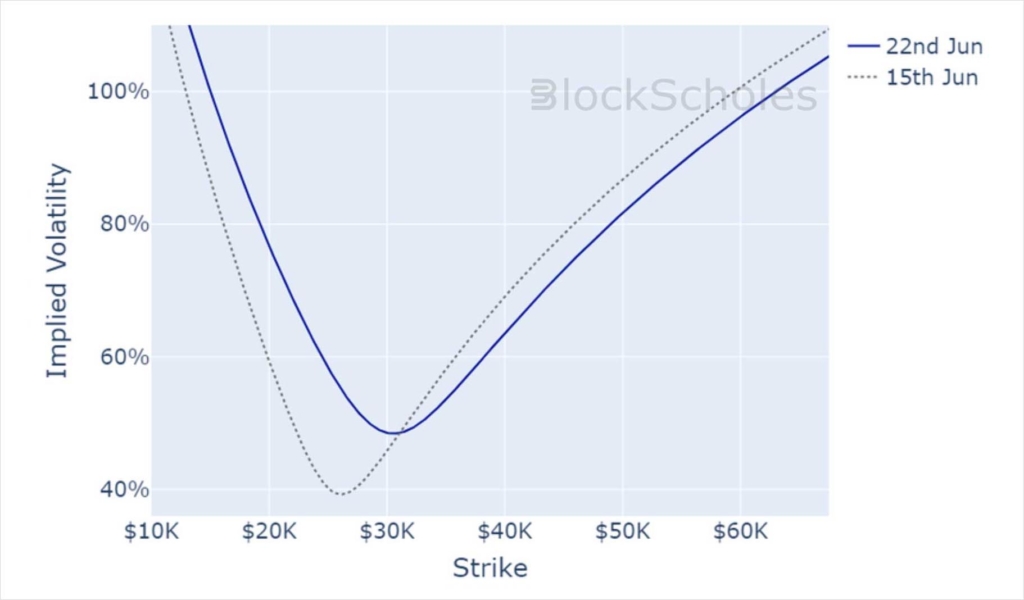
Historical SABR Volatility Smiles
BTC SABR CALIBRATION – 30 Day Tenor, 10:00 UTC Snapshot.
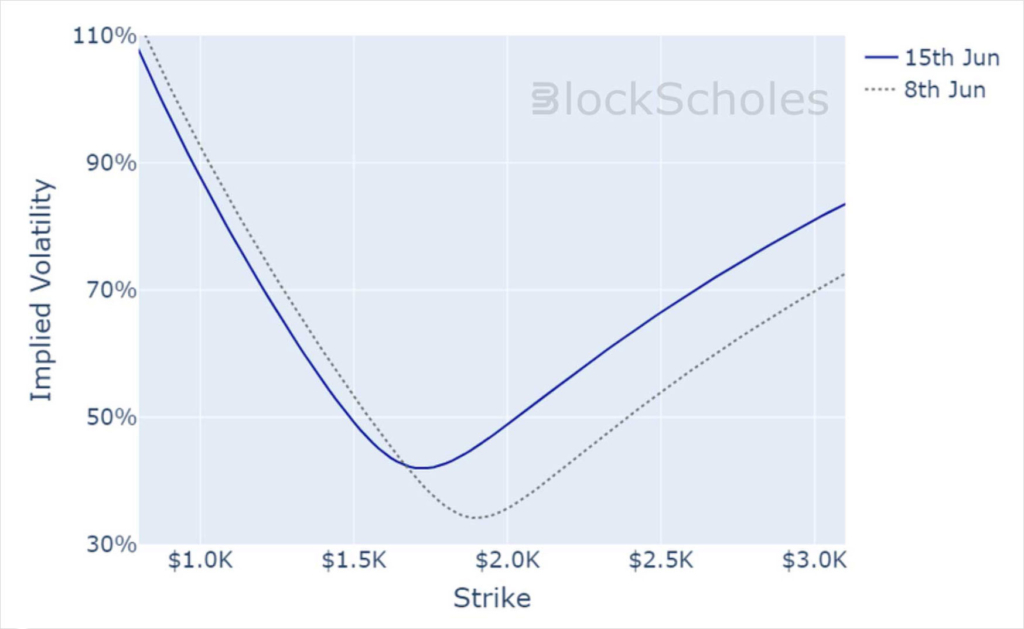
ETH SABR CALIBRATION – 30 Day Tenor, 10:00 UTC Snapshot.
AUTHOR(S)
