

Weekly recap of the crypto derivatives markets by BlockScholes.
Key Insights:
Spot prices have largely regained the levels they lost in the selloff early in the week. So too has the shape of the at-the-money implied volatility term structure, regaining the noticeable kink that targets the end- of-Jan expiry. Perpetual swap funding rates showed little sign of slowing during the selloff despite talks of a spate of liquidations, indicating that traders are still willing to pay for leveraged long exposure. The only metrics not to return to pre-selloff conditions are both assets’ put-skew. The trending skew towards OTM puts began before the selloff, and has settled close to neutral levels across both term structures.
Futures Implied Yield, 1-Month Tenor
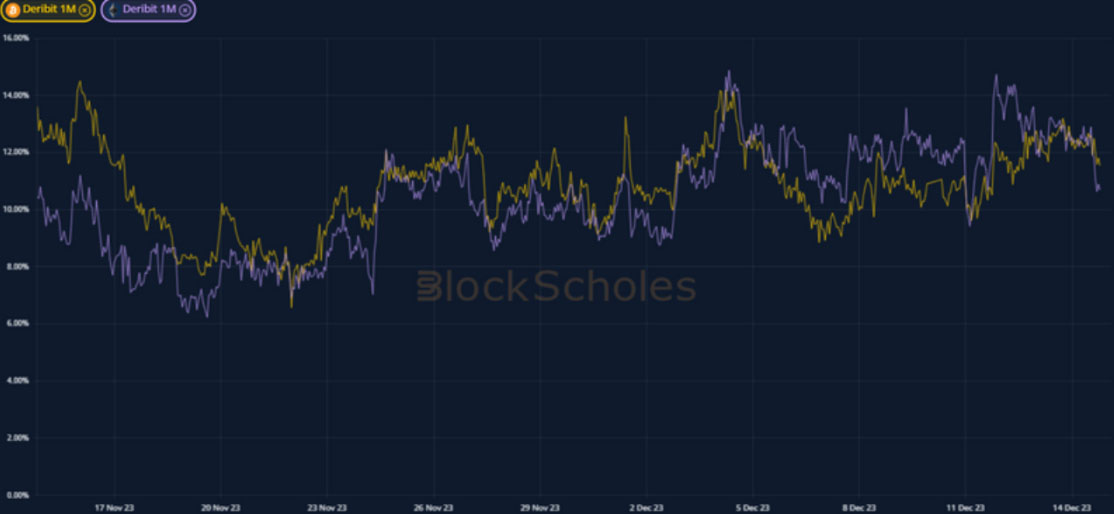
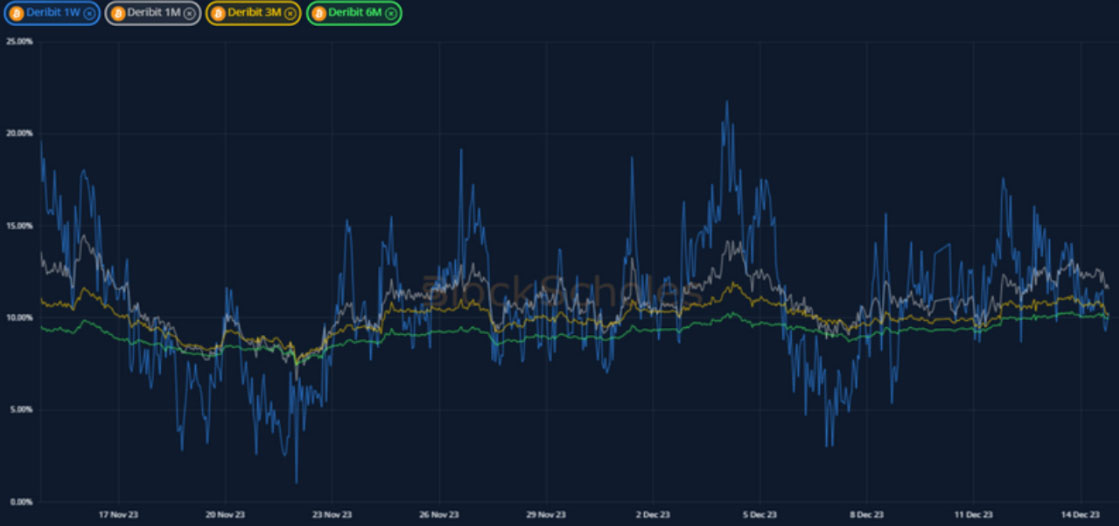
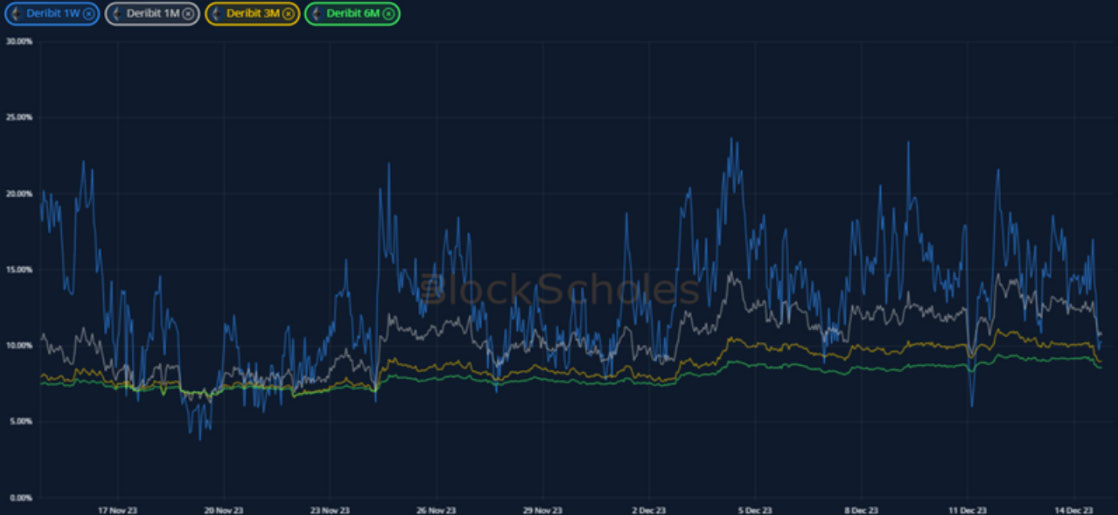
ATM Implied Volatility, 1-Month Tenor
*All data in tables recorded at a 10:00 UTC snapshot unless otherwise stated.
Futures
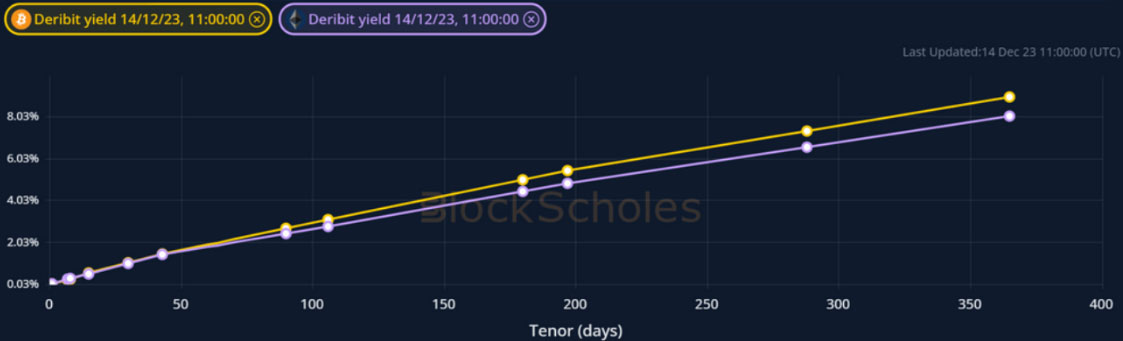
BTC ANNUALISED YIELDS – stick close to 10% across the term structure, having risen at short-tenors over the course of the past week.
ETH ANNUALISED YIELDS – did not see the same fall as BTC’s, but do also trade in a tight range close to 10% across the term structure.
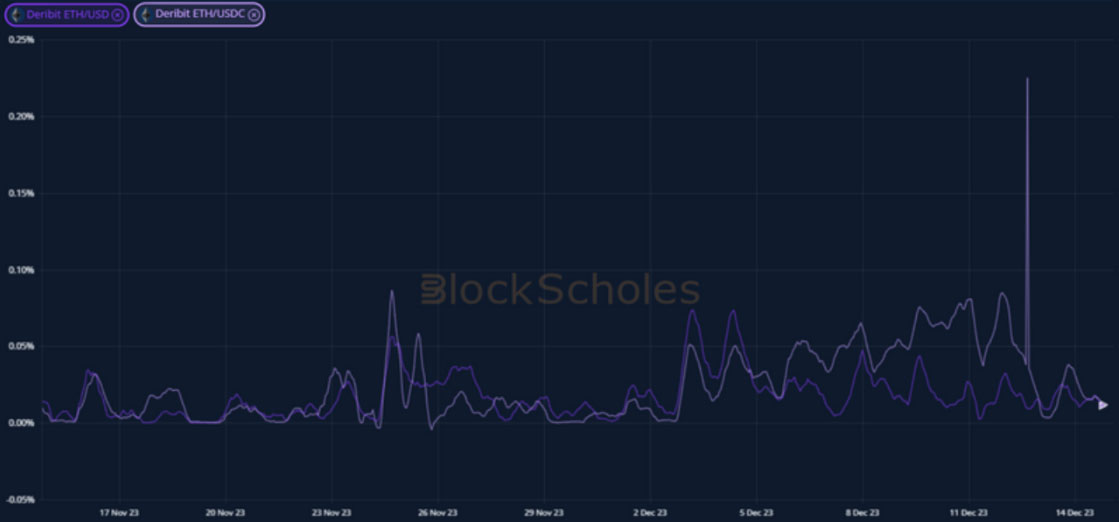
Perpetual Swap Funding Rate
BTC FUNDING RATE – has been persistently high throughout the past week, despite the retrace in spot prices towards $40K.
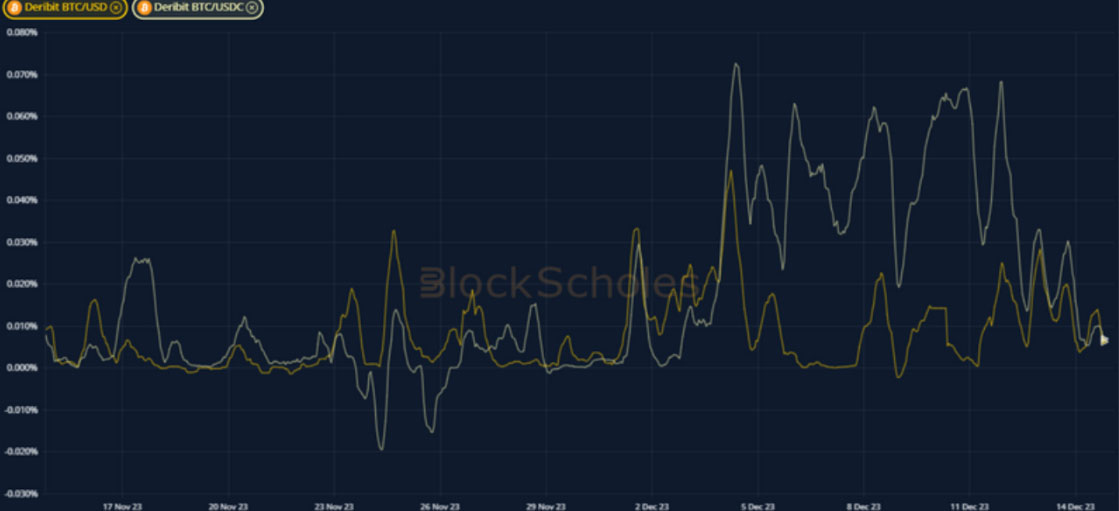
ETH FUNDING RATE – has been persistently positive throughout the week at similarly high levels to BTC’s.
BTC Options
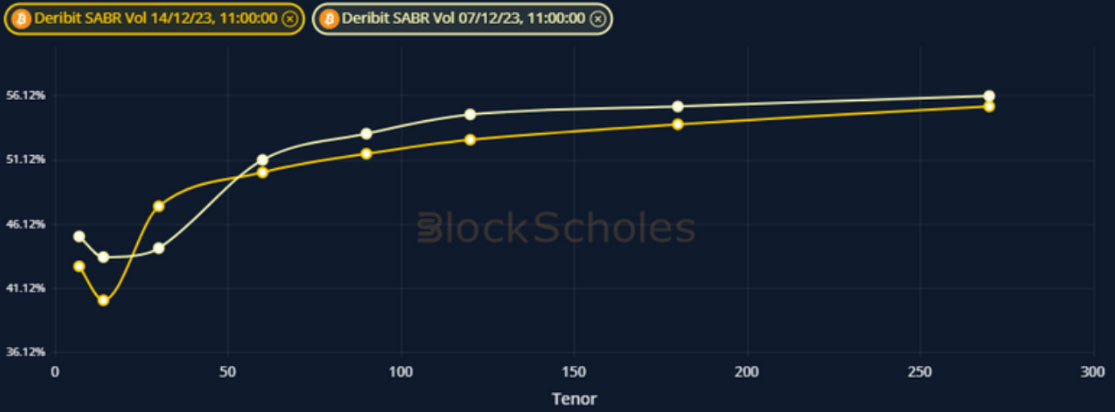
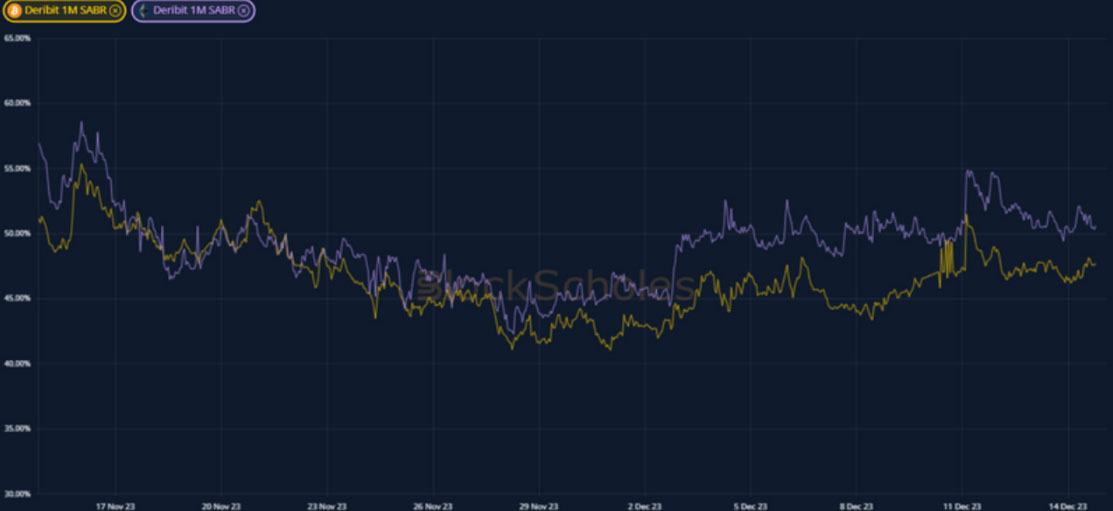
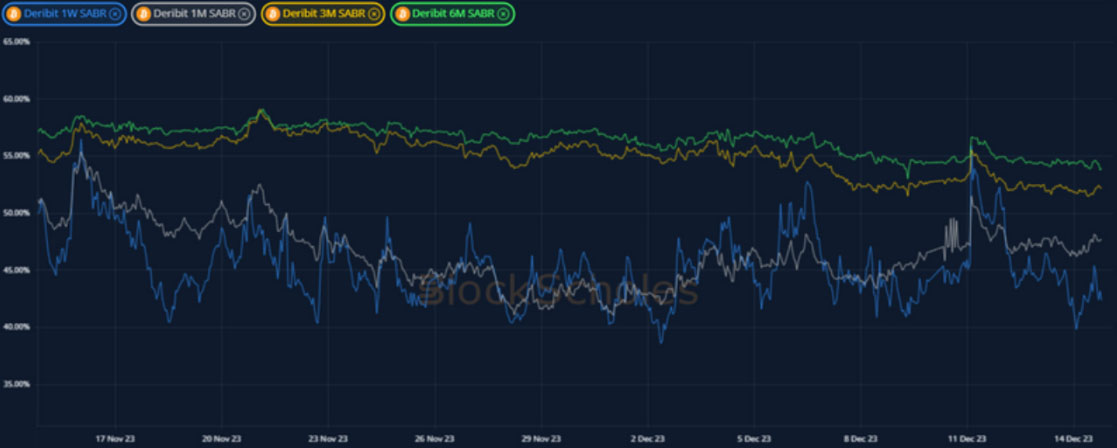
BTC SABR ATM IMPLIED VOLATILITY – the spot selloff saw an increase in short term vol, but the term structure has regained its January kink.
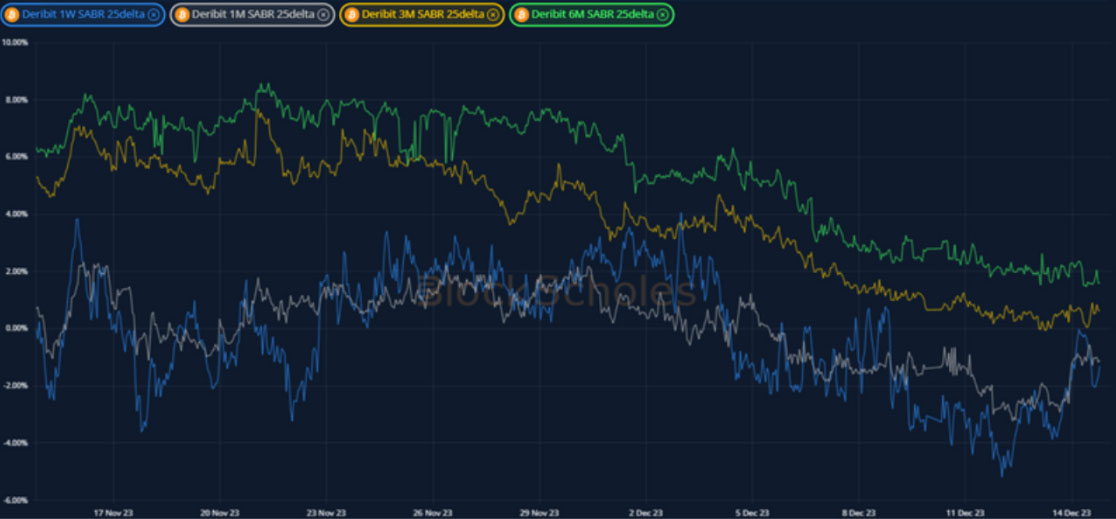
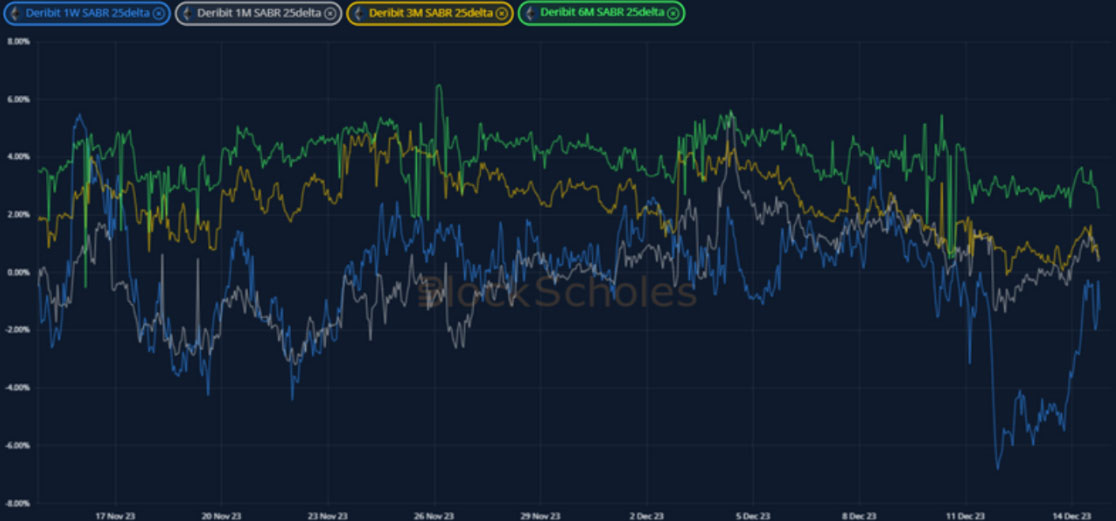
BTC 25-Delta Risk Reversal – the trending skew towards OTM puts seems to have stablised as smiles at all tenors reflect a more neutral sentiment.
ETH Options
ETH SABR ATM IMPLIED VOLATILITY – shows a similarly kinked term structure near to the end-of-January expiry as does BTC’s.
ETH 25-Delta Risk Reversal – a dislocation that took the 1 week skew away from other tenors appears to have resolved in the last 24 hours.
Volatility Surface
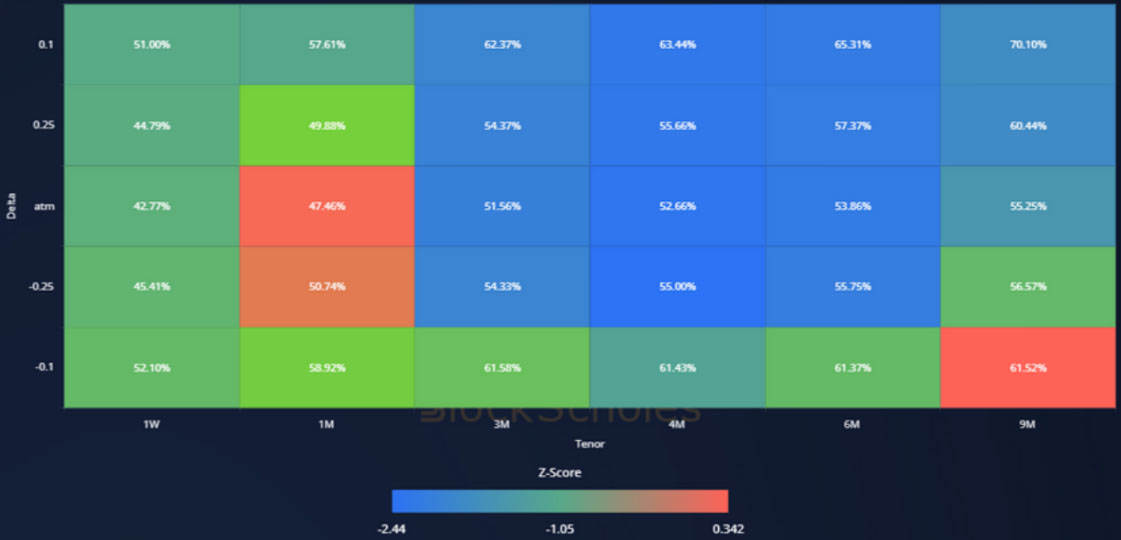
BTC IMPLIED VOL SURFACE – shows a cooling in tenors of 3-months or longer, with most of the action focused at the 1-month ATM strike.
ETH IMPLIED VOL SURFACE – shows less of a clear picture than BTC’s surface, with the implied vol of 1M OTM calls rising fastest across the surface.
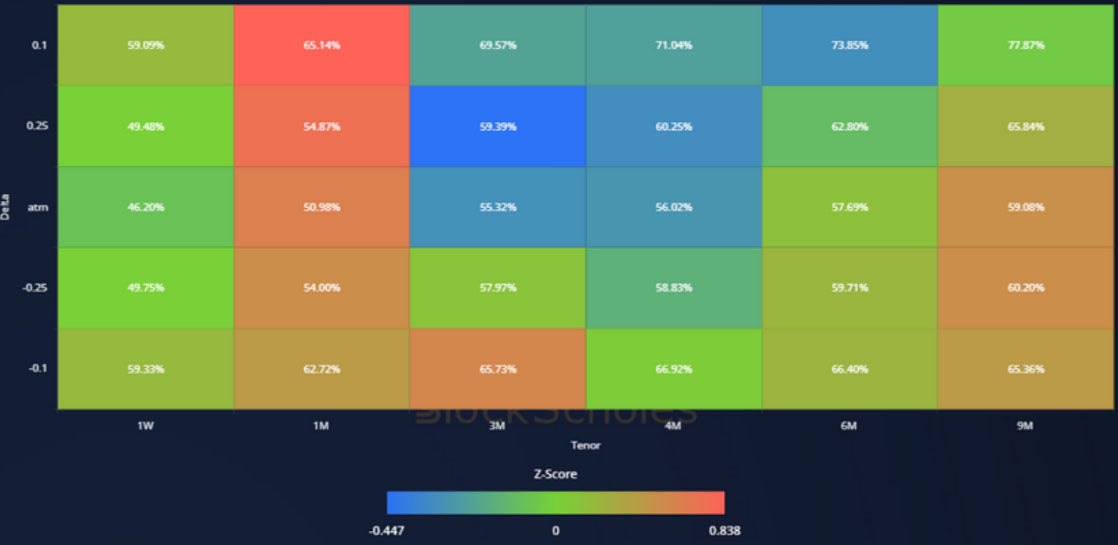
Z-Score calculated with respect to the distribution of implied volatility of an option at a given delta and tenor over the previous 30-days of hourly data, timestamp 10:00 UTC, SABR smile calibration.
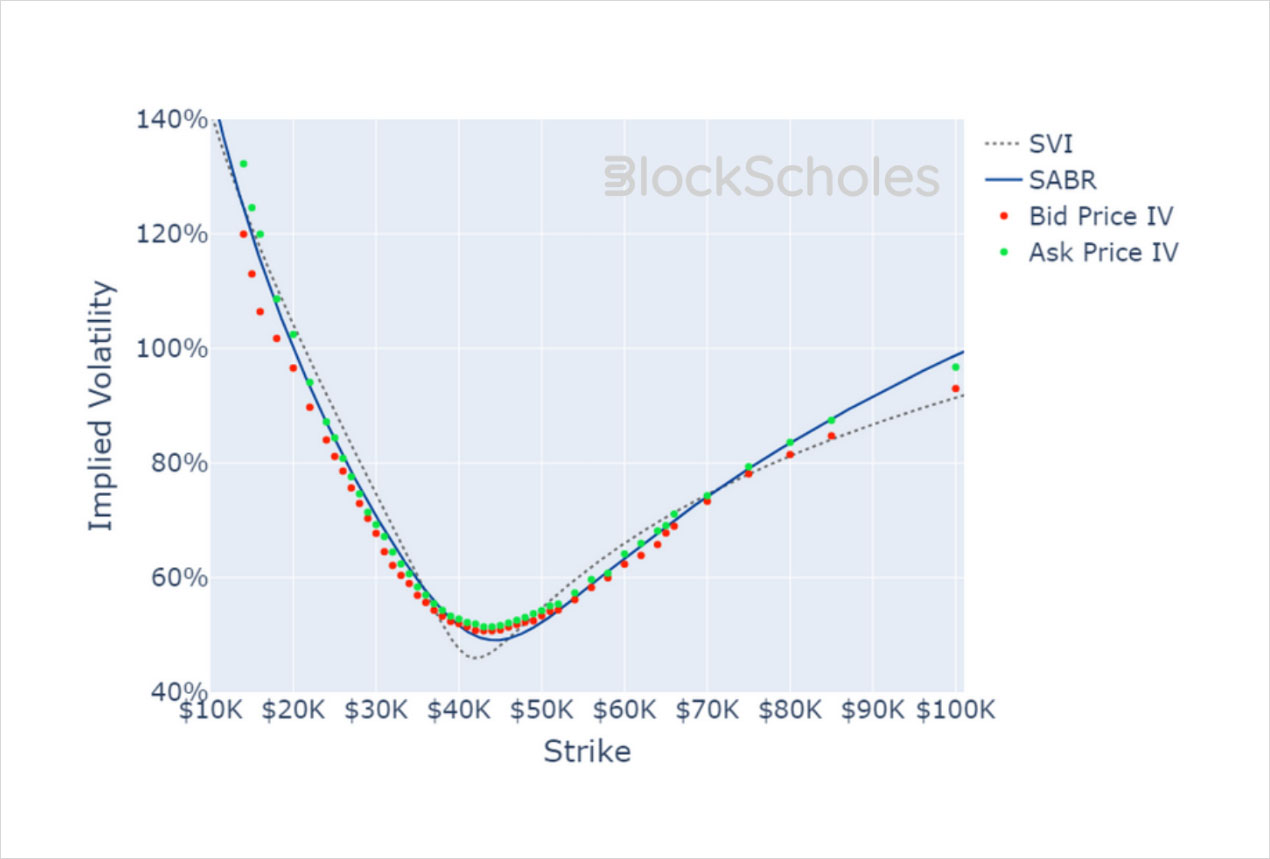
Volatility Smiles
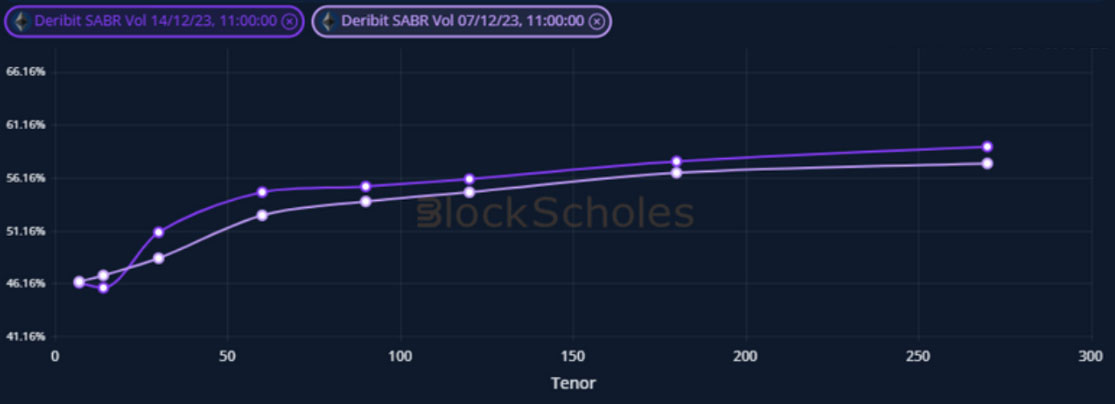
BTC SMILE CALIBRATIONS – 26-Jan-2024 Expiry, 11:00 UTC Snapshot.
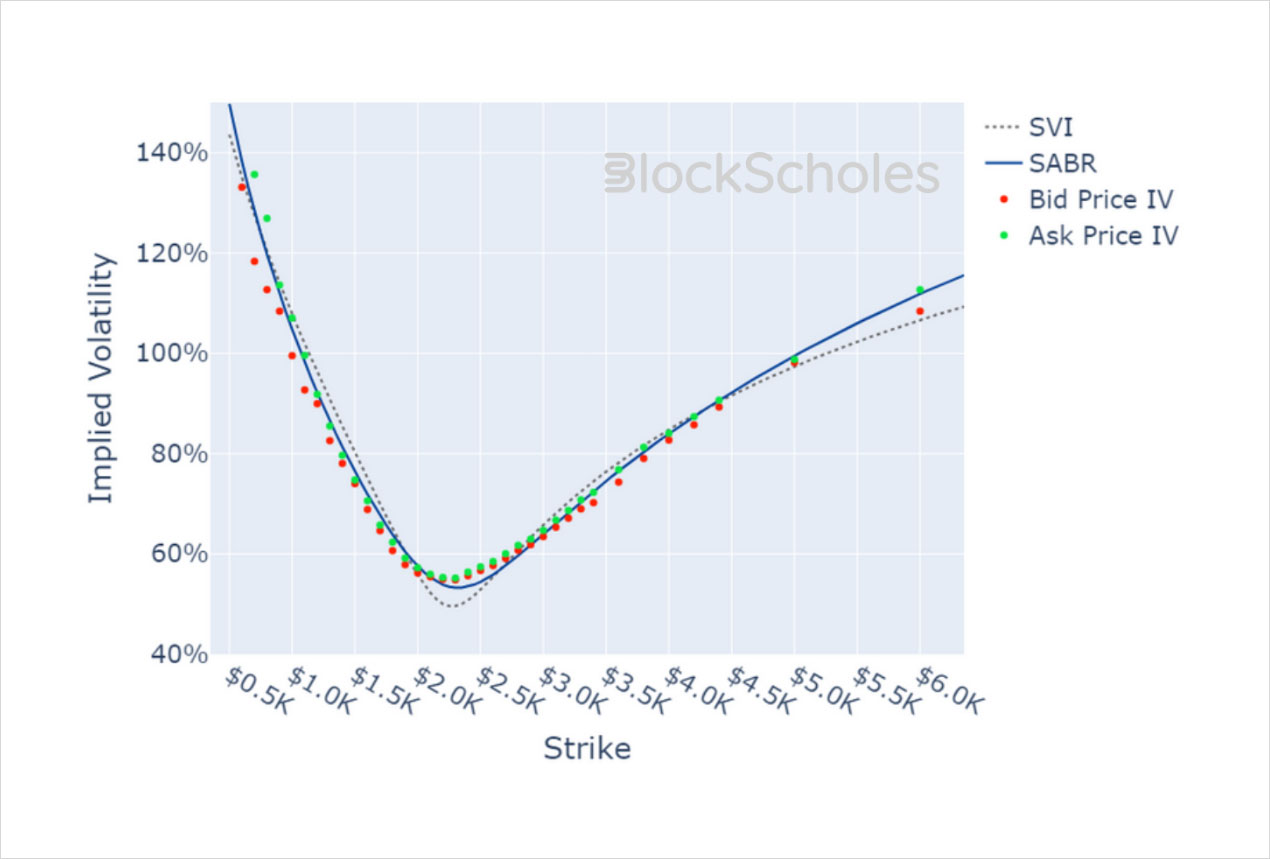
ETH SMILE CALIBRATIONS – 26-Jan-2024 Expiry, 11:00 UTC Snapshot.
Historical SABR Volatility Smiles
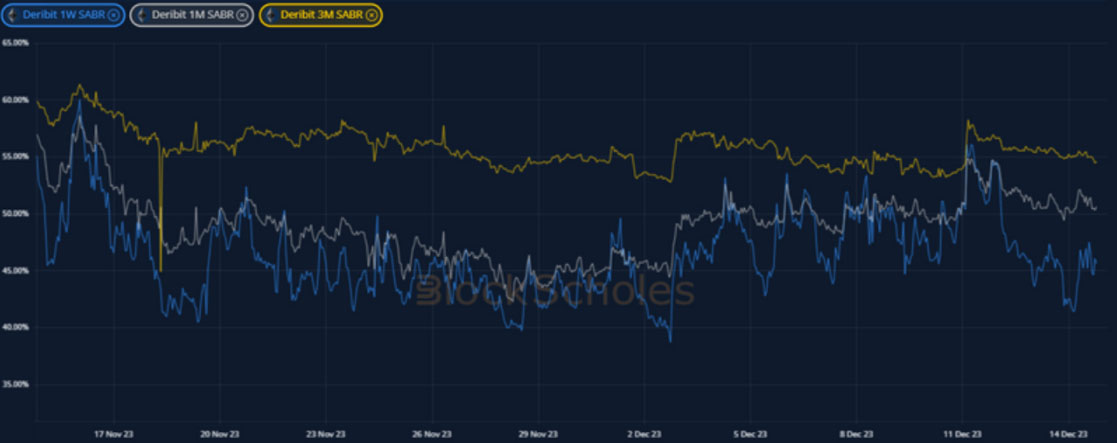
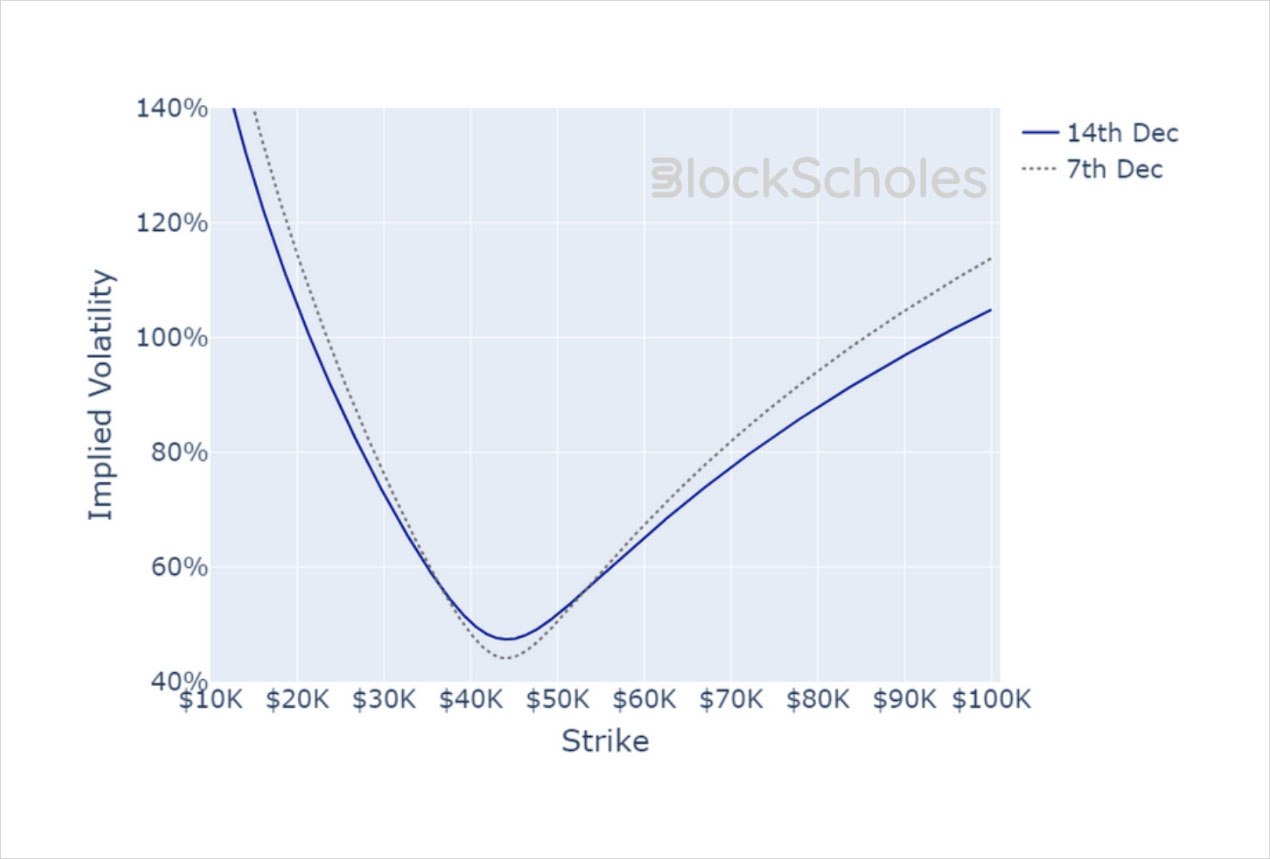
BTC SABR CALIBRATION – 30 Day Tenor, 10:00 UTC Snapshot.
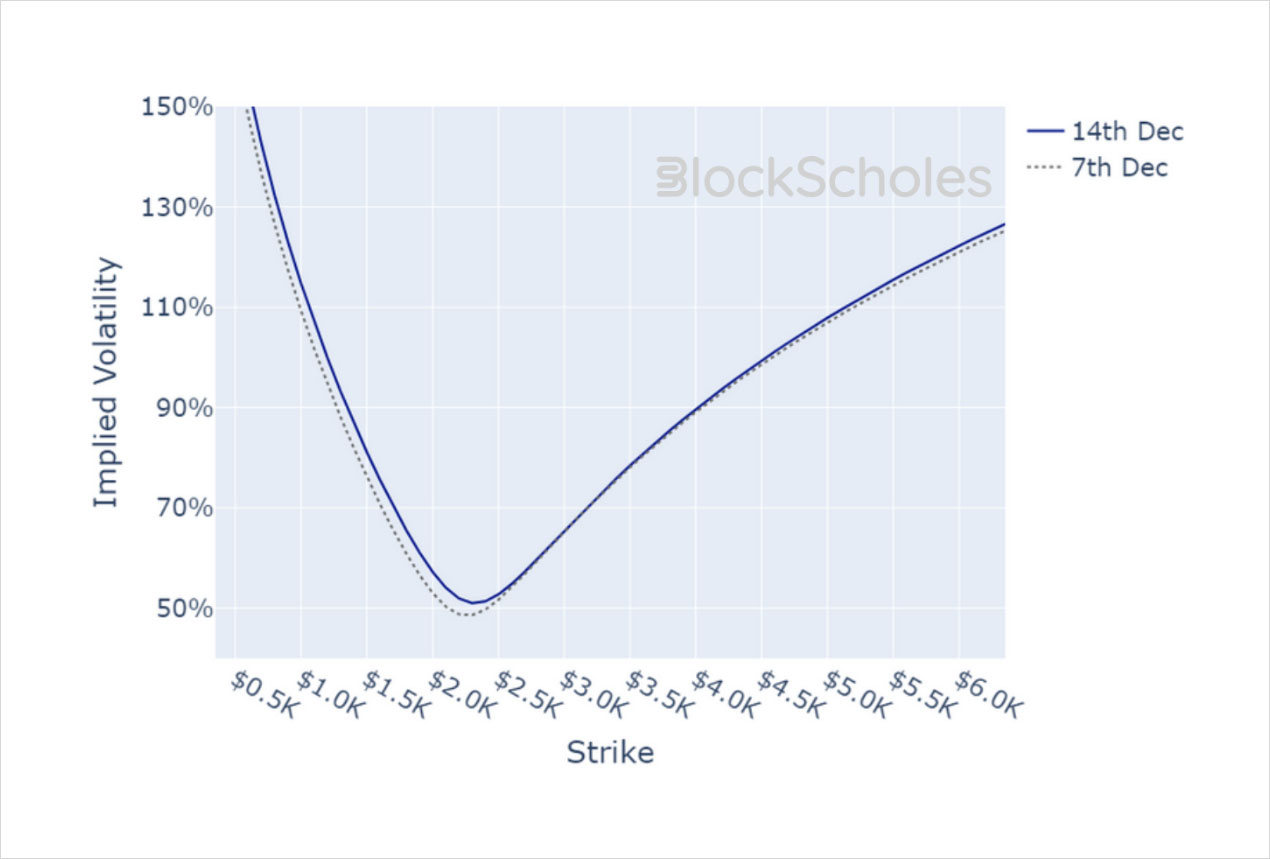
ETH SABR CALIBRATION – 30 Day Tenor, 10:00 UTC Snapshot.
AUTHOR(S)
Trading with a competitive edge. Providing robust quantitative modelling and pricing engines across crypto derivatives and risk metrics.