
In this quarterly report from Amberdata you will find the recent Crypto volatility trends and all major events in Q2 2023.
Table of Contents:
> Forward
> Introduction
> Spot
> Spot/Vol Dynamics
> Risk-Reversal Skew
> Beta and Realized Volatility
> Implied Volatility
> Gamma Profile: Decoding Options Flow
> DVOL
Forward
Crypto volatility trading has remained concentrated to flows being executed on Deribit, a few smaller CeFi exchanges and a handful of OTC desks.
Despite the fragmentation between various venues (not to mention a growing opportunity within on-chain DeFi options), analyzing the trade volumes that flow through Deribit has provided our customers with actionable insights that represent a vast percentage of total option activity. Crypto volatility trading is still in its infancy and many of the “traditional” flows we’re used to seeing in equities and other markets have only begun to be replicated in the crypto volatility landscape.
The Amberdata team, including Tony Stewart and Euan Sinclair, have developed proprietary tools to tag trade direction of aggressors. This has enabled us to glean subtle information found within option volumes and positioning.
We look forward to sharing our insights found using the tools currently available to Amberdata customers.
Interactive Version, click here.
Introduction
YTD we’ve seen interesting trends in crypto volatility, ranging from a reversal of the 2022 spot/vol dynamics, compressed relative volatility between BTC & ETH, and finally, massive flows that have created divergent gamma profiles between these two assets.
As BTC became a sought-after crypto earlier this year, especially in response to the SVB banking crisis, we’ve seen a strong positive spot/vol dynamic for the asset. Fundamentally speaking, many view BTC as more of a pure-play on monetary policy, while ETH is often viewed as a crypto “tech-play”.
In September of 2022, ETH moved to PoS, enabling holders to stake ETH for yield. Furthermore, as a result of the April 2023 Shanghai upgrade, the ability to “unstake” one’s ETH finally became available. This has attracted a lot more staking flows and created a lucrative opportunity for ETH holders to enhance their yield by also selling “covered calls” against their staked ETH holdings.
Beacon Chain Deposits
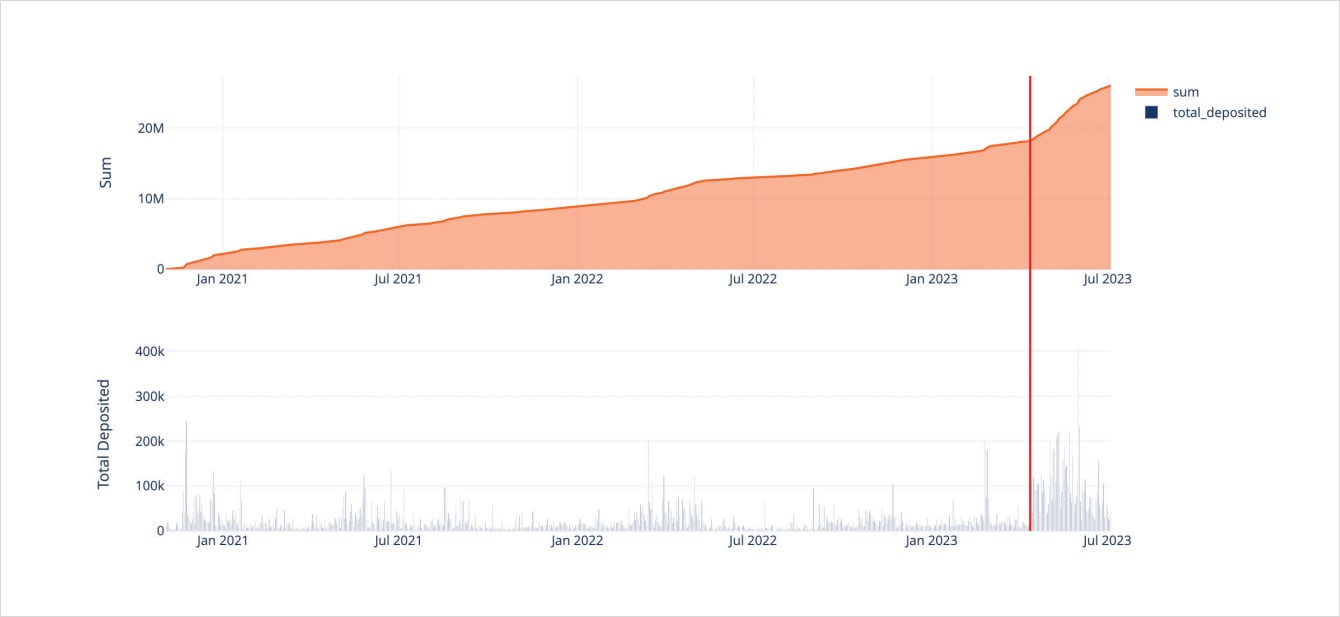
This dynamic of selling covered calls against long ETH holdings has the potential to shift spot/vol dynamics – to a certain extent – as new buyers of spot ETH become simultaneous sellers of volatility.
Finally, on the tradable product front, Deribit launched cash settled futures for their DVOL index. DVOL index values first began to be published in March 2021. In April 2023 DVOL futures were launched.
We wrap up our report with an exposé around DVOL index metrics and data.
Spot
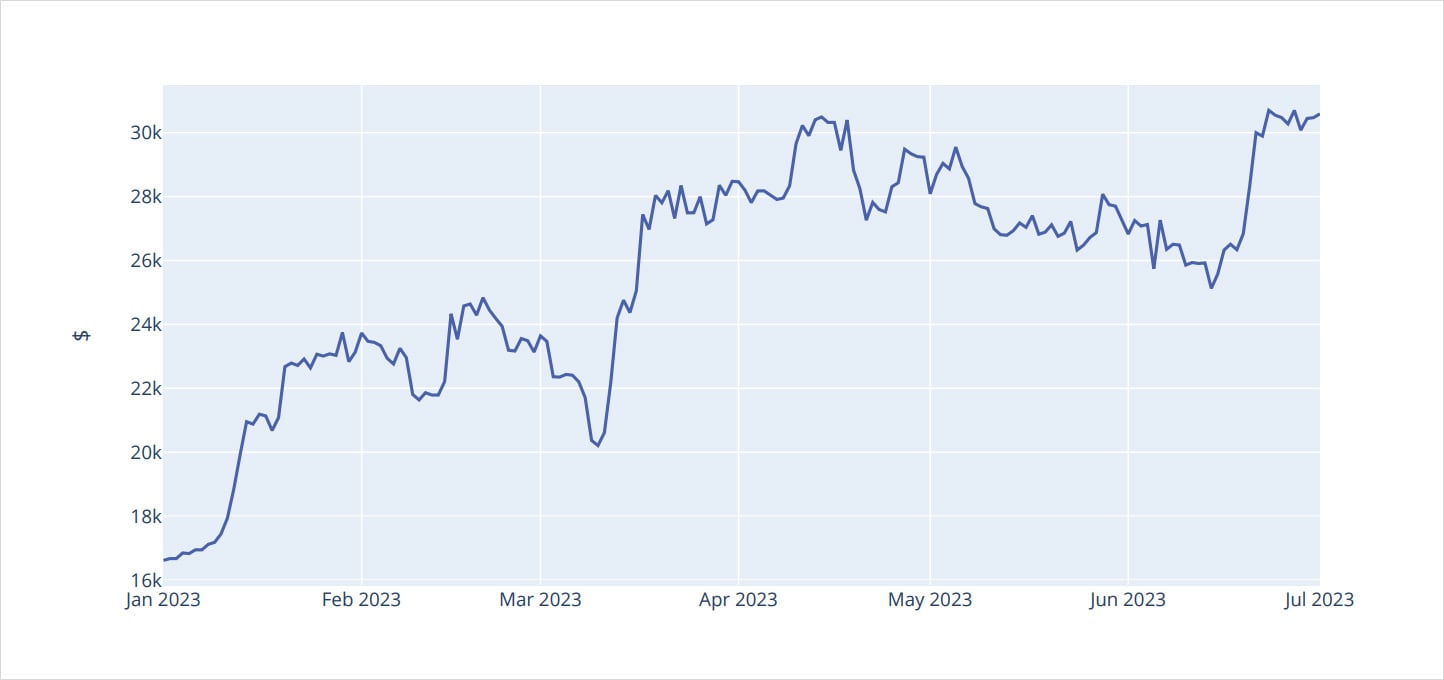
BTC Spot Prices
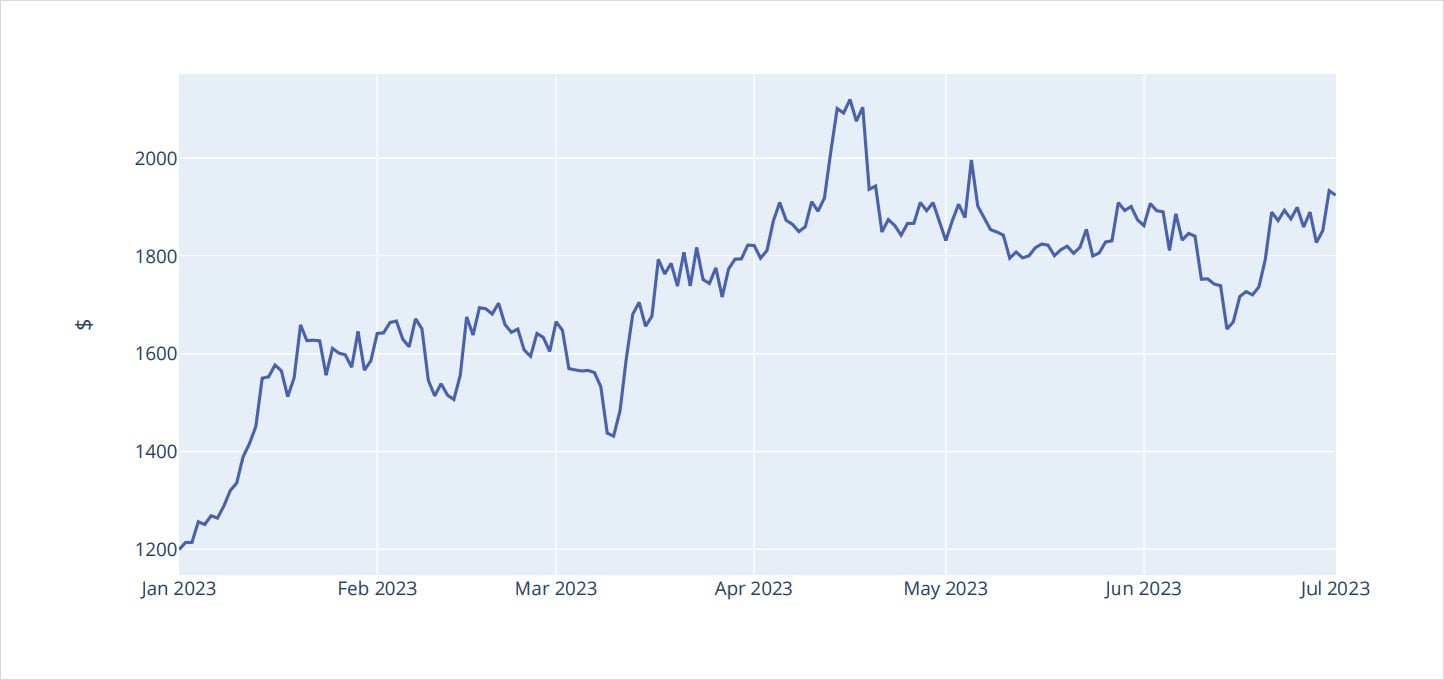
ETH Spot Prices
BTC vs ETH Price % 2023 YTD
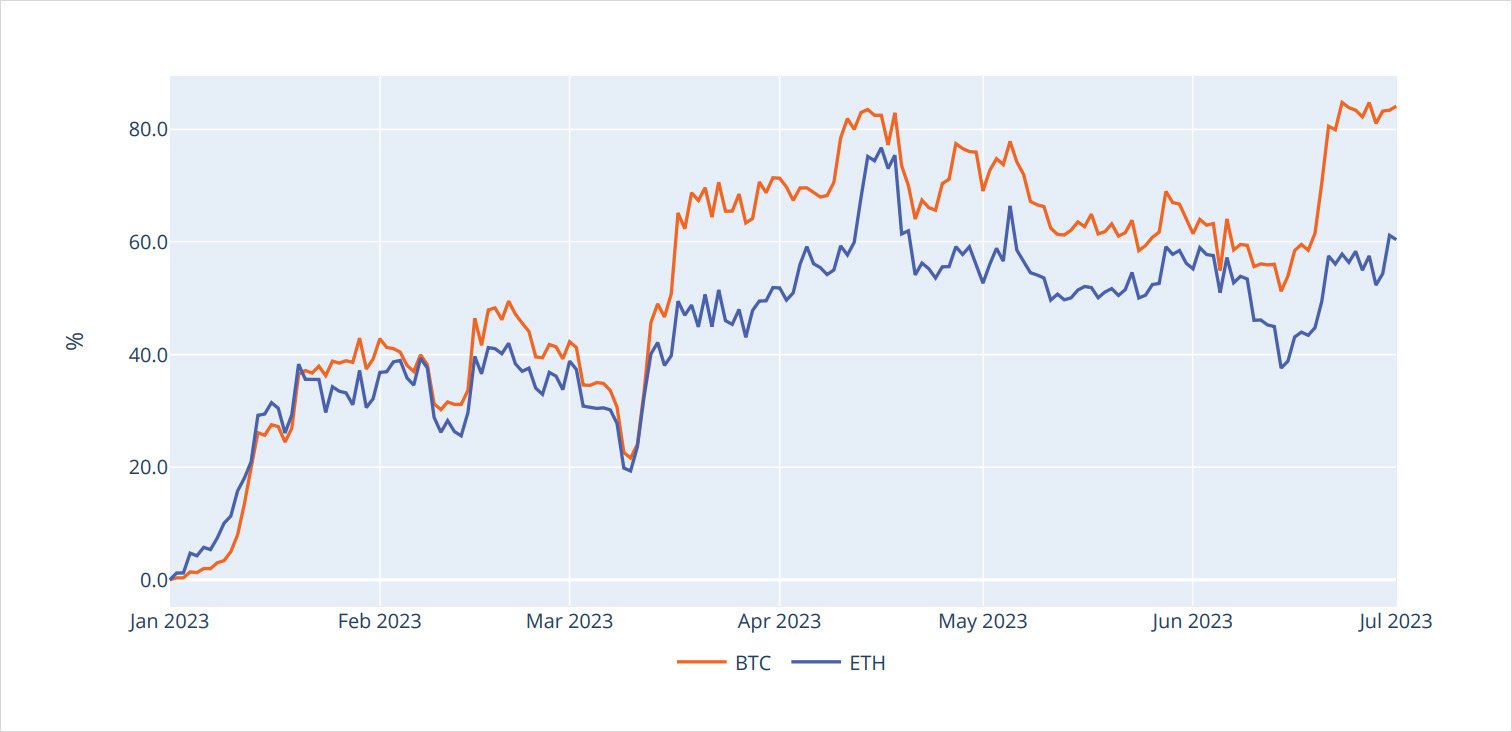
Looking at the BTC and ETH performance overlay, we can witness two important phenomena right away:
- BTC is up +80% YTD, while ETH is only up about +50%.
- BTC’s outperformance really began in earnest after the SVB banking crisis witnessed in mid-March.
These trends support the spot/vol dynamics that BTC has displayed compared to ETH (which we will soon visit) and support the fundamental thesis that BTC moves in response to monetary policy (and macro) more so than ETH.
Spot/Vol Dynamics
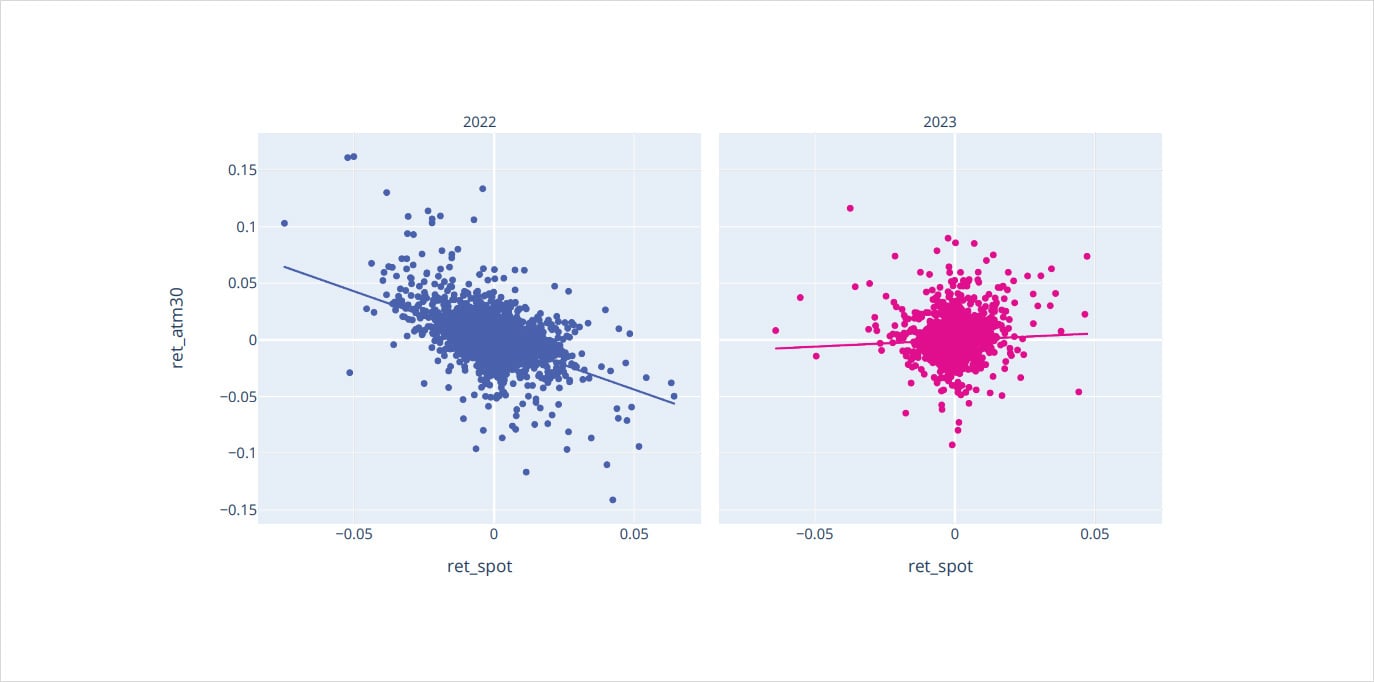
BTC Correlations Log Returns Spot/Atm30
ETH Correlations Log Returns Spot/Atm30
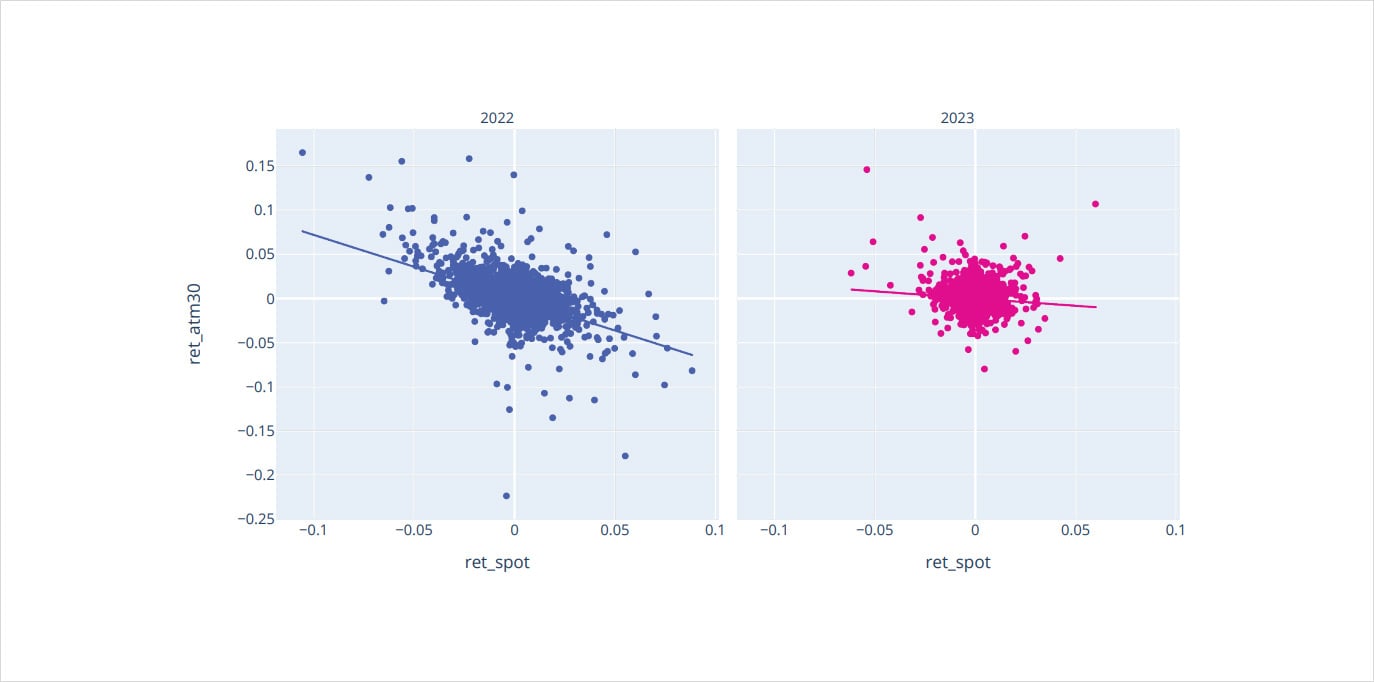
Comparing the scatterplot of spot price returns vs changes in 30-DTE “at-the-money” implied volatility, we see two significant trends here as well:
- In 2022, both BTC and ETH had nearly identical relationships to each other.
- 2022 displayed decidedly negative spot/vol regimes, while this year BTC displays a slightly positive spot/vol dynamic, while ETH’s negative spot/vol relationship is much more muted.
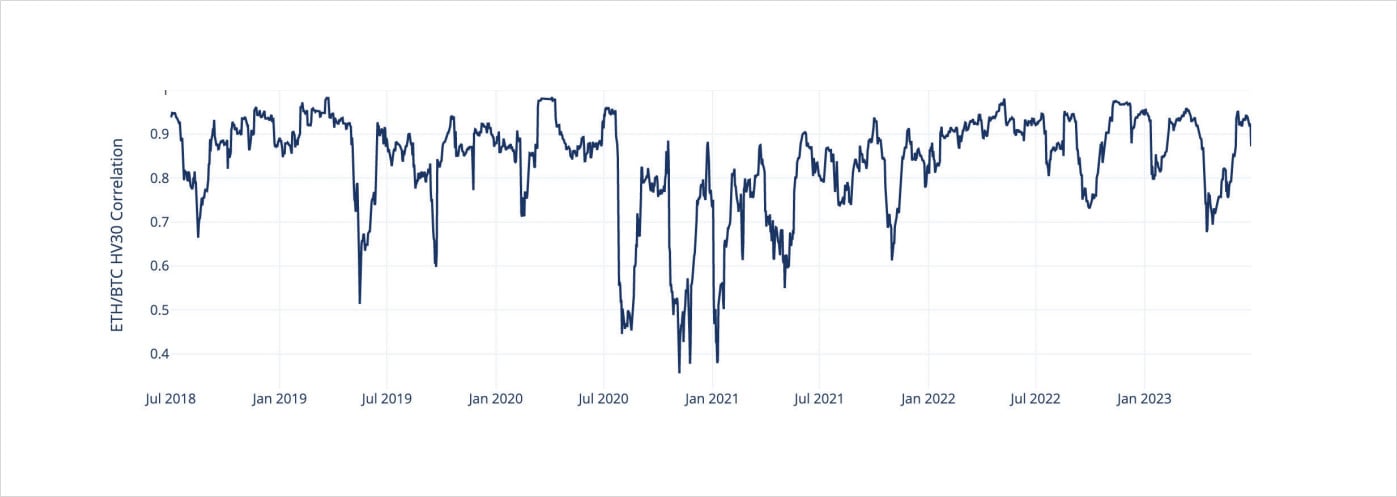
The divergence in spot/vol dynamics of tightly correlated assets is a fascinating event.
30 Day ETH/BTC Historical Volatility Correlation
Risk-Reversal Skew
BTC Skew (C-P) 25 Delta Constant
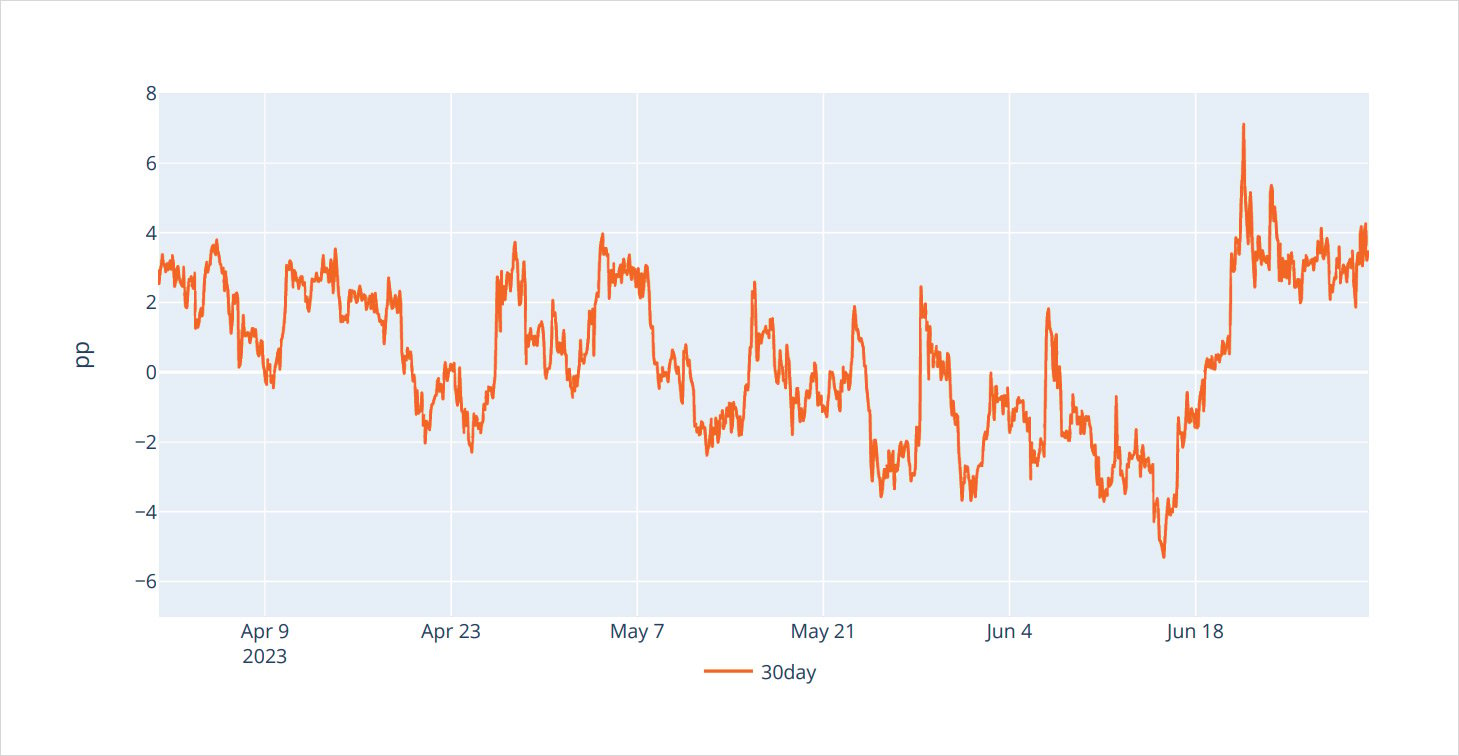
ETH Skew (C-P) 25 Delta Constant
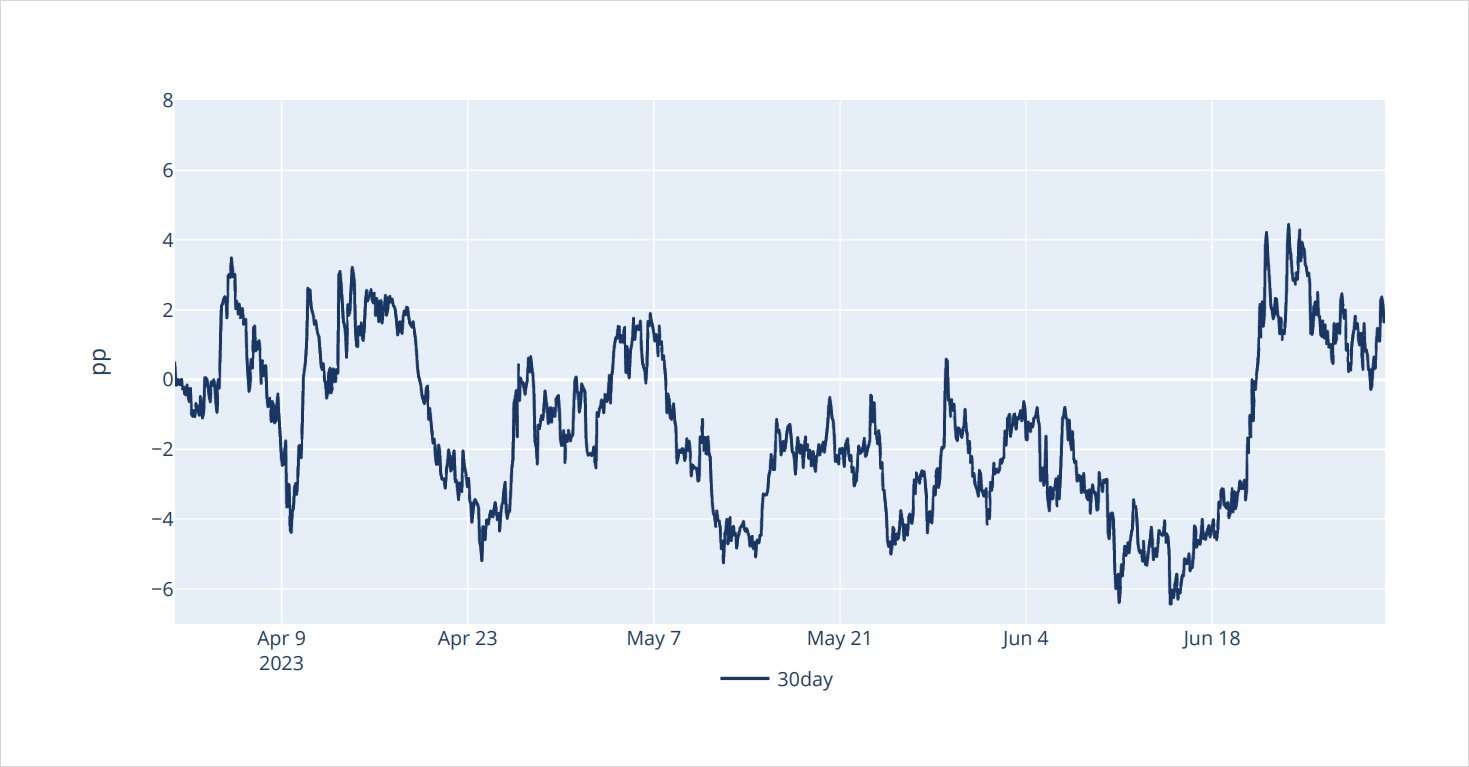
Looking into the volatility smile for BTC and ETH, we witness how this relationship divergence is being priced.
While BTC Δ25 calls currently trade at an implied volatility premium of + 4pts to Δ25 puts, ETH Δ25 calls trade at “par” to Δ25 puts.
This relationship is comparable in absolute volatility terms, given that both assets currently trade at equal implied volatility levels.
Beta and Realized Volatility
Beta ETH vs BTC Rolling 30 Days Returns
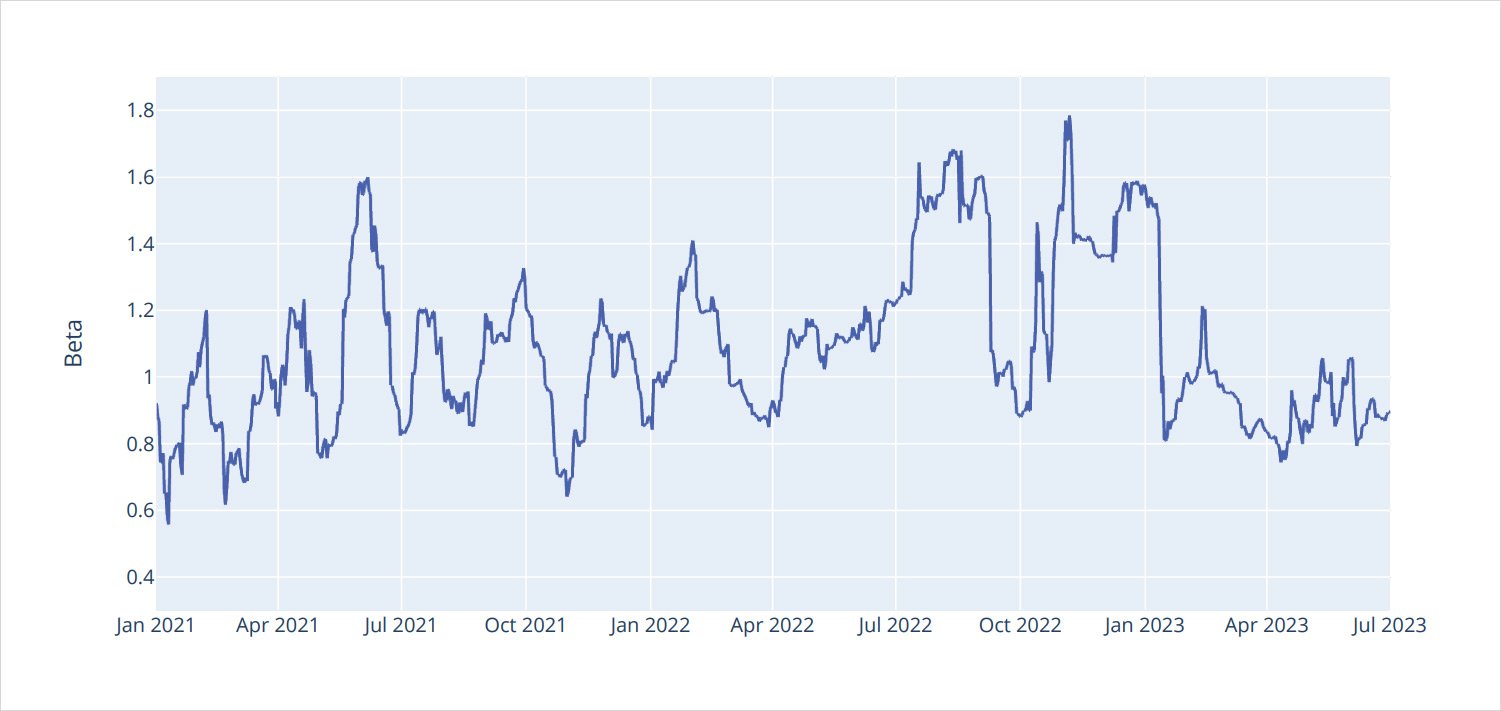
In order to explore the relative volatility of BTC and ETH, it makes sense to first measure the relationship in realized terms.
Here we look at the “beta” of ETH in BTC terms. Meaning if our beta value is greater than 1.00, ETH outpaces BTC’s move. Vice versa when we are under 1.00.
Historically speaking, we can see that ETH has normally had a much higher beta than 1.00; this trend has stopped in 2023, especially in Q2 2023.
Now, not only is the beta between 0.80 and 1.00, but the volatility of the beta parameter has subdued, making our currently new beta environment also a stable one.
Realized Volatility 30 Days

Looking at outright realized volatility, instead of beta, we can see a structural downward trend that has culminated in both BTC and ETH, with realized volatility becoming compressed, but ETH’s excess RV vanishing is what’s really interesting: that’s something that has only been true since midMarch 2023.
Implied Volatility
DVOL Index
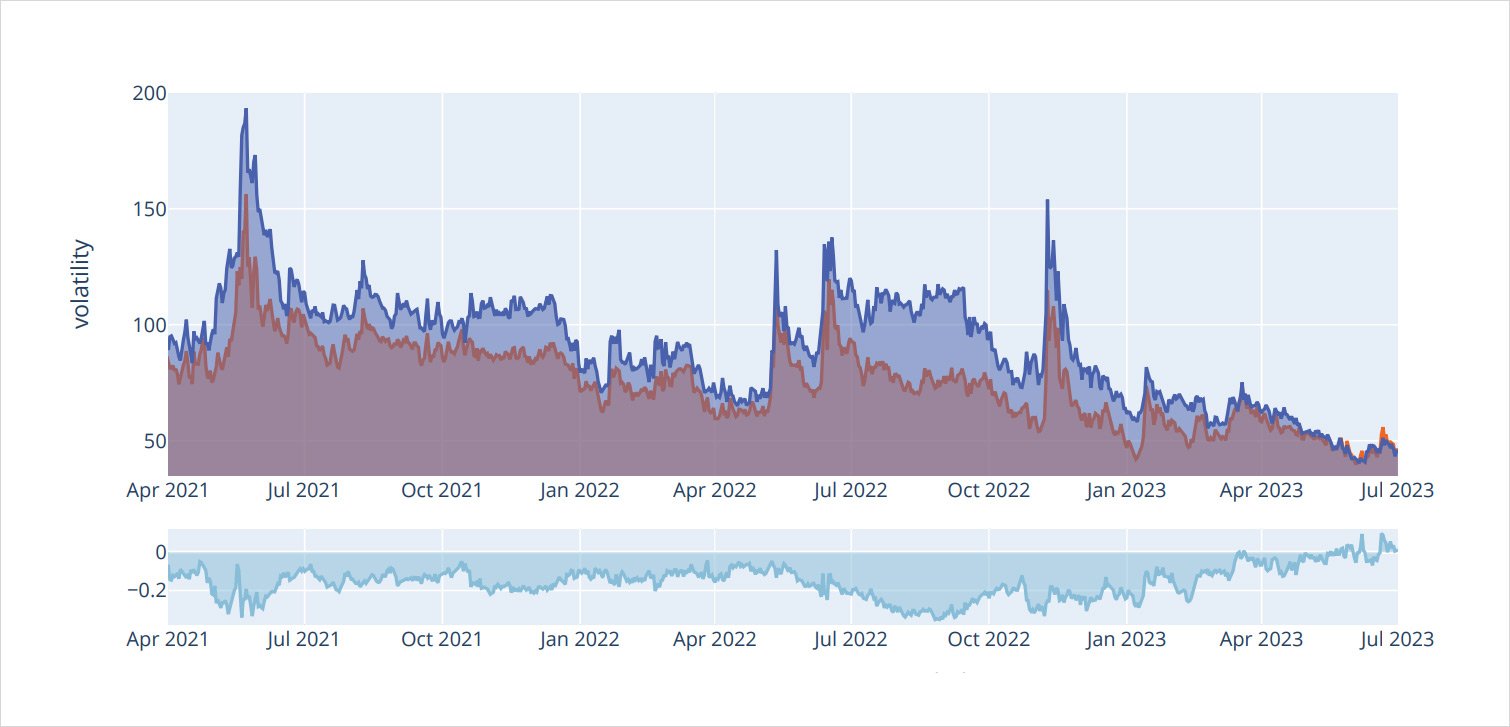
Moving into the implied space, using Deribit’s DVOL indices for both BTC and ETH gives us a “clean” comparison.
Just like in the realized space, we see a massive structural compression for implied volatility in both assets, with the very recent phenomenon of BTC DVOL actually exceeding ETH DVOL by a small margin.
The potential for mean reversion in relative volatility, the divergent spot/vol regimes and the low absolute level of volatility overall, could make for interesting ideas and combination trades.
Gamma Profile: Decoding Options Flow
When we started to analyze option flows we realized that the taker direction of trades calculated by the Deribit engine was not always reliable under certain scenarios.
We wanted a more nuanced calculation for taker direction, one that could take into account all the types of trades hitting the order book. For example, some different and more complex rules needed to be used for block-trades or spotting resting orders in the orderbook.
With that goal in mind, in early 2022 we released a new tool that has a unique algorithmic approach to direction detection.
We can use our orderbook snapshots at the milliseconds level “pre” and “post” trade execution to calculate how the trade compared to and impacted the orderbook.
The initial approach was to separate the different types of trades encountered:
- On screen trades.
- Single leg block trades.
- Multiple legs block trades.
We added further dimensions beyond mark-prices/ iv, best bid/ask prices/iv, best bid/ask sizes, and midprices /iv. For multiple legs block-trades we consider the trade in an aggregated way. For onscreen trades, we inserted essential rules to spot resting orders.
Eventually, we added even a multiple time frame aggregation – a rule to spot the same type of trade and direction in specific times span (e.g. 20-minute or 1 hour). This type of rule helps to add more consistency to direction detection and avoids cases when the same trade executed at the same price but flipped direction due to lag.
In the end we finished our algorithm with around 30 heuristics (high probability rules), to assess the real initiator’s trade direction.
These rules are in competition and each rule is assigned a weight. Results are aggregated for determining the final direction of the trade.
Think of a rules-based matrix grid, each rule giving a probability scoring the likely direction of the trade.

All these rules then conclude into a high probability final trade direction estimate.
These results are continuously under process improvement and validation, using both quantitative tools and qualitative feedback from experienced traders and market-makers.
Just to give an idea of the impact of our proprietary calculation: in Q2 2023 heuristics differed around 31.6% (in volume) and 36.5% (in number of trades) versus the reported direction from Deribit for BTC options.
The following flow analysis, positioning, and gamma exposure of dealers is based on this calculation of direction.
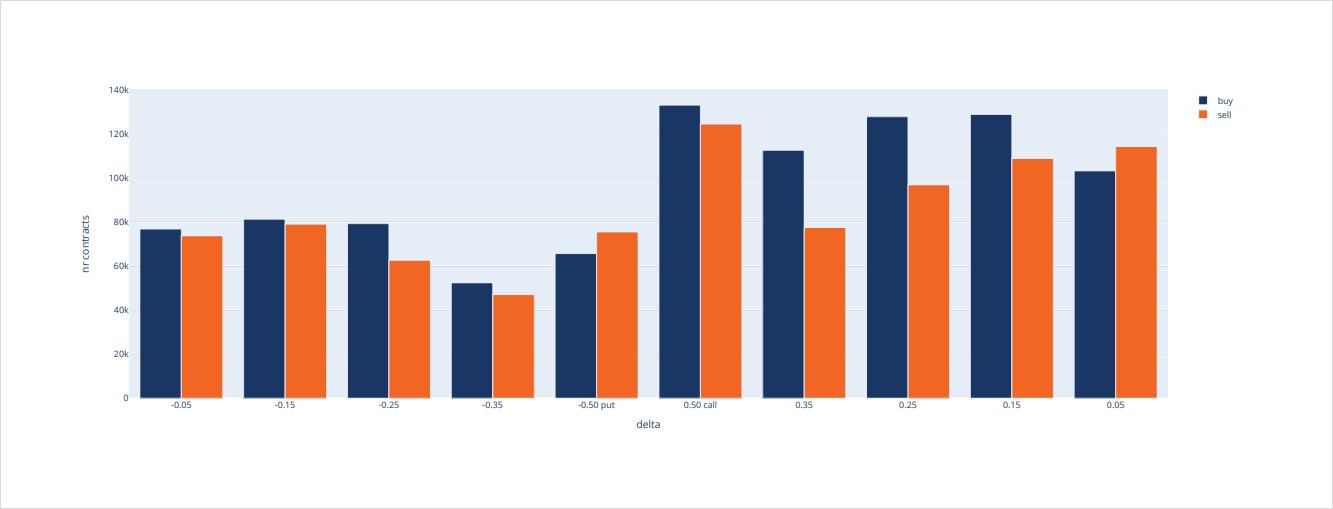
Q2, 2023 – Flow Stats
Premium Pie Charts Notional
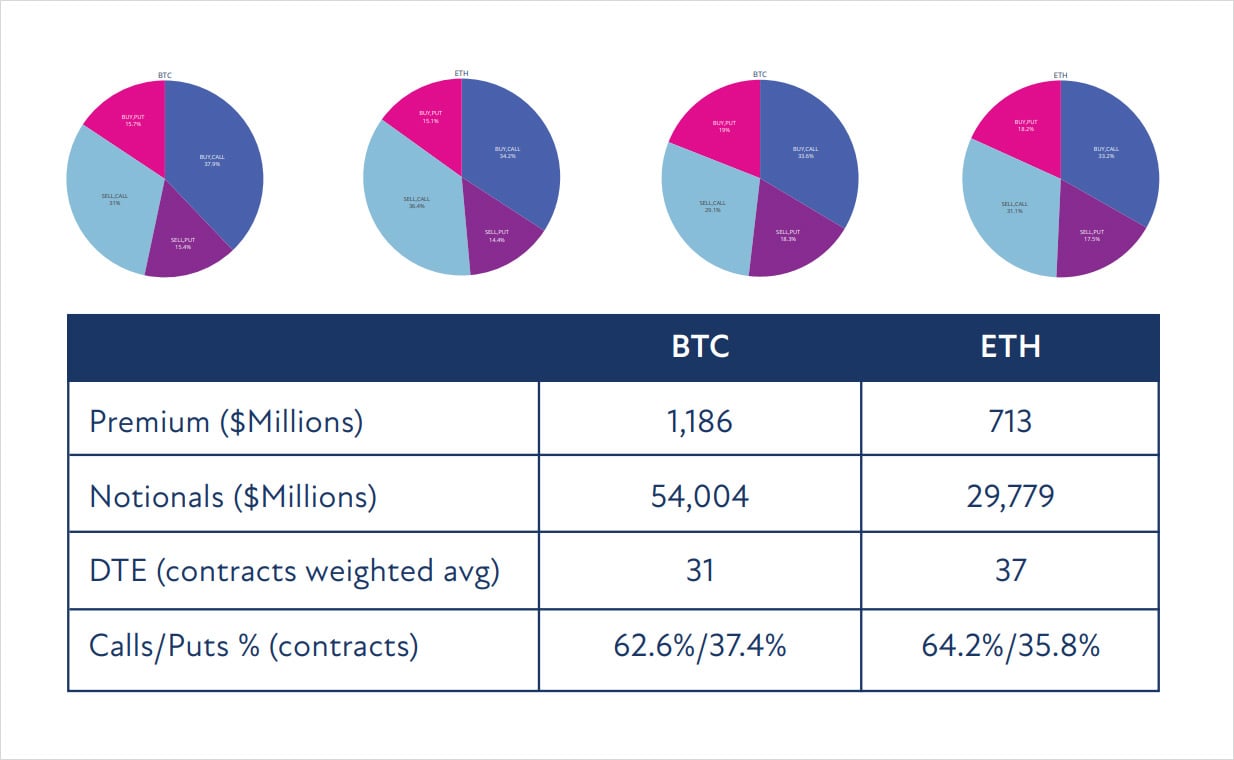
ETH Grouped Trades For Delta Grid Buckets
BTC Grouped Trades For Delta Grid Buckets
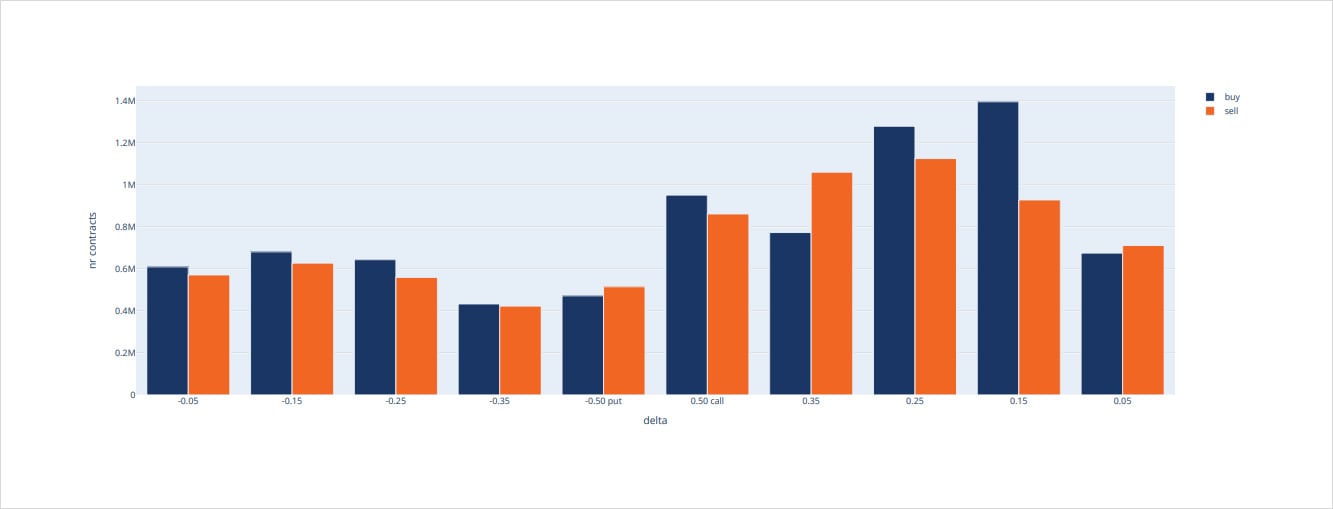
Decoding Flows
We saw a constructive period after ending Q1, with BTC & ETH prices at $28k and $1.8k respectively; but as is often the case, the route was far from smooth.
April
Much anticipation at the beginning of Q2 pointed to the Shapella upgrade on Ethereum, scheduled to occur April 12th, 2023. The uncertainty surrounding how much ETH may be unstaked created some demand for ETH optionality, pushing the ETH DVOL 5% > BTC DVOL.
DVOL Index
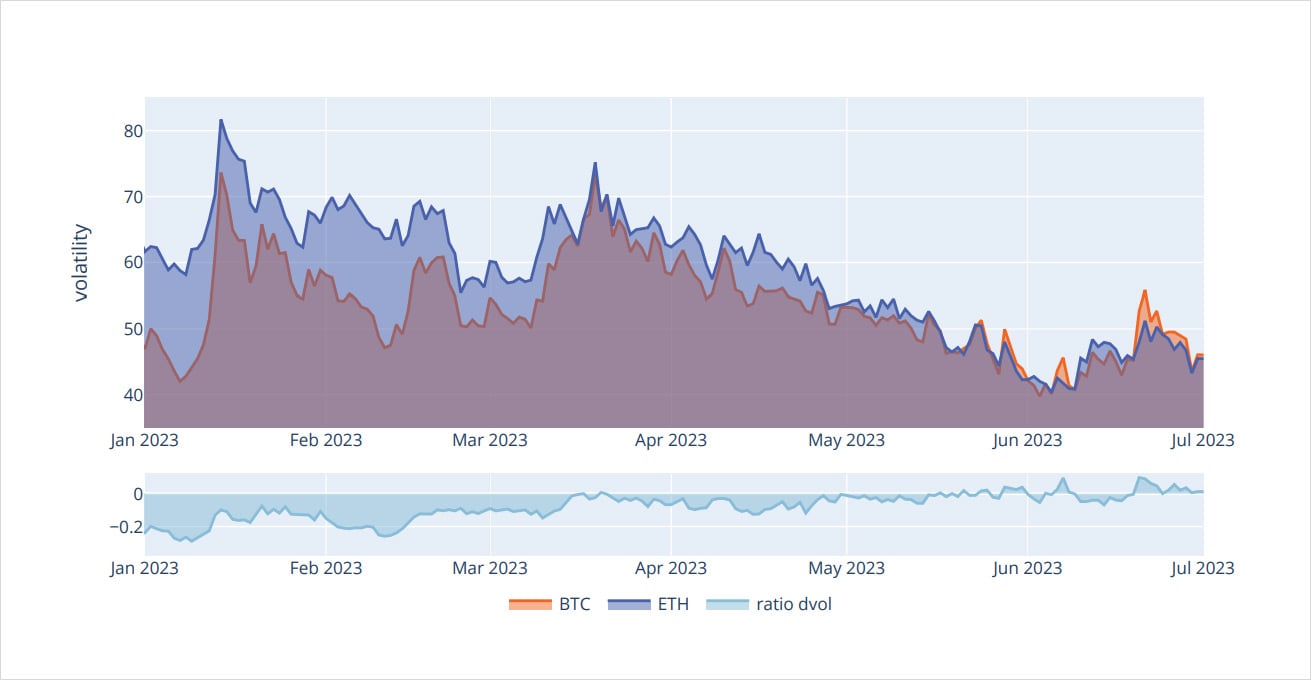
Some of this differential also came from profit taking in outright calls and call spreads for BTC, ahead of April FOMC on the same date.
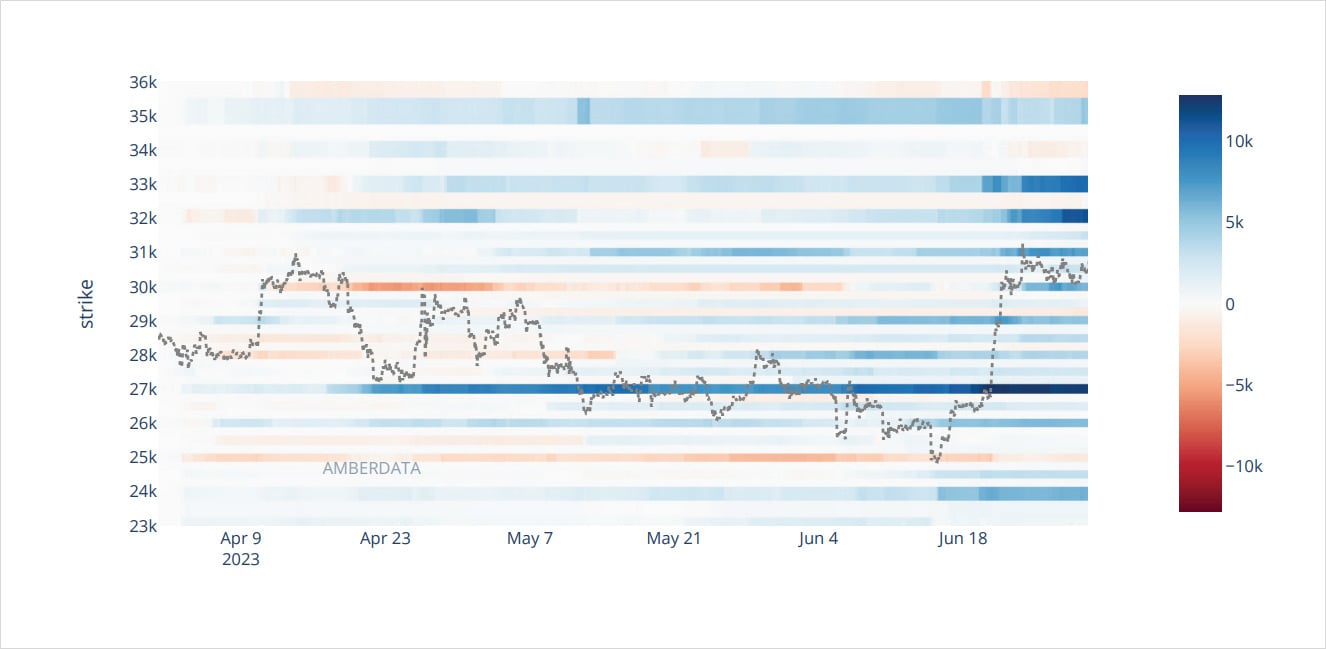
While there was optimism for ETH, there was hesitation for BTC after the impressive year-to-date rally; BTC protection was bought targeting the $27k Strike via “Put-Flys” and “Risk-Reversals”.
BTC All Cumulative Net Volumes
May
The ‘Sell in May’ adage kicked in quickly as the Ethereum Foundation sold some holdings. Some entities also took this to mean sell IV too, as ETH upside (Sep $2.6k, Dec $3k) calls were sold into the market bringing ETH and BTC DVOL differential to zero.
ETH All Cummulative Net Volumes
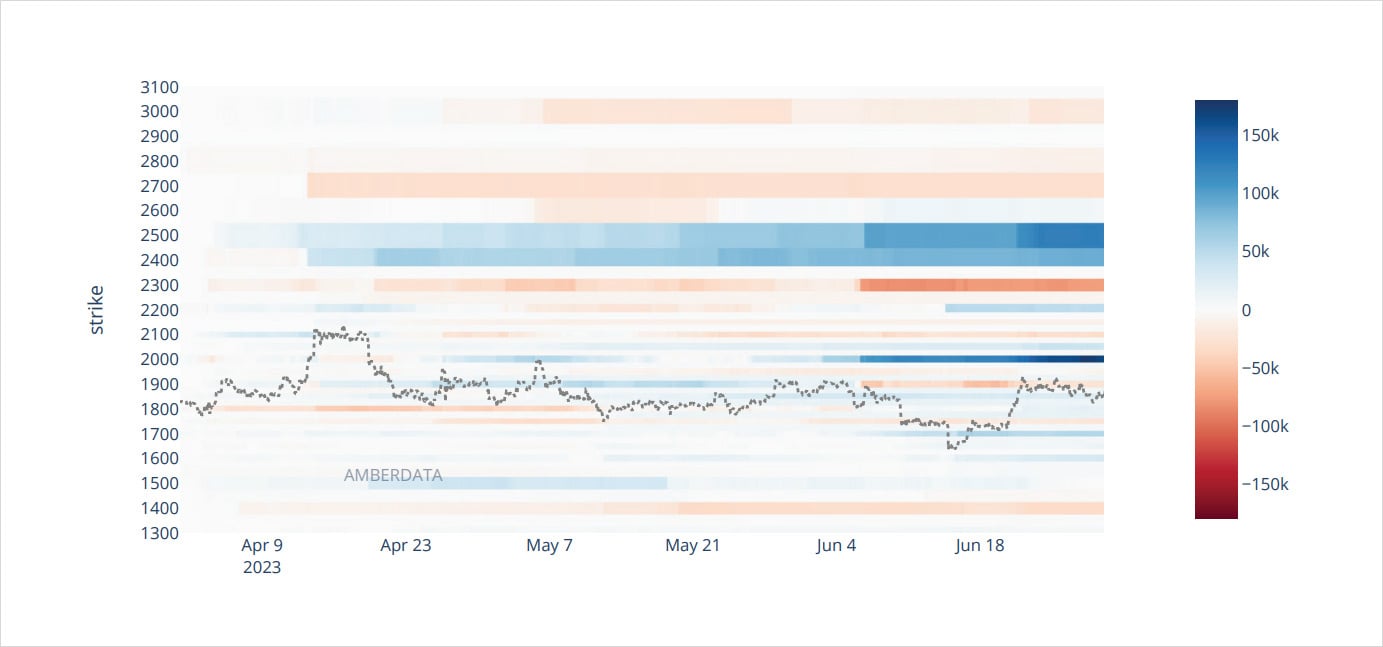
By mid-May, BTC was testing the $27k area that protective strategies had targeted, and ETH was back to $1.8k.
There had been a burdening pressure on ETH IV since Q4 2022 due to a large entity that had sold ETH June$ 2.2k calls; but as the June expiry approached, Sep-Jun $2.2k calendar spread was sold 60k (buying back the Jun short, transitioning to a Sep $2.2k short) and additional Sep $2.3k calls were sold, to continue “rolling” strategy exposure.
At first, large liquidity providers and funds were happy to buy mid-term IV at year lows and sell shortterm while realized volatility was below 30%. This would fund longer-term vega by selling short-term gamma, while receiving theta/decay.
BTC ATM Constant Volatility
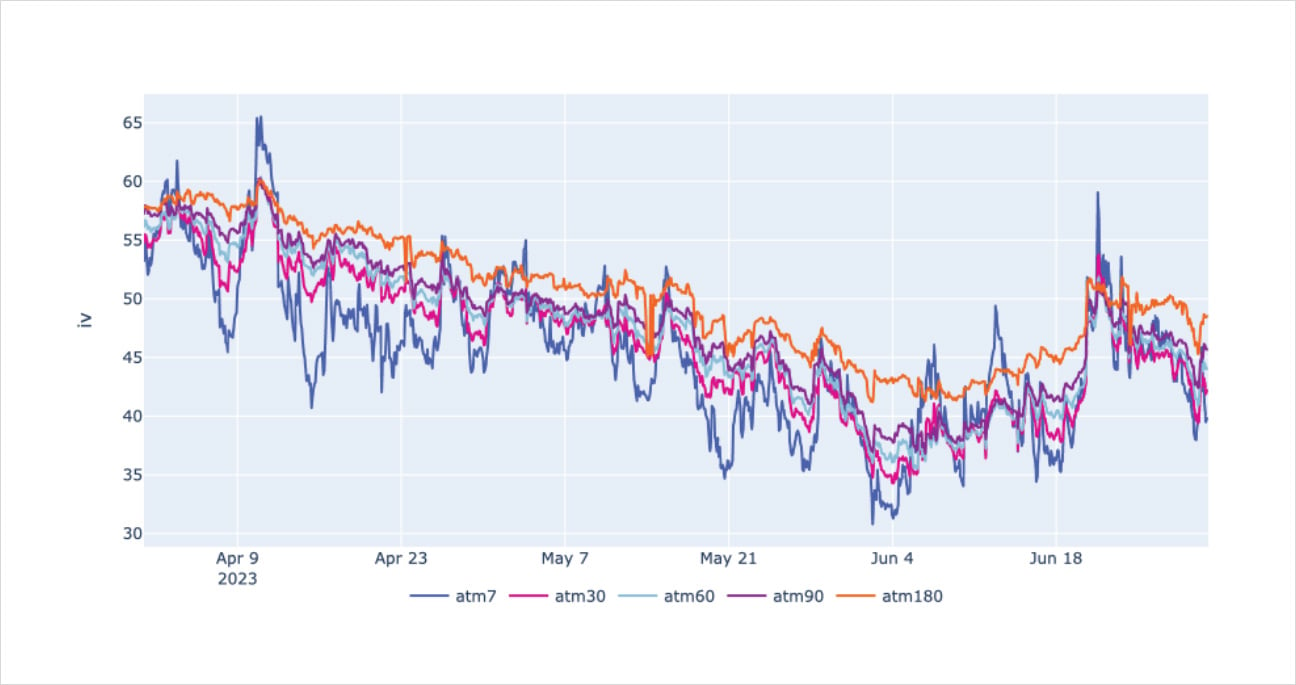
But instead of the term-structure steepening, as had been hoped, further ETH vega supply was dumped into a saturated market.
ETH Sep-Jun and Mar2024-Jun call spreads, BTC Sep-Jul $32k, Dec-Sep $34k call spreads were sold and additional +60-DTE $30k-$33k calls were being sold for yield.
ETH ATM Constant Volatility
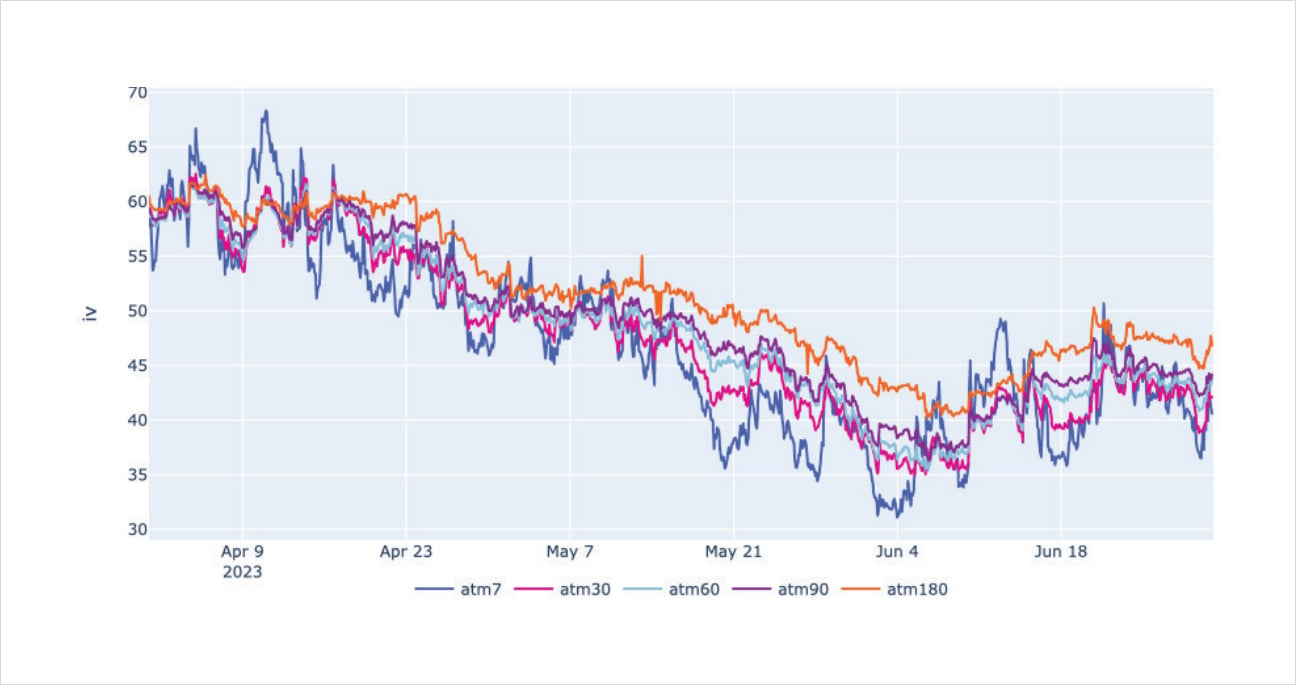
This caused the term-structure to parallel shift lower by 20% through mid-June, and DVOL was to hit all time lows around 40%.
June
Positioning was hit worse for liquidity providers as the SEC attacked Binance and Coinbase at the start of June. This sent BTC and ETH spot prices plunging below $25k and $1.65k, igniting demand for gamma (short-term expirations) – but not vega – forcing the term-structure into backwardation against the crowded trade.
When there seemed to be no hope left, the entity short Sep $2.2k calls covered them in one fell swoop, bidding vega higher. Then, out of nowhere it seemed, BlackRock released news of their Bitcoin Spot ETF application.
This ignited spot and call buyers – fast money in Jun $27- $33k calls and fund led July+Aug $36k, Sep$30k+$36k, Dec $33k+$40k calls – all BTC led, as within a few days BTC had rallied back to $31k and DVOL surged from 40% to 55%, recovering the month’s losses.
BTC DVOL traded at a 5% premium to ETH, with ETH lagging in spot and IV terms.
Some profit-taking on spot and in calls took DVOL back <50% again.
Quarter-End
As spot prices held, renewed optimism and upside convexity has taken hold in both assets into quarter-end.
Large BTC buying flows in Jul $31k+$32k calls, Aug+Sep $35k calls, Sep $35k-$40k call spreads, Dec $35k-$45k call spreads, Dec $40k calls; while ETH saw Dec $1.9k-$2.5k call spreads bought recently adding 60k exposure.
Some of these Call spreads and additional reverse riskreversals (buying Call, selling Put) are so confident to fund the upside with selling downside puts that they often sell below the 25k Strike.
We can only assume this confidence is putting a high probability of success on BlackRock and additional Spot ETF applications by reputable institutions such as Fidelity and the CME.
Primary decisions or requested extensions on these applications are expected in Q3.
Gamma Methodology
With proper taker detection (initiator of a trade), in late 2022 we started to build what it is called “GEX”, first released with the seminal paper of SqueezeMetrics in 2016 (then revisited in 2017). That paper built up upon four main assumptions:
- All traded options are facilitated by delta-hedgers. This is to say that every option contract is either bought by, or sold by, a market participant whose business is to profitably manage a book of options.
- Call options are sold by investors; bought by market-makers.
- Put options are bought by investors; sold by market-makers. As with calls, puts are primarily used by investors who are already exposed to the underlying market.
- Market-makers hedge precisely to the option delta. If market-makers hedged their deltas every time an option’s delta changed, they would be trading incessantly. In reality, market-makers utilize “hedging bands” to balance the twin challenges of hedging costs and delta risk. Since it is not feasible to gauge the breadth of every market-maker’s hedging band, we simply use the delta of the option.
Using our tools, we can actually optimize some of the initial base assumptions from the SqueezeMetrics paper. Instead of assuming MMs buy calls and sell puts, we can instead precisely tag each trade and see the impact on the open interest for the specific contracts traded. From there, we can tally the net inventory of dealers and estimate their cumulative exposure.
Of course, we have our own set of baseline assumptions and their own potential objections:
- Taker is a trader and the maker is a dealer: this doesn’t always hold true (for example: some trades are actually between dealers).
- Takers do not hedge while makers do: this, also, is an assumption we have to rely on.
- Deribit is representative of outstanding positioning: although Deribit is the largest crypto volatility venue, OTC trades and other CeFi venues are not currently incorporated.
That said, we need to make some assumptions to isolate a signal and cut through the noise of everyday trading activity. Even a subtle signal, amongst uncorrelated noise, can output a general picture of the likely phenomenon that is pretty reliable in direction and magnitude.
The net inventory of dealers is continuously updated with every trade executed on Deribit.
Although there are certain limitations to this model – such as the failure to take into account crossplatform hedging by dealers or trades that are not settled on Deribit – it remains a robust tool. Its relevance is anticipated to increase as options gain more prominence in the future, similar to what occurred in equities. Once the option notional open interest outstanding is a large enough percentage of underlying market cap, we could expect outsized hedging activity to affect spot prices.
Gamma Exposure
Using our proprietary methodology, we are able to tally up the net dealer inventory for each tradable instrument. We then aggregate gamma levels for each strike.
This is the net gamma exposure observed for Bitcoin going into the June 30th, 2023 quarter-end expiration cycle.
BTC GVOL Gex – 30th June, 2023
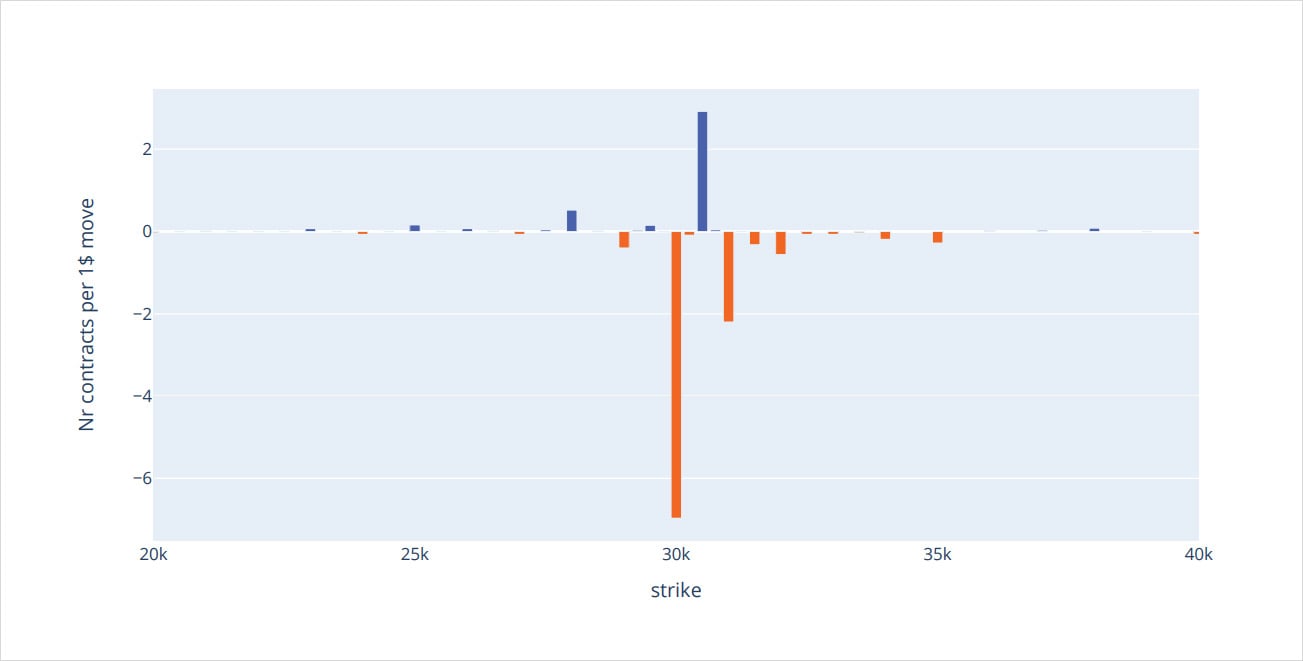
We can further dissect this strike aggregation by splitting up values by different expirations:
BTC GVOL Gex Expiration – 30th June, 2023
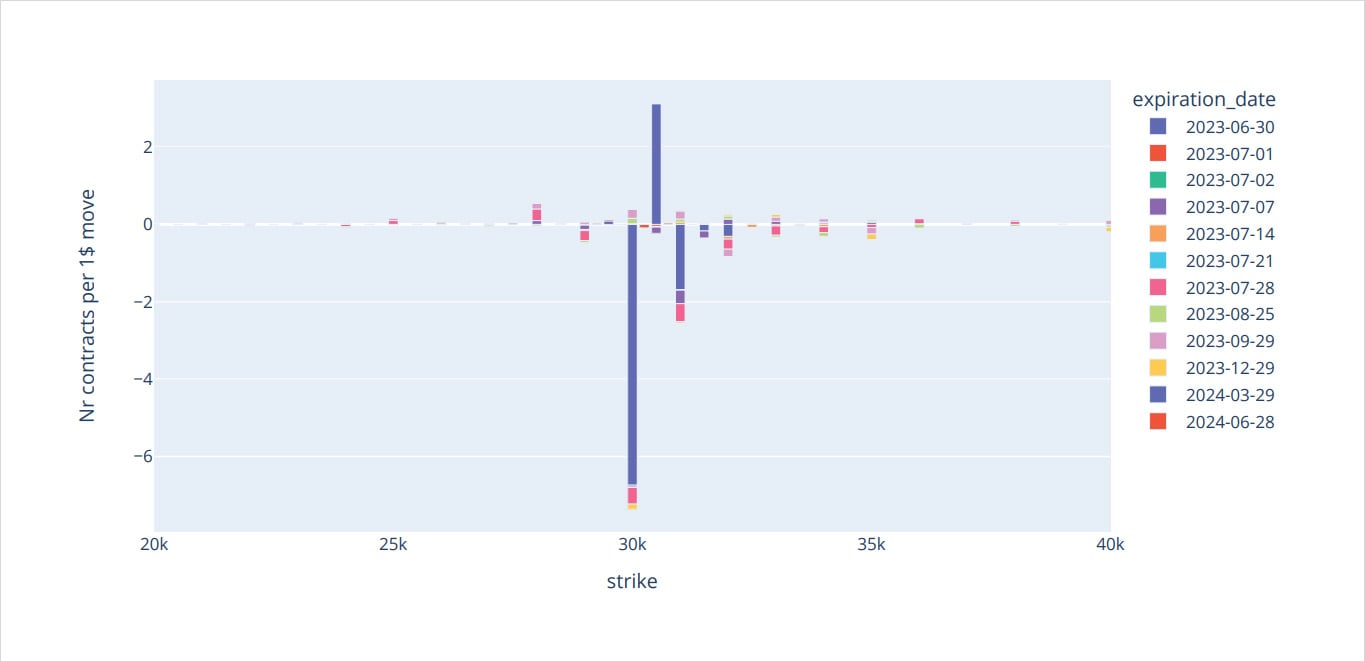
The charts above look at the absolute number of contracts in dealer inventory that need to be hedged. The change in delta rate is represented for $1 moves in the underlying.
In the following chart, we instead look at how many millions – in notional – that dealers need to trade in order to remain delta neutral in case of a 1% move in the underlying. This incorporates total gamma exposure across expirations and strikes.
BTC Total Gamma
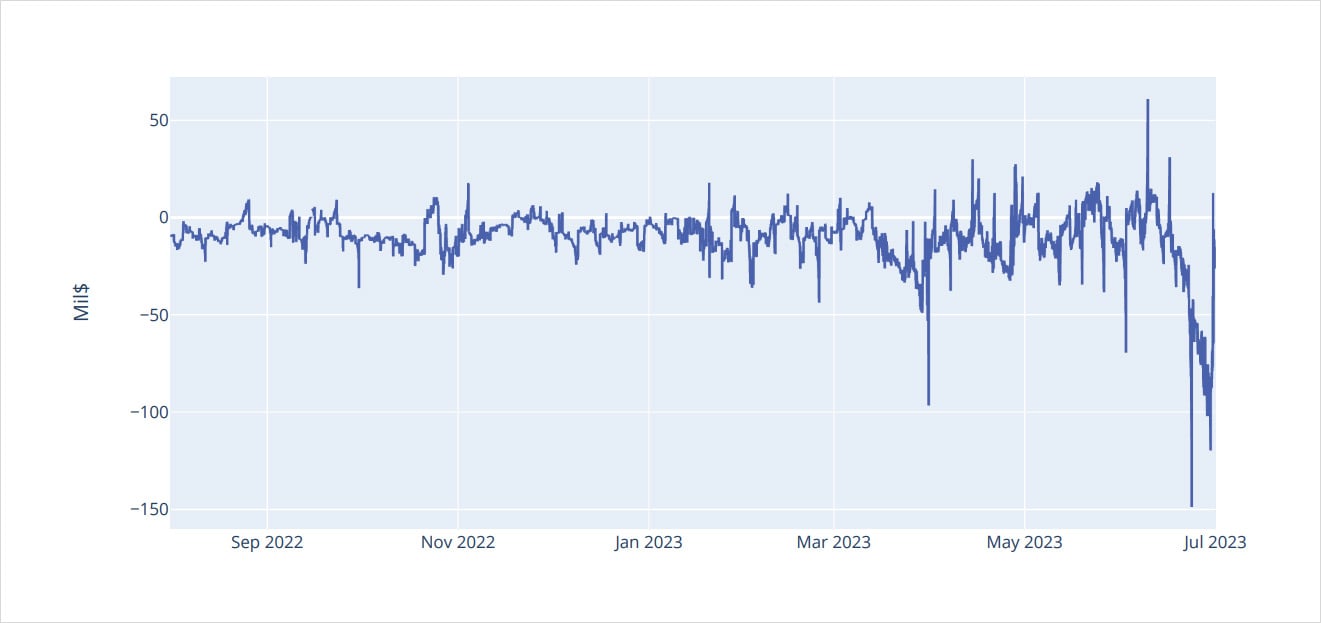
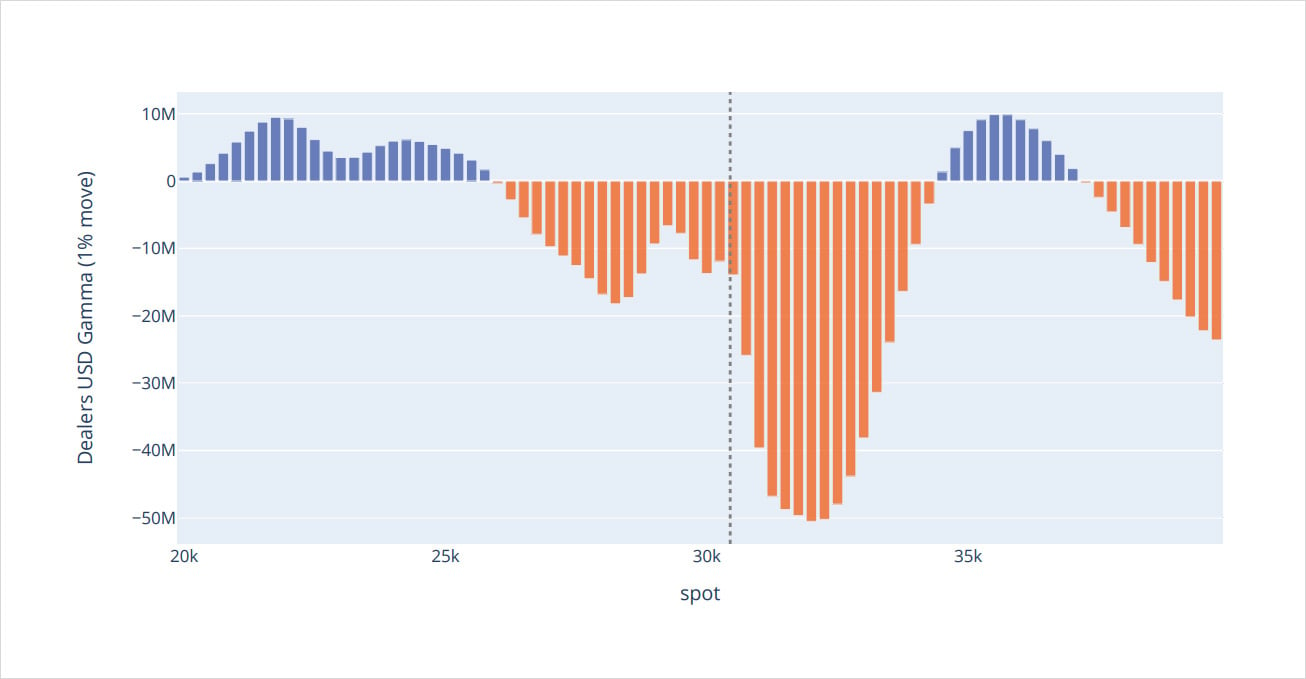
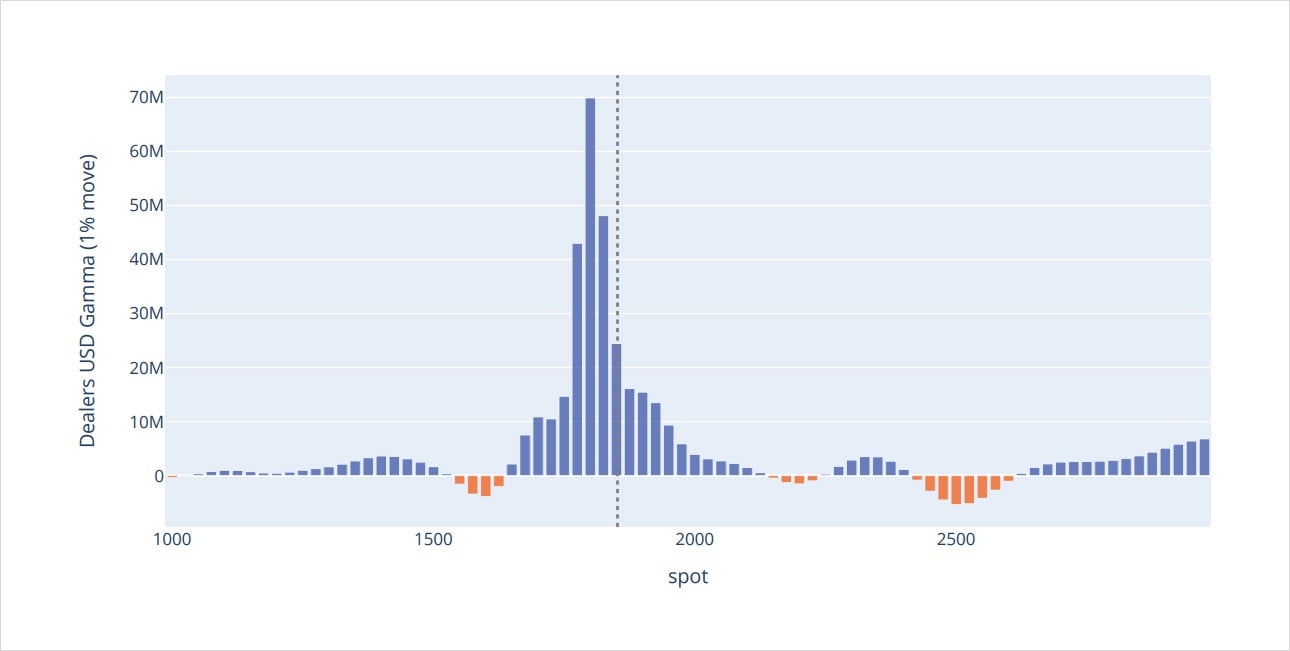
The tools we’ve seen so far calculated the gamma exposure for the current spot price level only; that means using a “static gamma”. But when spot markets move, outstanding gamma values change as well. The tools featured below take spot price changes into account to calculate the “dynamic gamma” exposure of dealers using at-the-money spot pricing and Black-Scholes model gamma.
Here we can quickly spot points where gamma could “flip”.
BTC Total Dealers Gamma Profile at Deribit
ETH Total Dealers Gamma Profile at Deribit
DVOL
The DVOL index will give us a clean and normalized view of the implied volatility market by enabling a constant 30-DTE, along with a comprehensive view of the entire option skew (up to the Δ5 cut-off). Read more about DVOL here.
The VRP
TL:DR – Short-volatility is the “base-case” for BTC options strategies.
Bitcoin Variance Premium
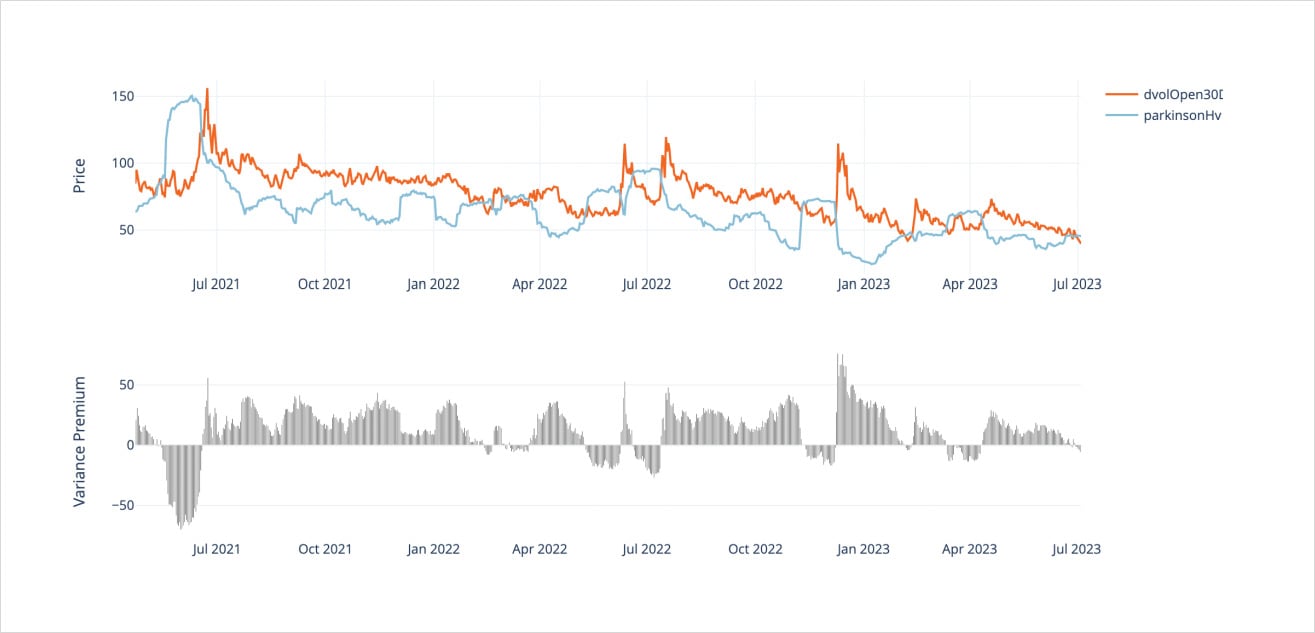
One of the clearest phenomena we can observe using DVOL to calculate the historical VRP – aligning RV with shifted DVOL IV – is the general tendency for Bitcoin options to be overpriced relative to realized volatility.
Only 25% of the time is the VRP less than +1.80 IV points and although the minimum and maximum VRP are both around the +/-70 IV point range, only 5% of the time is VRP -20 points or less. Alternatively, the median VRP value is +14 IV Points.
This clear trend suggests that the “base case” for crypto option traders is to lean towards short-vol strategies in crypto.
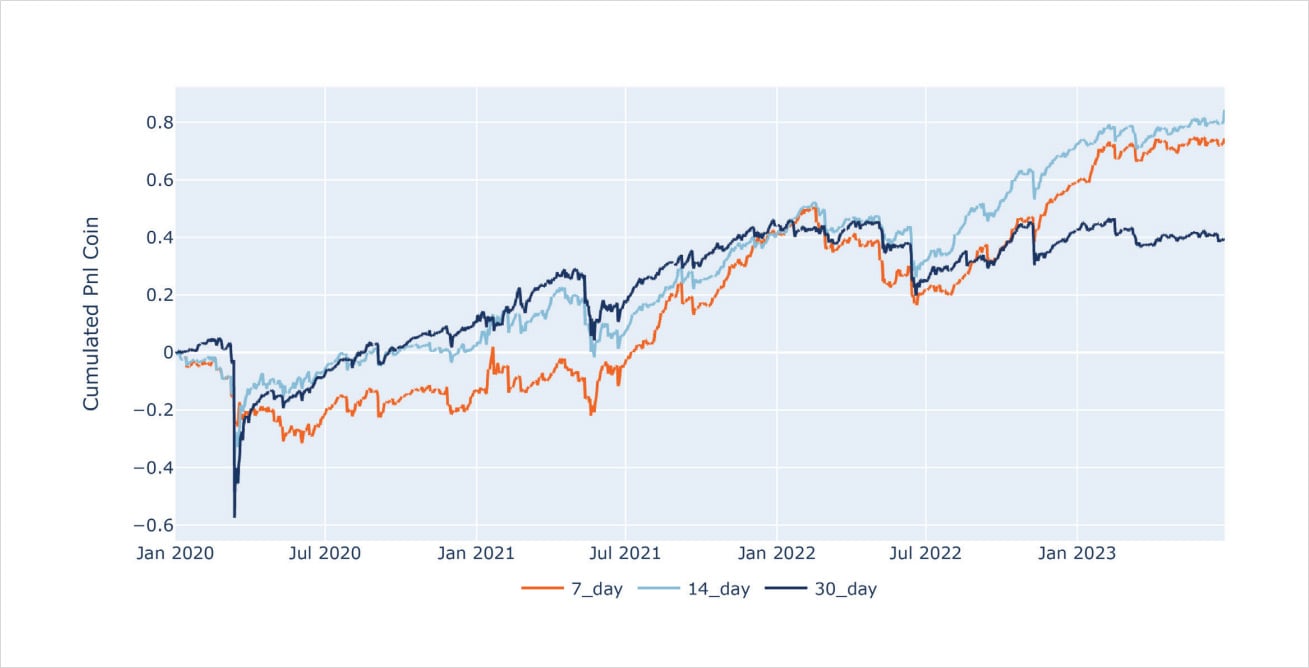
We showed this in our January 2023 report backtest. There is massive profitability in straddle-selling strategies, using simple rules-based delta hedging techniques.
Systematic BTC Straddle Selling (2.50% Hedge Threshold) 2019-05-01 to 2022-12-04
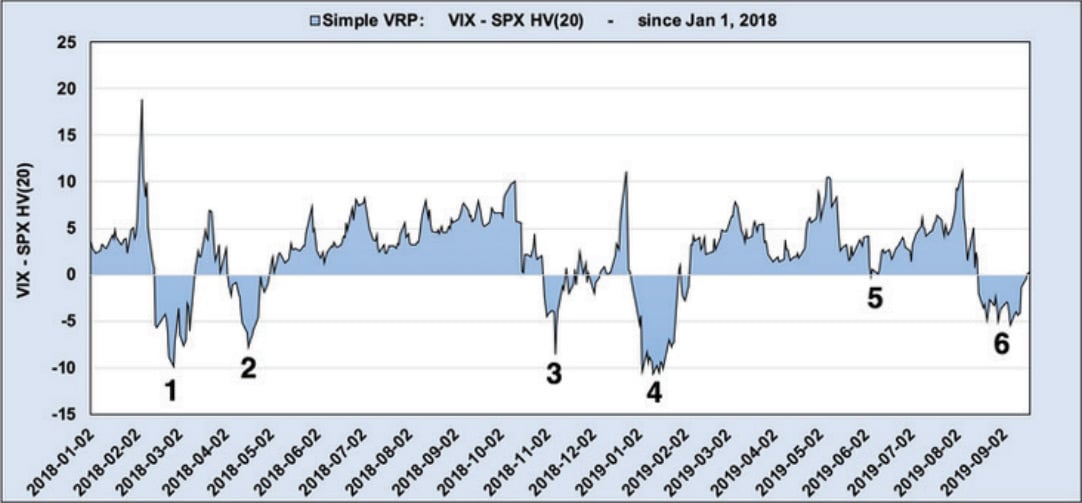
Compare this to the VRP seen in VIX & SPX.
Chart From Volatilitytradingstrategies.com
There are a few theories why this extremely large VRP exists in crypto and BTC specifically.
- The crypto market was built by retail first, often with FOMO enthusiasm. This means that well capitalized volatility sellers are generally out-numbered by enthusiastic volatility buyers when things start moving.
- Another factor is due to the nature of institutional flows. Historically, fund managers supply call options by buying the underlying assets and selling “covered calls” against them. Until institutional players participate en masse into the crypto volatility, the supply of CC selling is limited.
Note: For the first time ever, we seem to be witnessing this trend in ETH and it has quickly crushed IV lower, to historically new relative volatility levels.
DVOL and RV
Bitcoin DVOL and Z-Scores: High and Low Percentiles
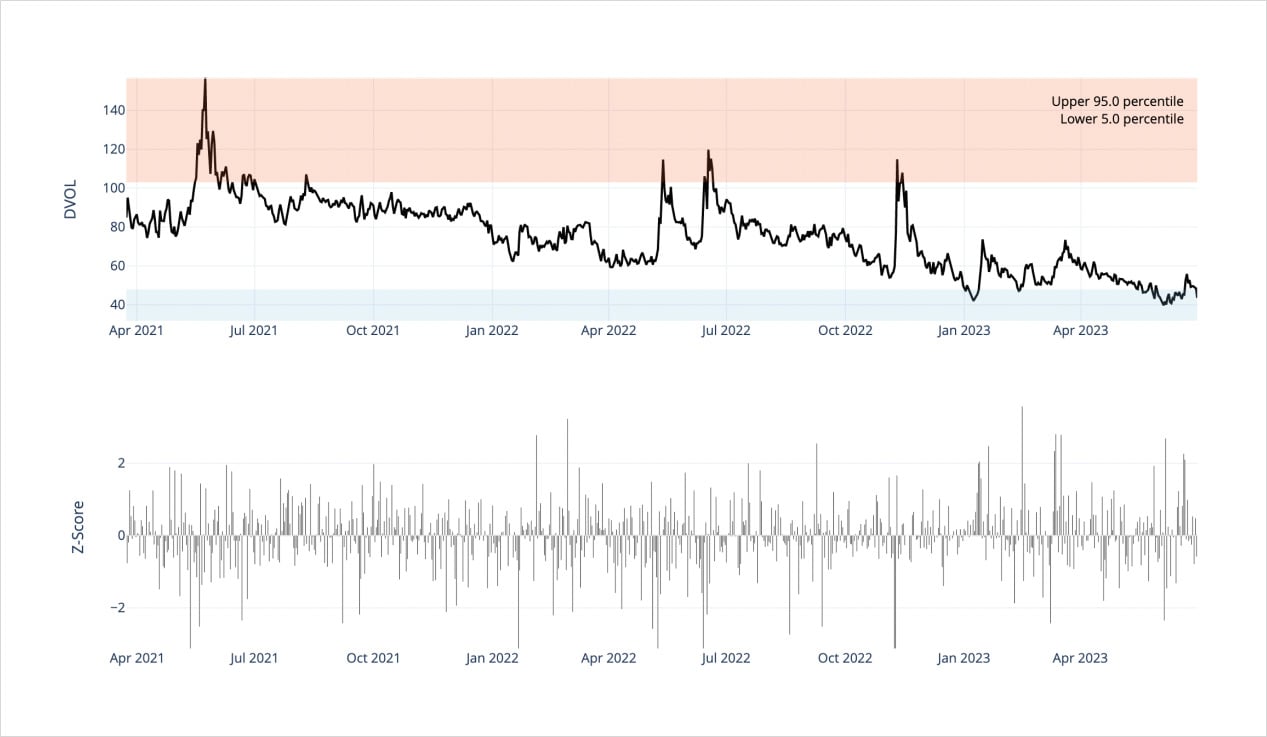
DVOL reads as the value of one annualized standard deviation. However, we can convert this annualized term into a daily value by dividing DVOL by √365. This enables us to compare the daily log-normal returns of spot Bitcoin to the daily standard deviation implied from DVOL.
Setting mean spot returns to 0%, we can calculate the “Z-Score” of observed returns during the day.
Looking at the DVOL chart above, we can see a Z-Score histogram and upper/lower 5% bands to delineate where DVOL resides 90% of the time.
Average DVOL Return by Z-Score Buckets and DVOL Percentiles
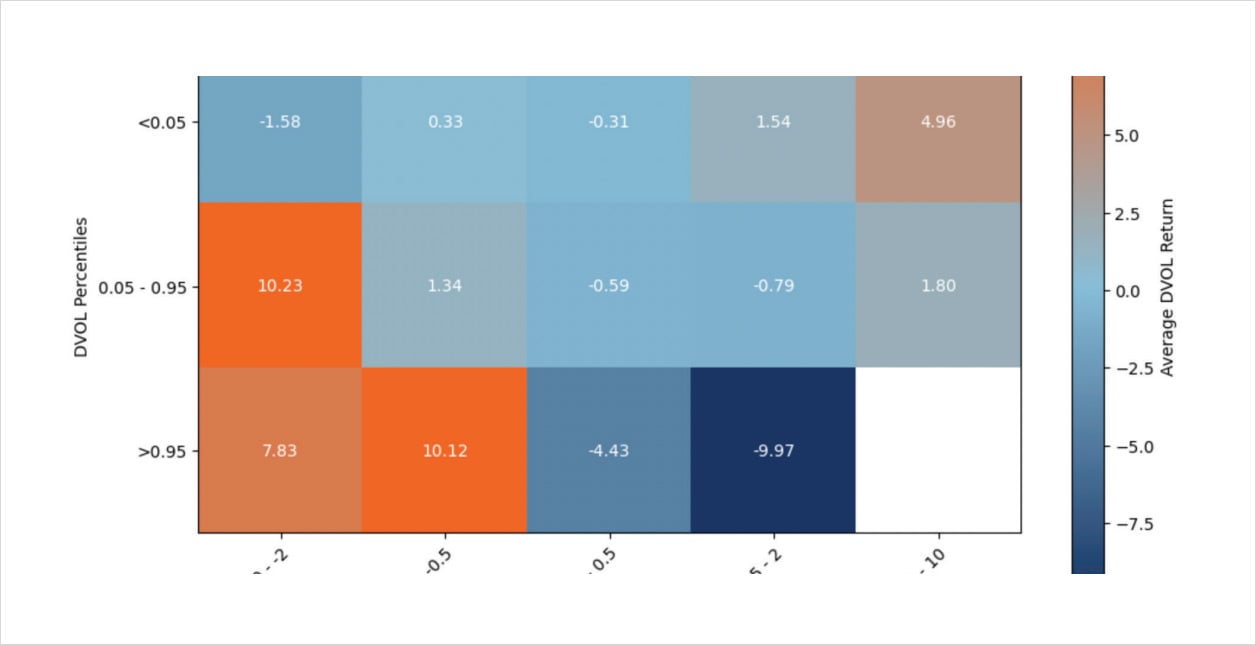
The idea here is to quantify how Bitcoin spot movements “impact” the options market, by measuring the average changes in DVOL resulting from realized volatility, measured by Z-scores.
We not only bucketed the results for different Z-score values, but we’ve also used the upper/lower 5% bands, in order to triage the results outside of the DVOL “extremes”.
Looking at the matrix above we can see some very interesting patterns.
High Vol
First, when DVOL is high, above the upper 95% of values, we can see that further drops in spot raise volatility even higher, while any minor rally quickly drops DVOL by 5-10 IV points.
This makes sense, given that DVOL has historically seen extreme heights as a reaction to major spot price crashes… think Luna, 3AC and FTX.
In these scenarios, traders can use this information intelligently to estimate volatility impacts from a spot price recovery, and structure trades accordingly. (eg: gauging performance of call spreads and back-ratios vs trading an outright call, given the magnitude of a price recovery and the likely impact on IV, etc.).
Low Vol
Another interesting dynamic is the “low volatility” environment, where DVOL is in the lower 5% percentile.
We can see here that large down moves don’t have the same impact on DVOL as other environments. Part of the reason here is that a -2x unit Z-score drop in the lower 5th percentile isn’t as big, given DVOL implied standard deviations are low to begin with.
What’s interesting however, is that a spot price rally seems to quickly attract volatility buyers. We see that given a low volatility environment, like Q4 2022 (post FTX), a recovery in prices brought along a positive spot/vol regime.
Typical DVOL
Most of the time – 90% of the time specifically speaking – the relationship between DVOL and spot prices mimics what we’d expect.
When prices drop by a noteworthy magnitude, we see DVOL react by moving higher while substantial spot rallies can nudge DVOL only modestly higher.
In quiet periods with z-scores bounded by -0.50 to +2, we see about a half-point IV drop in DVOL.
DVOL and Wega
TL:DR – June BTC Wega buying +2x greater than ETH Wega buying.
BTC Z-Scores
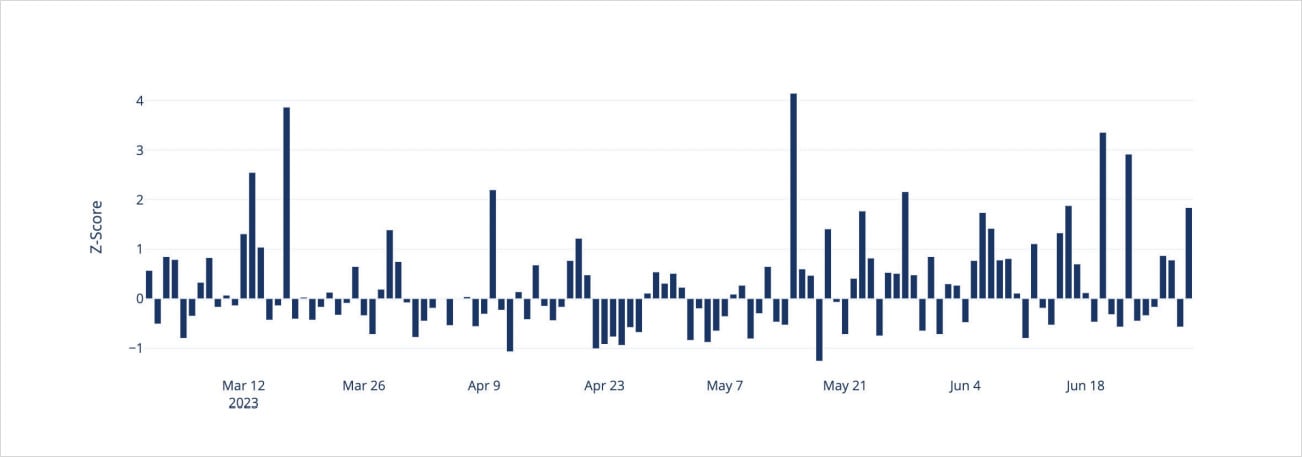
Using our proprietary directional analysis, we can calculate total Wega (30-DTE weighted vega) traded on a daily basis and further convert these figures into Z-score values as well.
We use a 30-day rolling window to calculate the mean absolute value of net Wega and the standard deviation.
Something that clearly stands out in the Q2 2023 flow is extreme levels of Wega buying from aggressors in BTC. We see Wega selling limited to -1.25 standard deviations while we see at least five days of Wega buying above +2.50 standard deviations ; we’ve also included March 2023 to highlight the SVB crisis activity.
Standout dates include mid-March around the SVB banking crises, leading to a lot of Wega buying flows, as well as June 20 and June 23 as BTC prices broke back above $24k -> $30k.
ETH Z-Scores
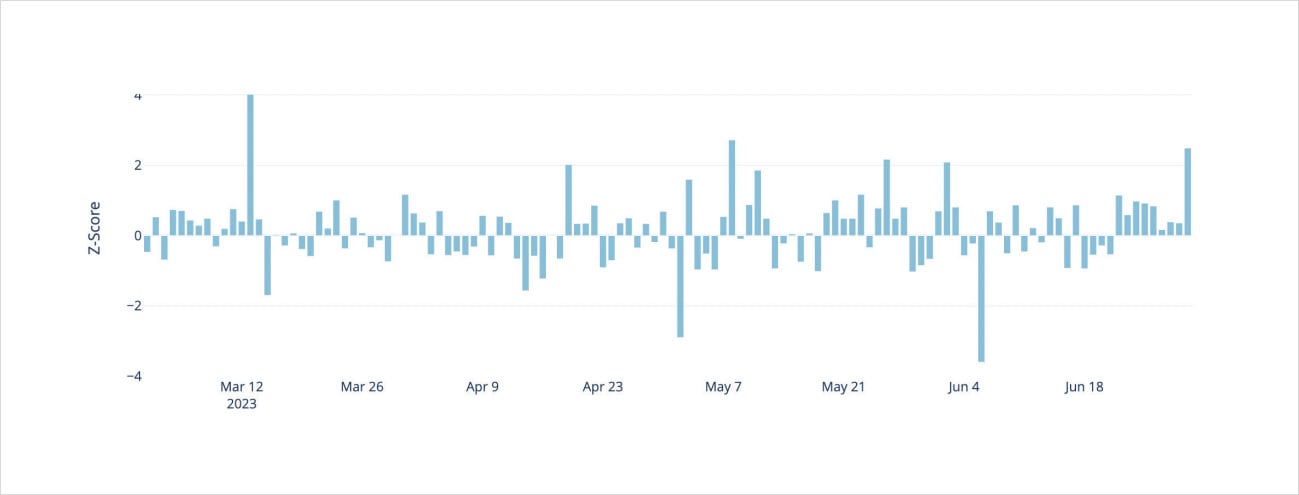
Unsurprisingly, Wega flows for Ethereum showed much more selling, relatively speaking. We see multiple days with Wega flows less than -1.25 by a large margin and only a few days above +2.50.
Both BTC and ETH saw major volatility buying flows during the SVB banking crisis, however.
Mean Wega flow Z-scores for BTC and ETH are depicted in the table below.
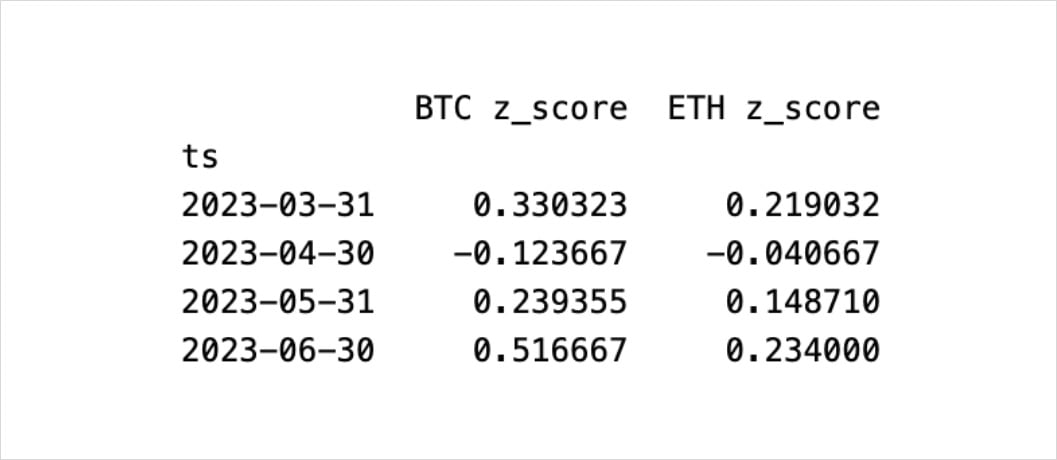
Something to note: much of the ETH call overwriting was executed in long-term quarterly expirations; these have reduced impact when converted to 30-DTE Wega.
Wega Impact on DVOL
BTC DVOL Impact on Wega
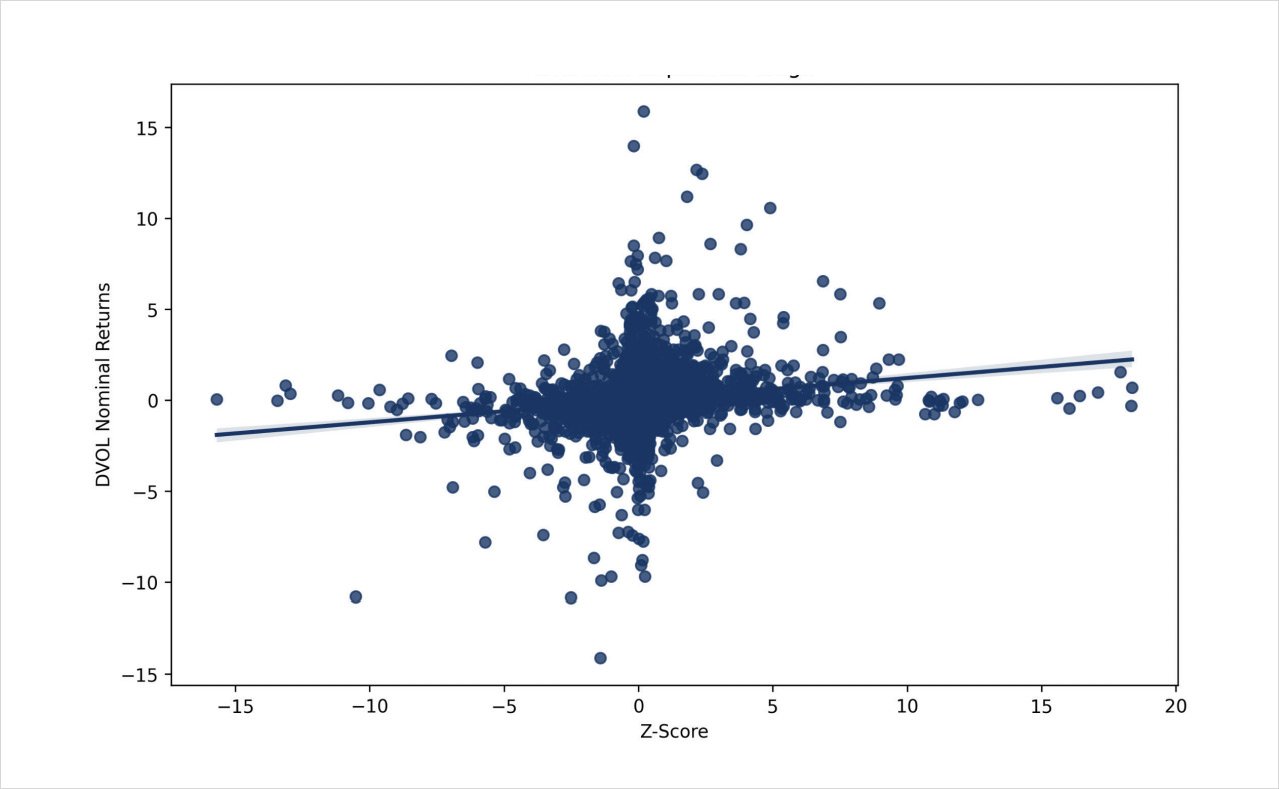
This leads us to our next avenue of inquiry, how do Wega flows impact DVOL?
First, when looking at the impact of Wega flows onto the value of DVOL, it makes much more sense to review hourly data. This is because Wega flows impact prices near execution, but these effects fizzle as time passes and subsequent realized volatility paths can override the effects for flow.
Another important note about this visualization is that a lot of noise exists around the Z-Score 0-line. This can be explained by the lack of flow impacting DVOL values, and DVOL moving around for other reasons. We notice a symmetry here.
What’s promising is the positive correlation we see between Wega flows and the value of DVOL. Notice that large Z-scores +/- 2 standard deviations have over +/- 0.50 IV impact, while Z-scores below the absolute value of 0.50 have nearly no impact on DVOL.
Overlaying flows with other indicators can help discretionary traders and market-makers make informed decisions.
DVOL Curvature
Butterfly Index Ratio: High and Low Percentages
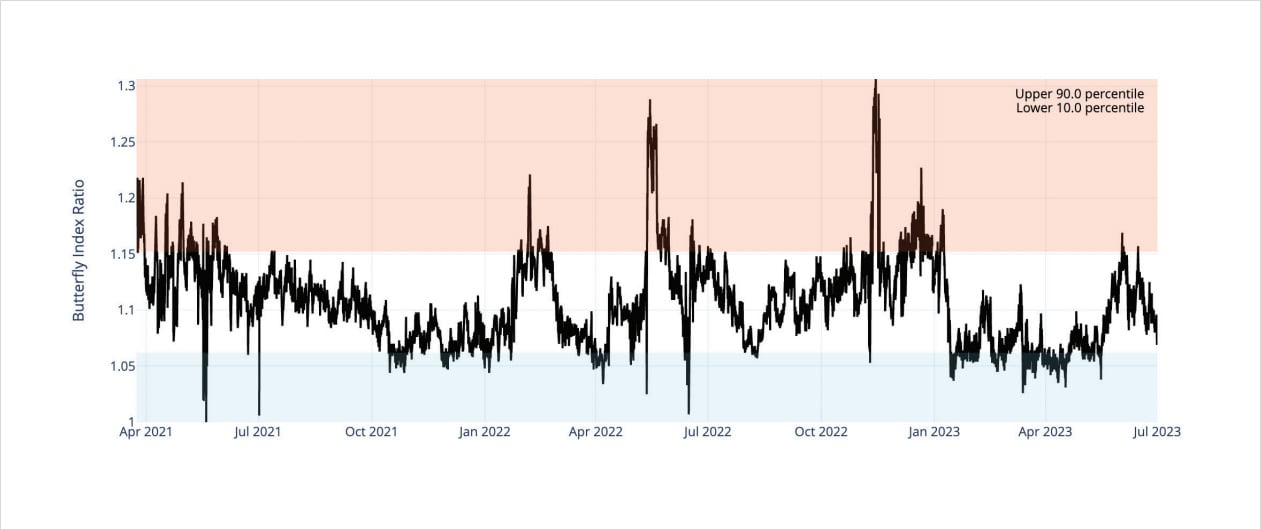
One of the most attractive components of Deribit’s DVOL index is that it incorporates option prices all along the skew.
Except for options with a delta smaller than the ABS(Δ5) cutoff, all other strikes are included in the calculation of the DVOL index. This means that the index value of DVOL includes the components of skew “curvature”
One interesting feature we built, here at Amberdata Derivatives, is the ratio of DVOL index value to 30- DTE ATM volatility.
This attempts to quantify the curvature value of the DVOL Index. We’ve also identified the extreme values of this relationship by imposing an up 90% percentile and lower 10% percentile bands.
One can imagine a scenario where the market is in a panic and traders buy “wing” options as insurance (such as the FTX meltdown). In this case, the “Butterfly Index” would peak, as the convexity of DVOL becomes extremely rich as wings are bid higher.
Another important consideration of this ratio index, is that because DVOL targets constant “vega exposure”, different strikes will have different weights.
Lower strikes will have a heavier weight, while higher strikes will have a lower weight; this causes DVOL curvature (and therefore the “Butterfly Index”) to carry an implicit “put bias”. This bias is heavily mitigated by the ABS(Δ5) cut-off, but exists nonetheless.
Butterfly Index Trading
Now that DVOL futures exist, traders can theoretically trade this type of index, at least imperfectly.
Traders can buy a straddle with about 30-DTE and sell the DVOL future against it, hedging 1-to-1 with a dollar-vega weighting scheme (or vice-versa). Ultimately, the goal is to isolate the curvature of DVOL and bet on the mean reversion.
This type of trade has complications, however, due to the shifting DTE of the straddle and the nonconstant Vega exposure straddles, as they become ITM (path dependency).
The path dependency would likely carry a bullish bias, when short the DVOL futures, since a market crash would spike IV higher, increase curvature and cause the straddle vega to diminish at precisely the wrong time, as it goes ITM (unfavorable path dependency).
If prices rallied, however, IV would likely drop lower, and your straddle vega would be reduced at precisely the “correct” time, as the straddle becomes more and more ITM (favorable path dependency).
Lastly, one final compilation is the current limitation for cross-margin around BTC options and DVOL futures trading.
Nonetheless, we’re excited for this new product launch and look forward to observing the adoption of DVOL futures.
Disclaimer
The information contained in this report is provided by Amberdata solely for educational and informational purposes. The contents of this report should not be construed as financial, investment, legal, tax, or any other form of professional advice. Amberdata does not provide personalized recommendations, and any opinions or suggestions expressed in this report are for general informational purposes only.
Although Amberdata has made every effort to ensure the accuracy and completeness of the information provided, it cannot be held responsible for any errors, omissions, inaccuracies, or outdated information. Market conditions, regulations, and laws are subject to change, and readers should perform their own research and consult with a qualified professional before making any financial decisions or taking any actions based on the information provided in this report.
Past performance is not indicative of future results, and any investments discussed or mentioned in this report may not be suitable for all individuals or circumstances. Investing involves risks, and the value of investments can go up or down. Amberdata disclaims any liability for any loss or damage that may arise from the use of, or reliance on, the information contained in this report.
By accessing and using the information provided in this report, you agree to indemnify and hold harmless Amberdata, its affiliates, and their respective officers, directors, employees, and agents from and against any and all claims, losses, liabilities, damages, or expenses (including reasonable attorney’s fees) arising from your use of or reliance on the information contained herein.
Copyright © 2023 Amberdata. All rights reserved.
AUTHOR(S)
THANKS TO
Greg Magadini – CFA, Fabio Bassani, Tony Stewart, Euan Sinclair, and Samneet Chepal – CFA
