

Historically, Ethereum and Bitcoin were always correlated assets, which means that they usually move in the same direction most of the time. However, due to differences in market cap size, Ethereum has always been a more volatile asset, specially when compared to Bitcoin.
Nonetheless, since September 2022, a new pattern seems to be taking place. Ethereum and Bitcoin volatilities have been crossing each other more frequently than over the last 3 years. Also, the log-return differences of these two assets have become tighter.
This article will explore this new trend and how you as a trader can take advantage of this uncommon scenario.
Let’s explore a Long/Short strategy, because it’s the most suited strategy for this moment. Long/Short basically consists in betting that the returns of two or more correlated assets will converge. For instance, in the picture below you will see the returns of Apple stocks (Blue line) and returns of Amazon stocks (Orange line).
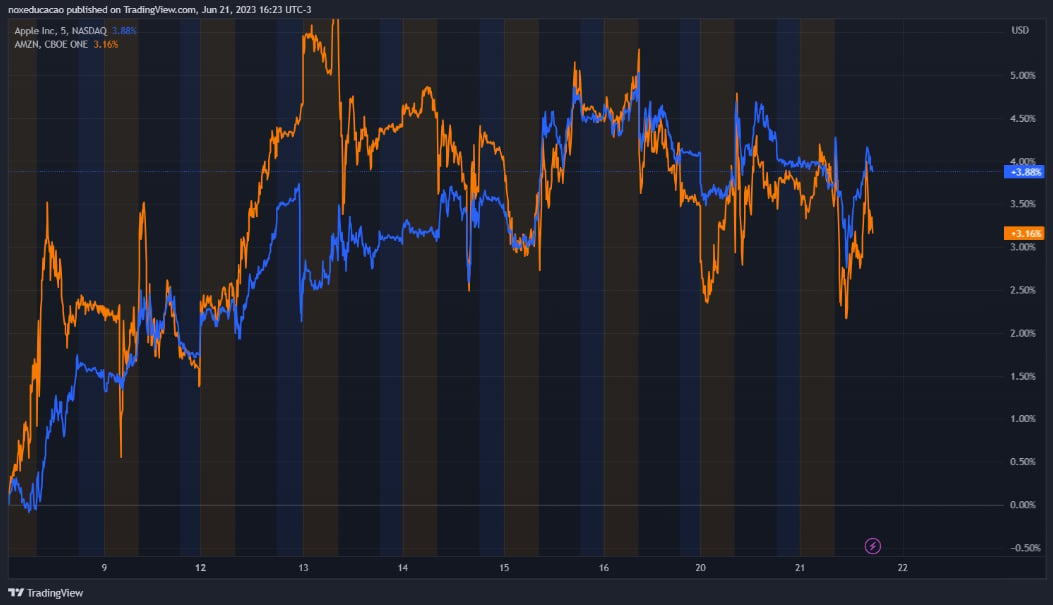
Sometimes AAPL performs better than AMZN and vice versa. To exploit this, you short AAPL and long AMZN stocks. Analogously, we can use the same logic with different assets.
If you want to trade this strategy the two assets must be:
- from the same economic sector;
- historically correlated;
- cointegrated;
Cointegration, simply put, is a test that we must perform to know if historically the difference between the returns of these two assets, tends to regress to the mean. For instance, Bitcoin and Litecoin are correlated but not cointegrated. It means that if you bet in Litecoin against Bitcoin, your bet will not succeed overtime.
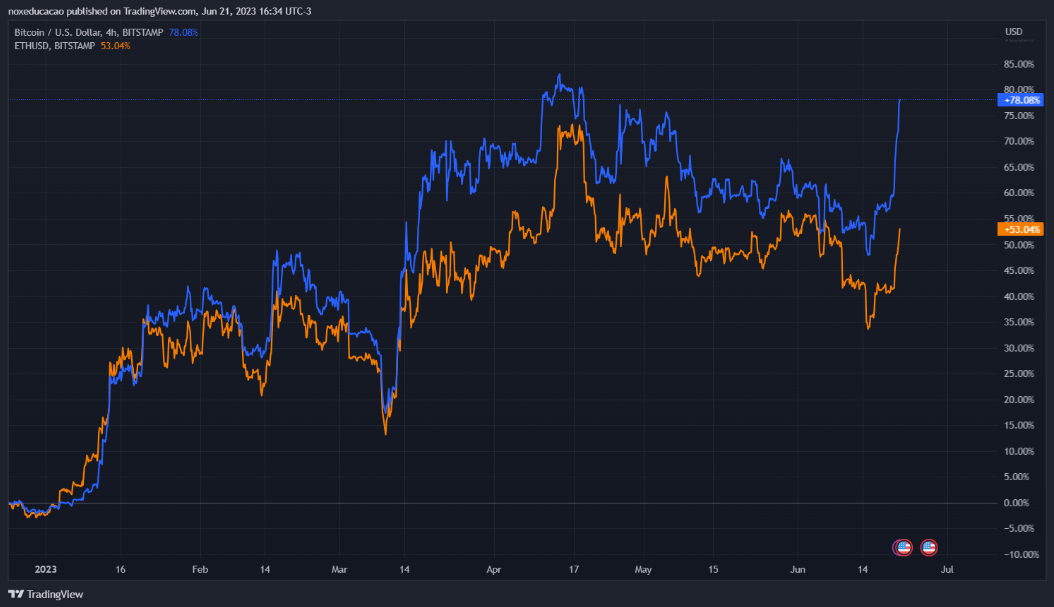
So what’s happening is that Ethereum remained quiet while Bitcoin experienced more volatility and it created a perfect Long/Short setup. Bitcoin has been systematically beating Ethereum over the year of 2023. However, in some windows, the assets converge again. In order to exploit the “spread” between these two assets we must confirm the opportunity.
There’s a huge literature that covers this strategy and the most common methodology will be used:
- Measure the correlation between two assets;
- Run a linear regression of ETH vs BTC;
- Measure the beta between these two assets;
- Measure the average of residual;
- Do a cointegration test;
- When residual reaches 2 standard deviations, you trade it.
In short and explaining the 5 points above, you assume that ETH is actually BTC and the linear regression will be the model that explains that. The residuals are what your model can’t explain. The cointegration test is a check to say “ok, the residuals are too high but they will soon revert back to normality”.
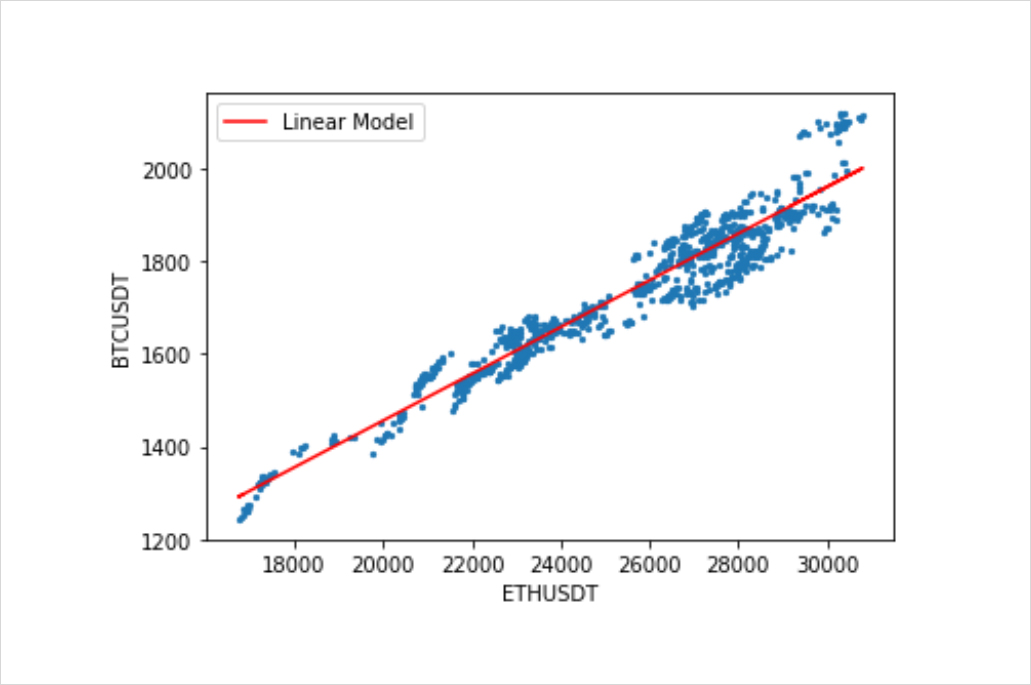
At the time of writing, ETH and BTC have a correlation of 0.96, which is quite high. Additionally, in the picture below you can see the linear regression of ETH and BTC (the higher the amount of blue dots around the red line the better). If they are spreaded out, it means you can’t say that there’s a clear correlation. Finally, the angular coefficient of this model is 0.0506, which means that 1 Eth is 0.0506 BTC, which is also your Beta. You will use this proportion in your long/short.
Now we must account the residuals and take the mean and standard deviation of this time series. Thanks to statsmodels lib and python everything becomes faster with a few lines of code. On the plotted chart below, you can see the two blue dotted lines (representing the standard deviations) and the residuals going up and down in between. This shows that ETH is heavily undervalued against BTC.
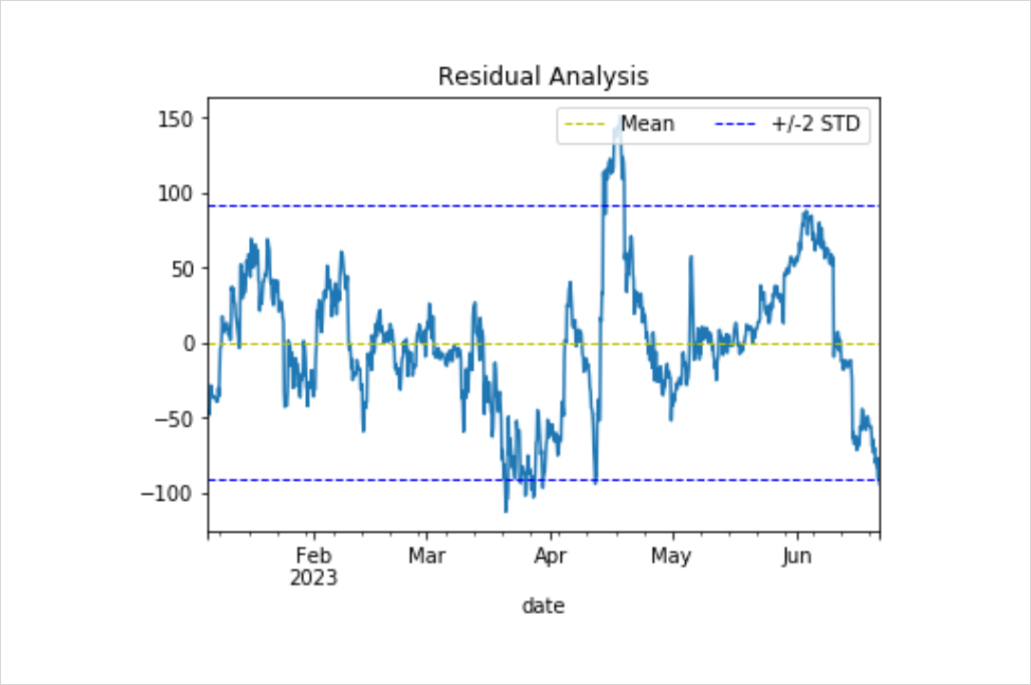
Also, we perform a cointegration test of these residuals. In this case, we can say that there’s a 96% chance of ETH and BTC being cointegrated, which means that you can trade this pair. When residuals cross the blue line, that means a very rare situation where one asset is overperforming the other in two standard deviations.
So, provided of good statistical information based on historical data, it’s possible to say that it is safe to SHORT 0.05067 BTC and LONG 1 ETH using futures contracts or options. Futures contracts are better for its simplicity and they can even share margin when done in cross-margin using USDC contracts at Deribit.
There’s a good opportunity for doing double-arbitrage here as Ethereum remained quiet while Bitcoin was experiencing higher volatility. As previously mentioned, ETH has always had higher volatility because of its smaller market cap when compared to BTC.
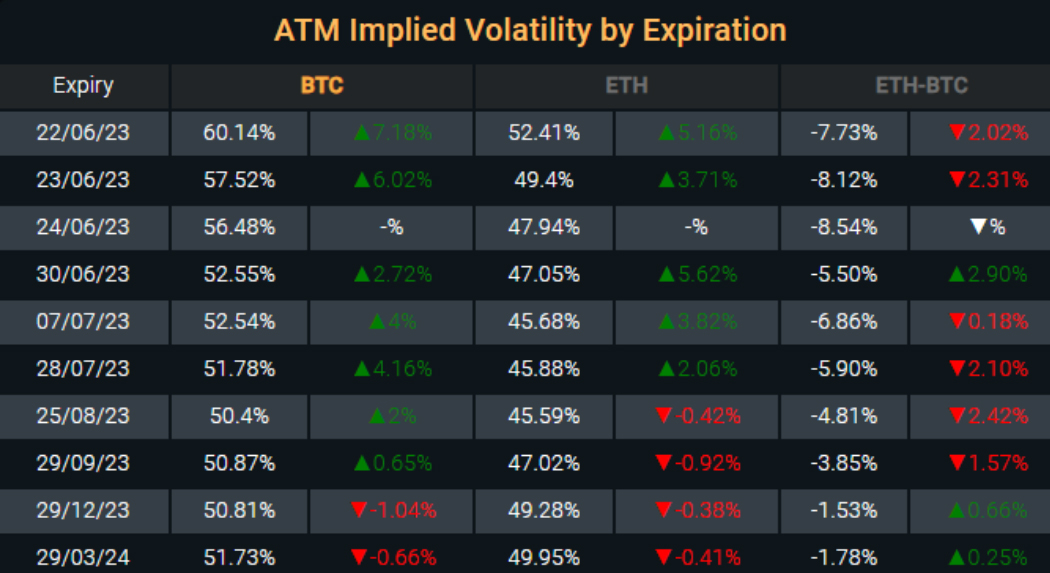
Thus, ETH volatility is currently lower than BTC, and it’s causing the ETH options to become cheaper than BTC options. The table below shows the ETH-BTC volatility in “backwardation”.
It’s possible also to adopt different strategies to exploit the difference between these assets’ returns and volatilities: Straddles, Strangles, Calls and Puts.
In order to exploit the “spread” of vol and assets returns, one good trade here is going LONG 1 ETH delta-25 Calls while going SHORT 0.0506 BTC delta-25 Calls for 07/07/23 expiry (most discounted ETH-BTC). In the time of writing these are the strikes:
- Short 1 BTC 33000-C 07-JUL-23 (Credit of $553.00)
- Long 10 ETH 2000-C and 10 ETH 2100-C (Debit of $497.00)
- (20 options of ETH = 1/0.0506)
You’d make around USD 50 per BTC but having an interesting scenario of being prepared for ETH outperforming BTC in the case of a short-term rally. In order to exploit only the volatility of these two assets you may want to use longer dated options and a straddle, in this case you’d be only trading cross-asset volatility.
Talking about risks, there’s always the fat tails events that can compromise the trade. For example a bug that compromises Ethereum, a new “The Dao” case, etc. These events can make the spread between the assets so high that they can become uncorrelated and un-cointegrated causing severe damages to your portfolio.
So, be careful about the sizes. Looking at historical data can provide amazing insights but we’re always looking for the past in order to find better present answers.
To conclude, this is a rare scenario. Historical data suggests that we may find a mean reversion soon and options can be a good tool to perform double arbitrage (statistical and volatility). This strategy is commonly used in equities markets and they also fit in crypto markets.
AUTHOR(S)
An intuitive platform and a team committed to facilitating your access to the best opportunities in the crypto market. Learn more about Nox Bitcoin here.