
The price of Ethereum has been in the range of 1880 USD for days, along with the lateralization of Bitcoin. The cryptos with the largest capitalization in the market are waiting for the reaction of their older brother.
For this, it is good to know the possible areas of interest and rebound for ETH price. In figure 1, we see the Liquidation Heatmap graph for ETH in 1-Day candlesticks, which shows us the different Liquidation Pools that the price was liquidating and those that are pending liquidation.
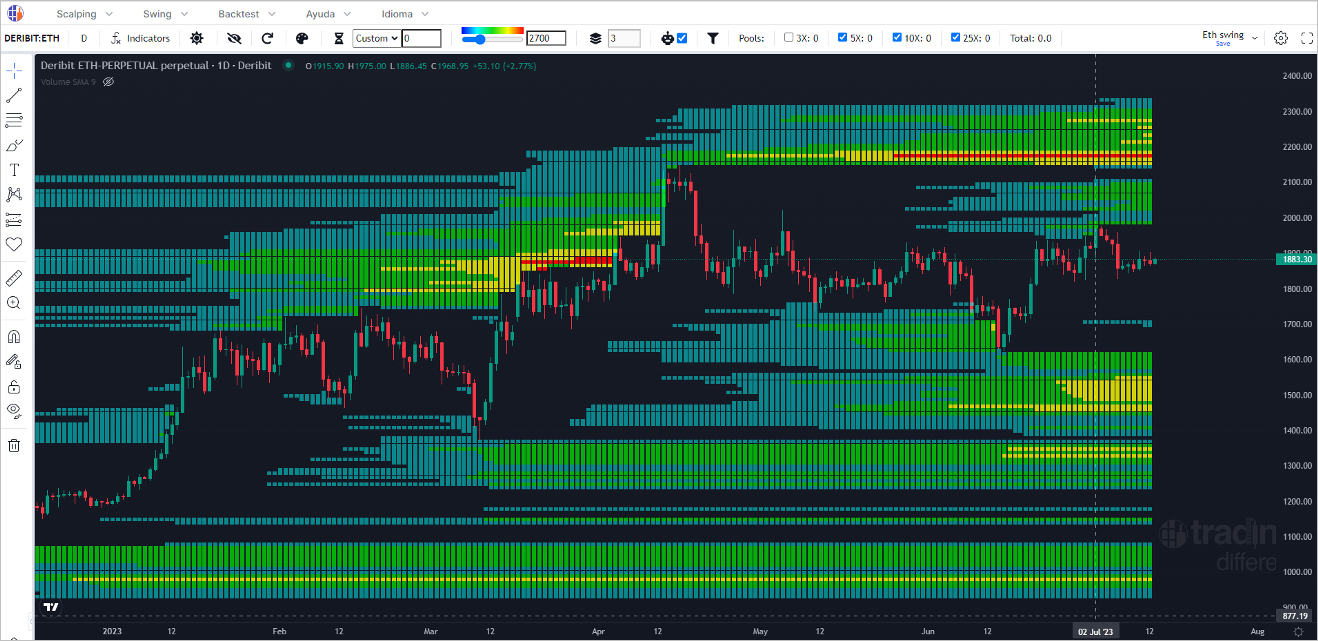
Figure 1
The Liquidation Heatmap graph shows us the Liquidation Pools, which indicate, through a mathematical algorithm, where all traders who enter the market over-leveraged could lose. This algorithm, developed by the Trading Different team, shows us where the price would be most likely to go, forced by high-frequency bots. These high-frequency bots take advantage of market failures, force the price in one direction, and use Stop Loss zones and Liquidation Points to close out their large-volume winning positions.
If we look at July 2nd, we see that the price reached USD 1975, liquidating part of that Pool, but was unable to do so completely. When we see this type of pattern, we interpret that real Spot Sale is entering and does not allow high-frequency bots to manipulate the price to finish absorbing that liquidity.
Currently, the remainder of that Pool was joined with the Pool above, forming a single liquidity block up to 2100 USD. This liquidity is increasing as the days go by, and it will serve as fuel to see ETH go back above USD 2,000, but we will need BTC to accompany it upwards to make it possible.
At the moment, the high-frequency bots in Bitcoin continue to operate bullisj. In order to observe how the bots operate in real time, it is important to have the High Frequency graph (figure 2). It shows the Buy and Sell trades that enter the market, at the millisecond level. In this way, the algorithm identifies the bots and translates it into an HF indicator.
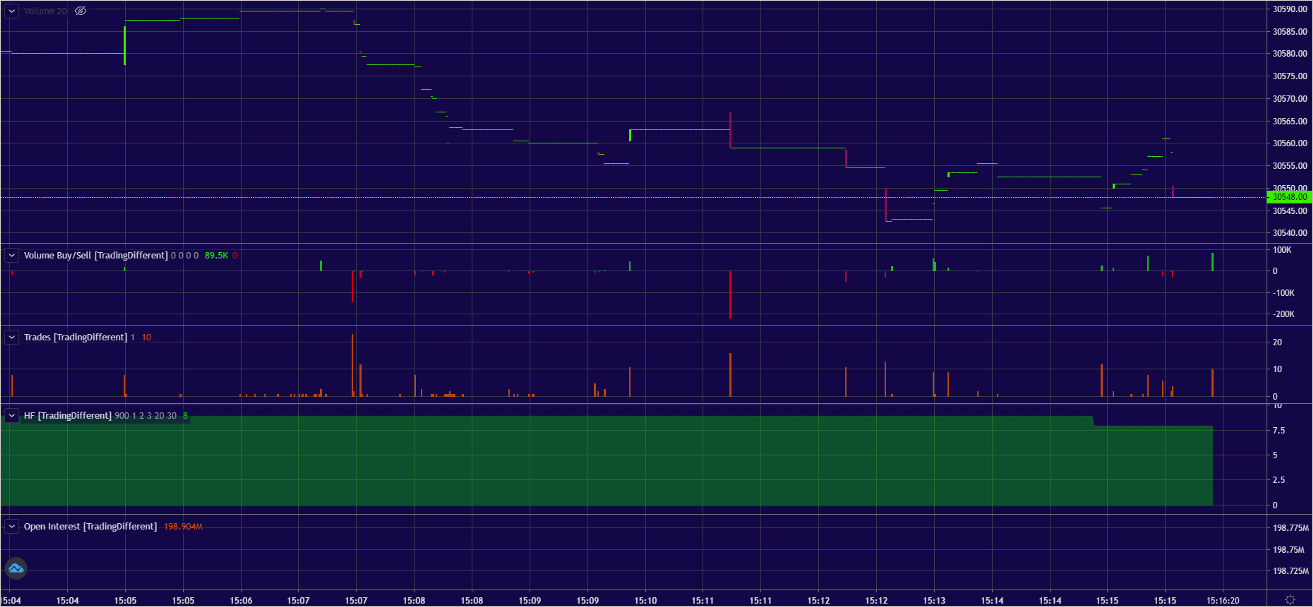
Figure 2
Try for Free the Liquidation Heatmap and the High Frecuency Graph here.
AUTHOR(S)
Trading Different, provides traders with unique tools and indicators in the crypto ecosystem, making their trading systems more efficient. Our Liquidation Heatmap indicates, through a mathematical algorithm, where all the over-leveraged traders lose based on their liquidation points and their Stop Losses. Learn more about Trading Different here.