

Decentralized finance (DeFi) had a breakout quarter in the summer of 2020. Value locked in DeFi protocols grew to $11 billion in October from $2 Billion in July and several DeFi tokens appreciated by 5-10x+ throughout July and August. Since September, though, DeFi token prices and protocol metrics have diverged significantly with tokens retracing by over 50% despite value locked continuing to grow. This divergence is likely due to a shift to a risk-off environment as investors decided to book profits and became cautious of high supply inflation for tokens of a space that is still in its early days.
Source: IntoTheBlock’s DeFi Insights
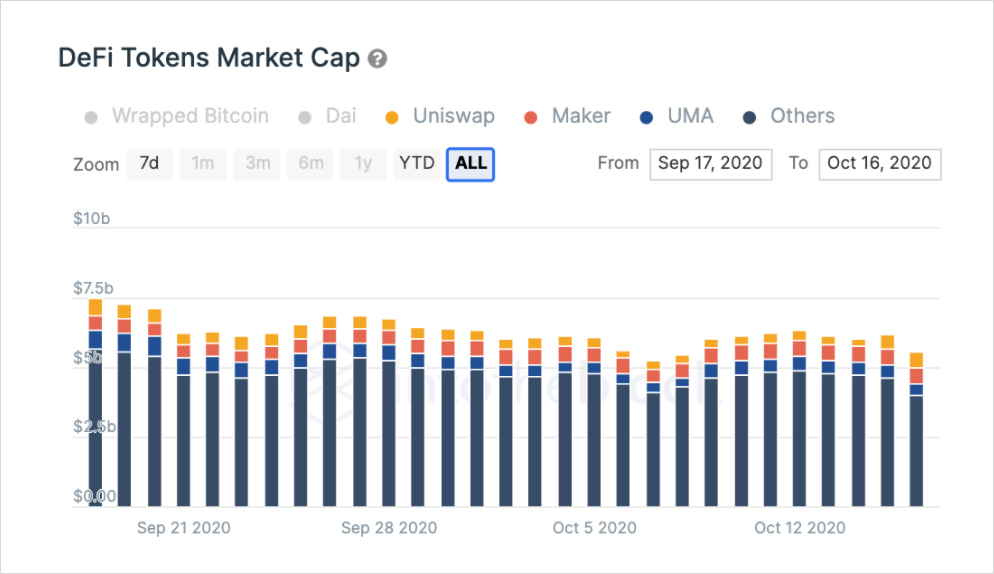
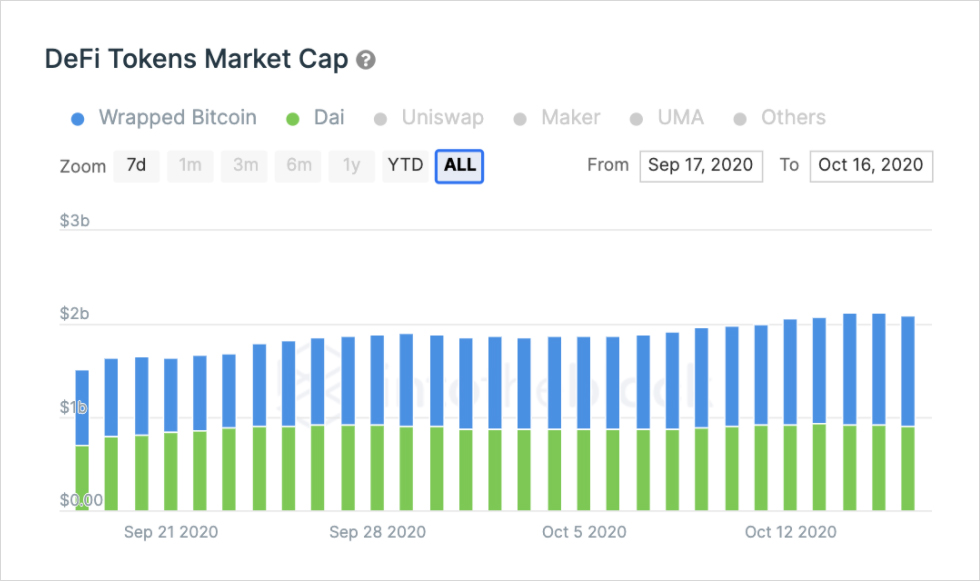
In aggregate, DeFi governance tokens in Ethereum have declined by approximately a third from $7.5 billion to $5.07 billion just in the last month. At the same time, stablecoins and tokenized versions of Bitcoin have managed to continue growing in terms of market capitalization.
Source: IntoTheBlock’s DeFi Insights
This contrast denotes the shift to a risk-off environment with traders shifting out of governance tokens into less volatile yield-generating assets. Moreover, it appears that the catalyst for DeFi’s initial boost may also be behind its crash. While liquidity mining (aka yield farming) is not a new phenomenon, Compound’s COMP mining in mid-June is largely accredited as the point of inflection igniting DeFi’s explosive growth.
Since then, hundreds of protocols and forks have launched their own yield farming schemes, becoming the leading approach to simultaneously attract liquidity and distribute governance tokens. Initially, protocols managed to see both token prices and liquidity supplied grow, but things quickly changed as the market started crashing in September. Governance tokens, particularly those with high rates of inflation through liquidity mining, have retraced considerably since.
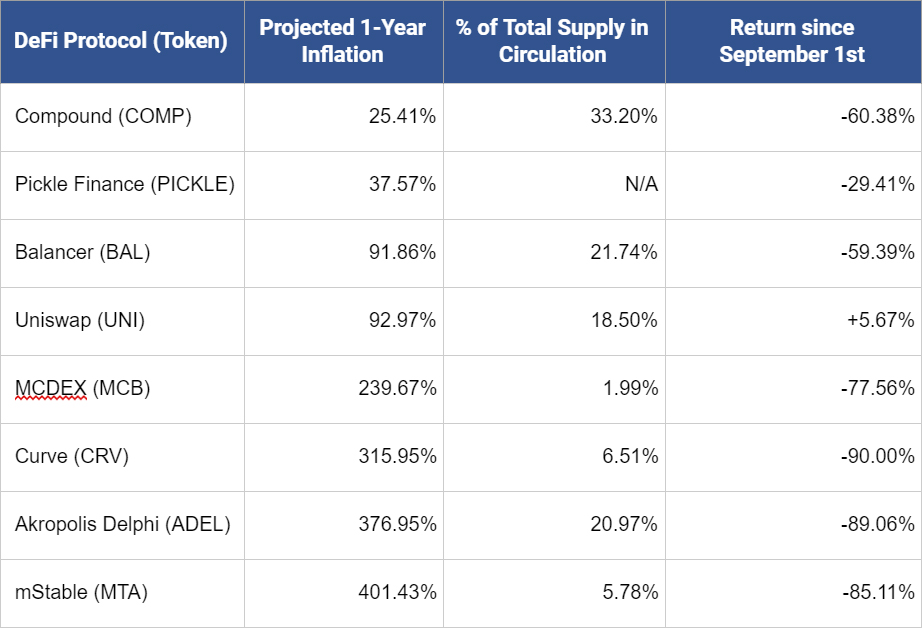
A non-exhaustive list of DeFi tokens with current yield farming programs as of October 19, 2020
Source and methodology: IntoTheBlock
As can be seen from the table above, DeFi tokens with 1-year inflation above 100% have crashed by at least 75% since September 1. Similarly, tokens with a low percentage of total supply in circulation have declined stronger than those with a higher percentage of supply in circulation. Though this is a relatively small sample size, the correlation between 1-year inflation and price change since September 1 is -0.73, indicating a strong inverse relationship between the two. Overall, this demonstrates that while liquidity mining can fuel supply-side demand, it can also lead tokens to suffer from setbacks akin to depreciation arising from hyperinflation. DeFi protocols seem to have realized this with projects such as Compound and Pickle reducing their supply emission.
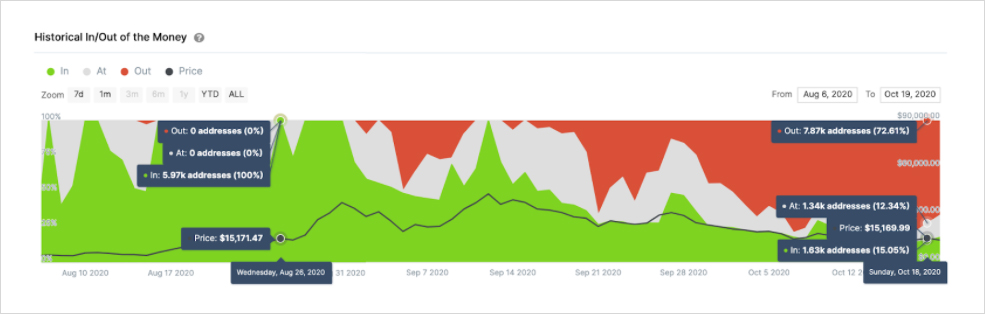
Asides from the high inflation rates, to those that have been in crypto long enough, it may come as no surprise that tokens that rise 10-20x in price tend to subsequently correct by 60-80+%. This is due to natural market forces and profit-taking. By comparing the number of addresses making profits at a certain price level, we can estimate that DeFi token holders have been closing their positions. By using IntoTheBlock’s Historical In/Out of the Money, it is evident that fewer holders are profiting at the same price level before the crash.
Source: IntoTheBlock’s YFI financial indicators
The image above shows that the number of YFI holders in the money, or profiting on their positions, at a price of $15,170 declined from 5.97k to only 1.63k. This points to the likelihood that addresses were profiting on paper decided to realize their gains while prices were higher. Other governance tokens such as SNX, LEND and UMA display the same pattern. Ultimately, this highlights how investors opted to take profits and close their positions following the parabolic rally in DeFi tokens.
It is normal for nascent markets such as DeFi to go through these types of price swings, especially in the crypto space. Put in context, DeFi tokens on Ethereum are still minuscule: they currently account for 1.39% of the $365 billion total crypto market cap. In terms of the number of holders, DeFi tokens capture an even smaller share of the market.
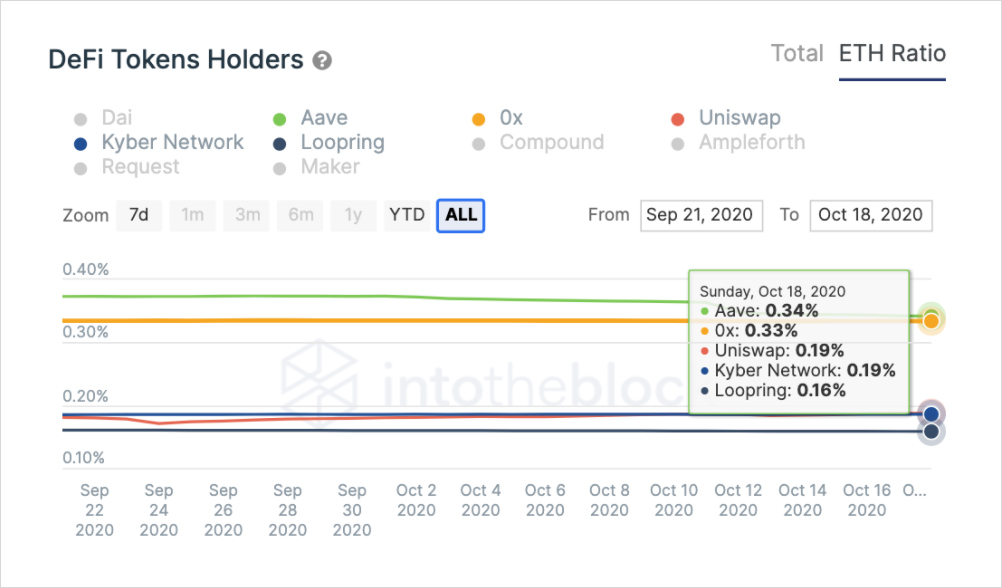
Source: IntoTheBlock’s DeFi Insights
Currently, Aave (LEND) has the highest percentage of ETH addresses holding it, despite going through a token migration process. No single DeFi token manages to reach 0.5% of Ethereum addresses. This suggests that DeFi tokens are still far from reaching even a significant amount of holders within Ethereum, pointing to space still being in its early stages.
Despite the crash in token prices, DeFi continues to move forward. With protocols such as Synthetix testing layer 2 solutions for greater scalability, precedents to mass adoption are being built. Along with this, progress in Ethereum 2.0 points to a more robust infrastructure for decentralized financial services being almost ready.
While DeFi may currently be negligible in comparison to broader crypto markets (not to mention traditional markets), this points to its potential room for growth. There is no denying that investor expectations got ahead of themselves as token prices took off during July and August. DeFi tokens have since retraced as investors became wary of high inflation and decided to book profits amid a broader risk-off environment. Ultimately, these volatile price swings are characteristic of a nascent space with high potential. As the market settles, prices and hype may fade, but the building blocks of a decentralized financial system continue to be set into place.
Lucas Outumuro
Senior Analyst at IntoTheBlock
AUTHOR(S)
We are a data science company applying cutting-edge research in AI to deliver actionable intelligence for the crypto market.