

As open interest continues to grow in the crypto currency option space, last Friday’s expiration was the biggest we’ve seen to date.
Deribit can proudly boast of $1.4 BILLION in notional open interest across its products, about 50% of which expired on June 26, 2020 at 8:00 AM UTC.
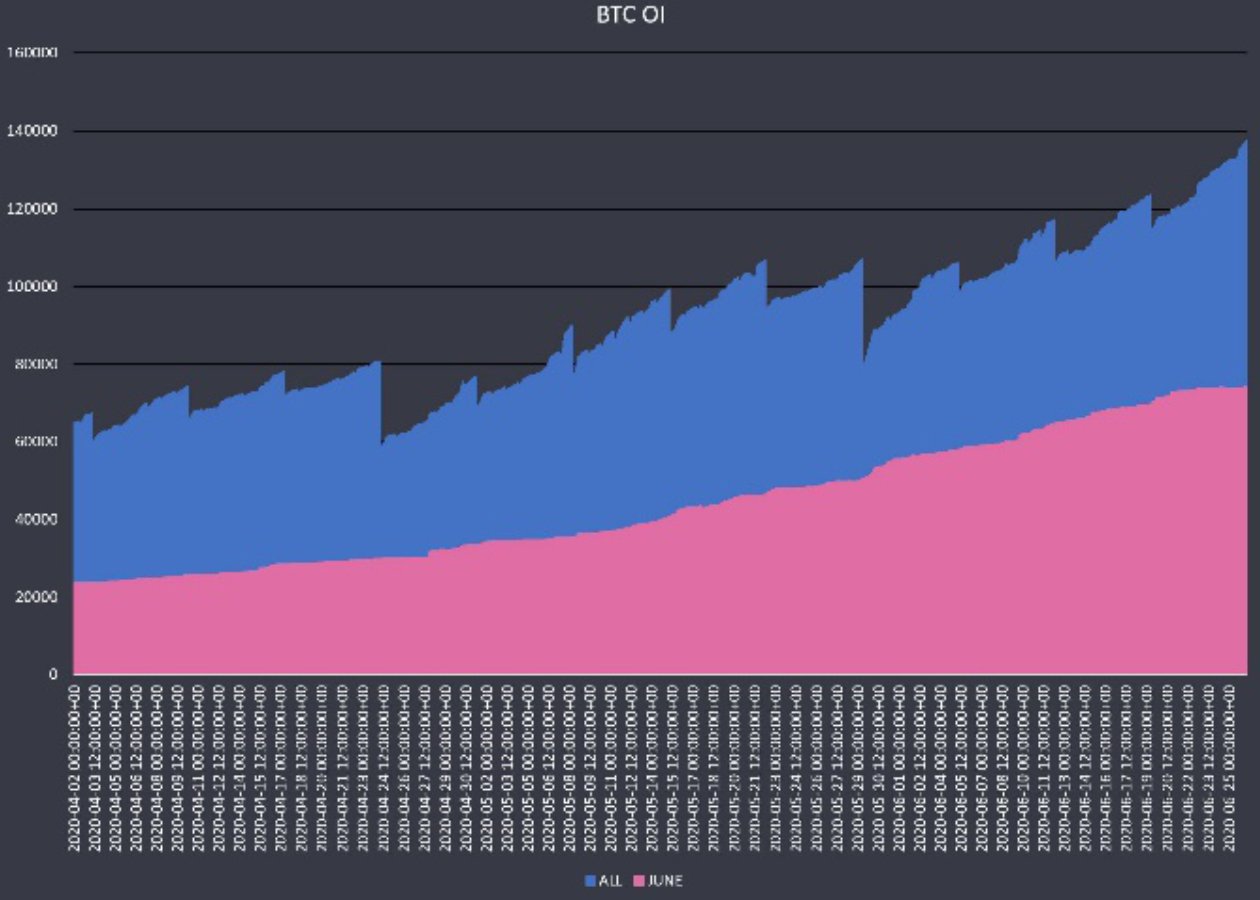
(BTC Total OI vs. June 26th OI)
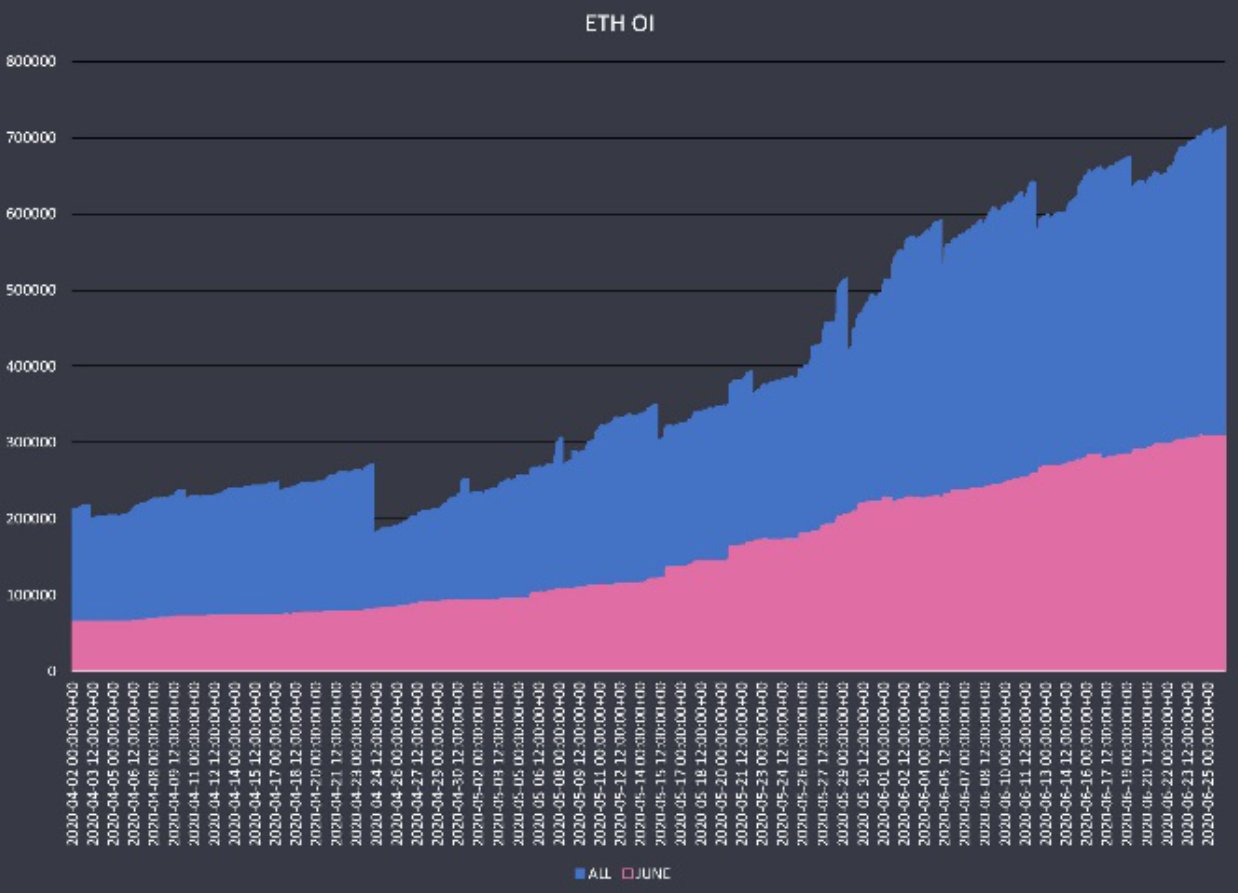
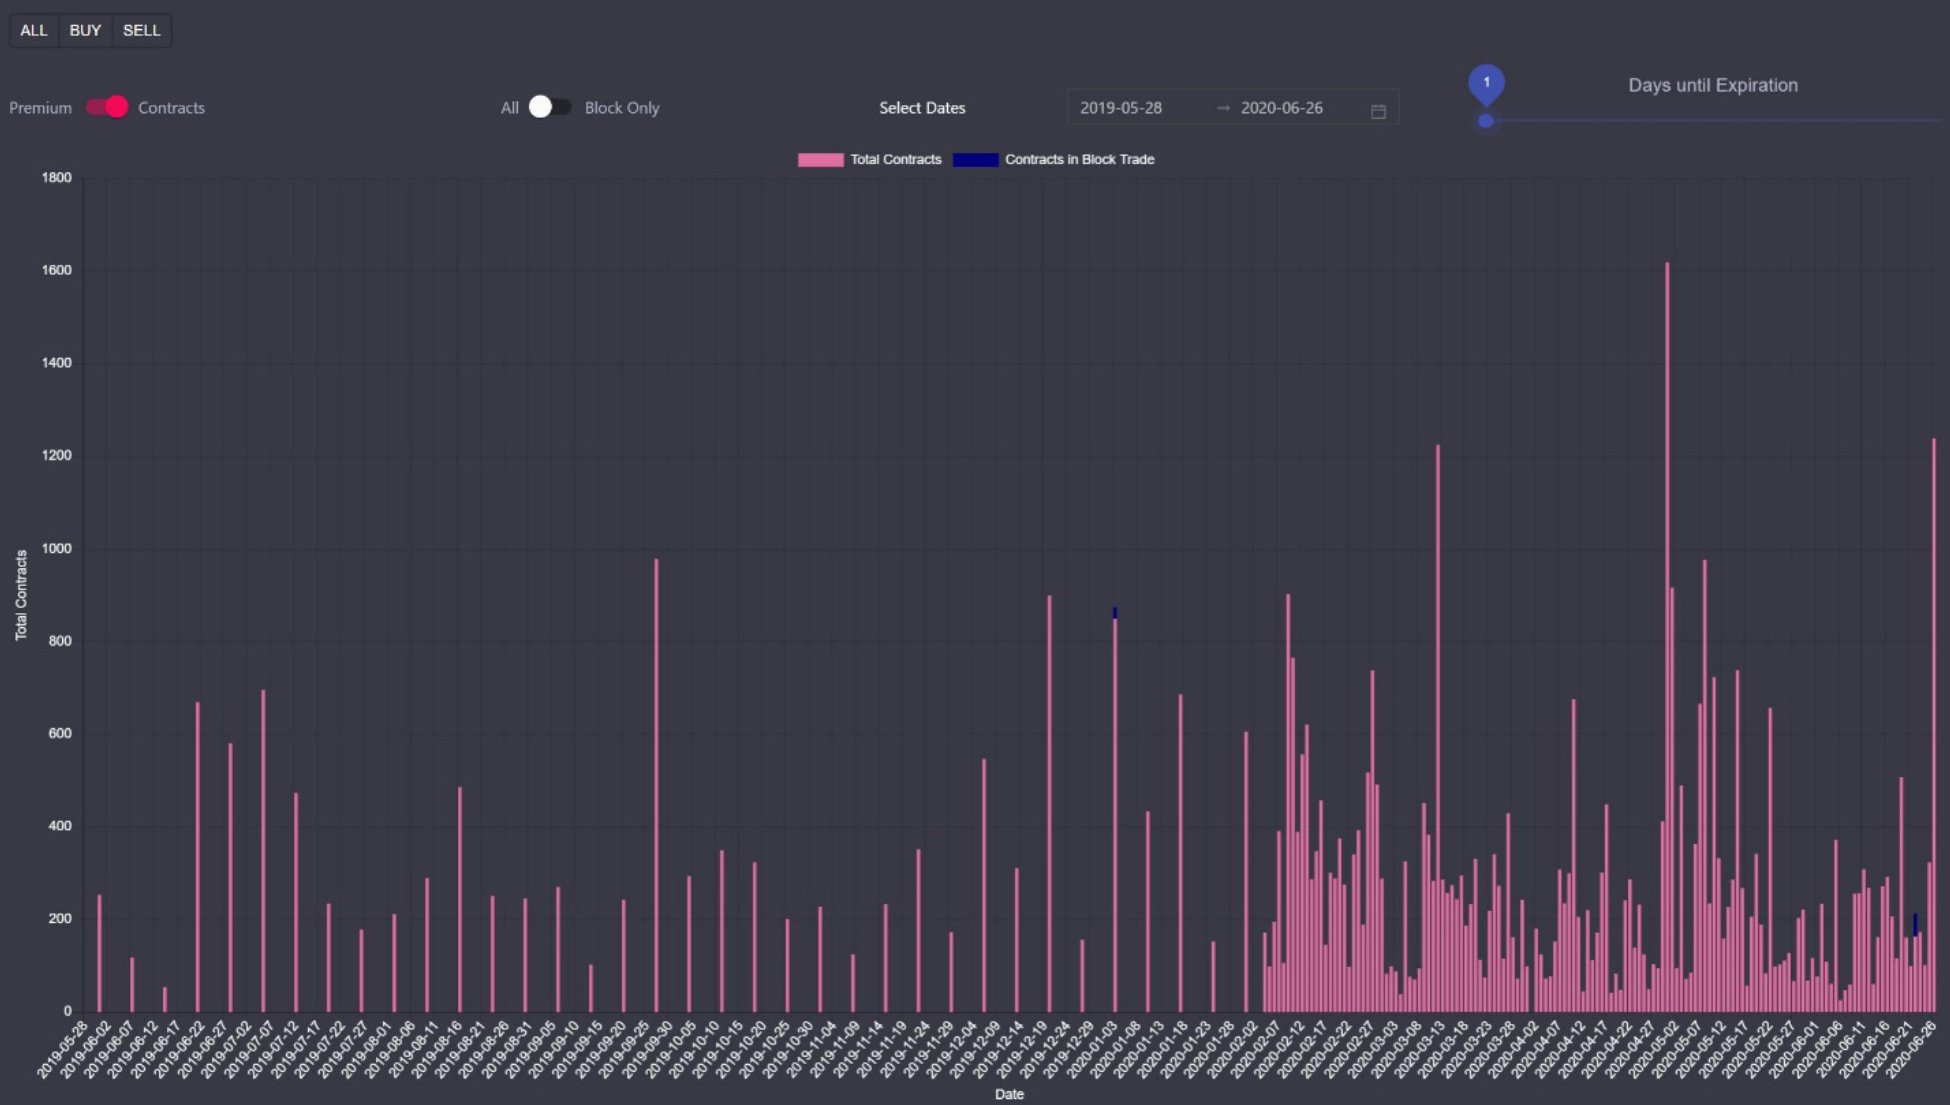
(ETH Total OI vs. June 26th OI)
What does this mean? How do large OI expirations affect markets? Do OI expirations create volatility or not?
These are common questions I hear from option traders and market participants all the time. We at Genesis Volatility love working with Deribit data and using it to answer these types of questions. Let’s dig deeper.
Do OI expirations create volatility and is this volatility realized or implied?
As many of you already know, option gamma is going to be highest for ATM options near expiration.
This is no surprise, since under these conditions, any move in the underlying for these options could quickly flip a near 0 delta option to a near 1.00 option. This gamma flipping becomes exponentially more important with extremely large OI expiration events.
It is common to see an IV bump during these events when large OI lingers in an ATM strike, like we saw in ETH.
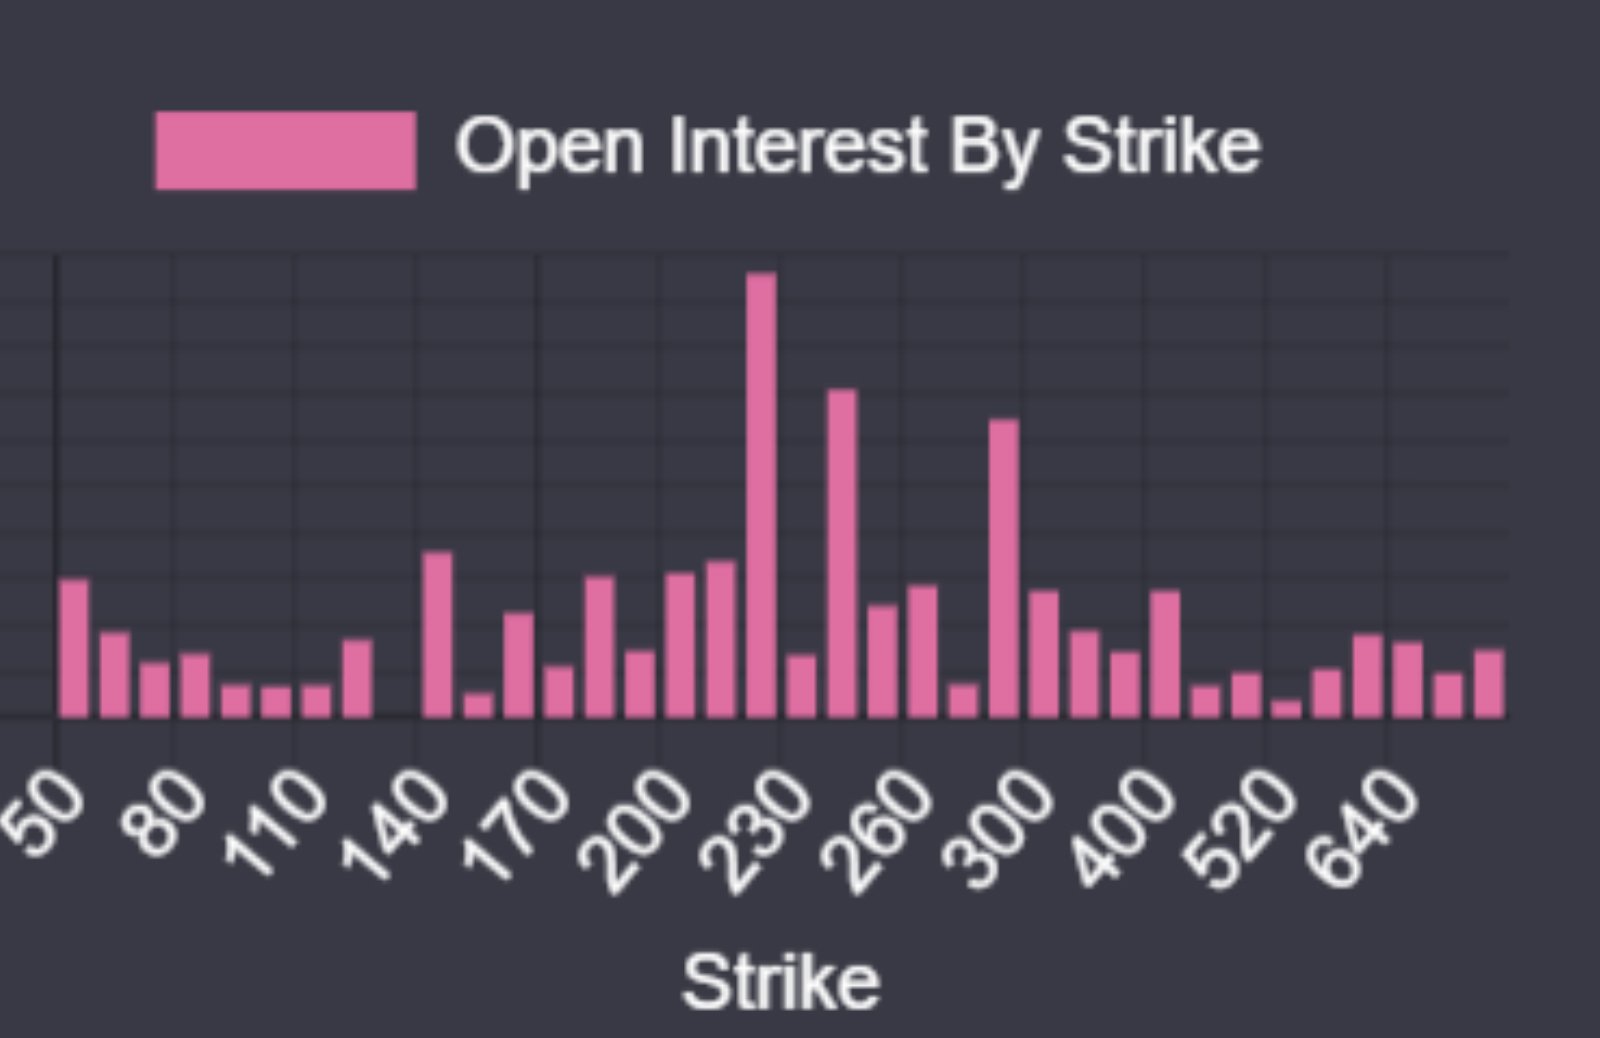
ETH OI by Strike for June 26th 2020 Expiration only
Traders who are short option gamma become increasingly weary of holding onto a position with such risk and they become willing to cross the spread to get rid of the exposure. This creates a bump in the implied volatilities.
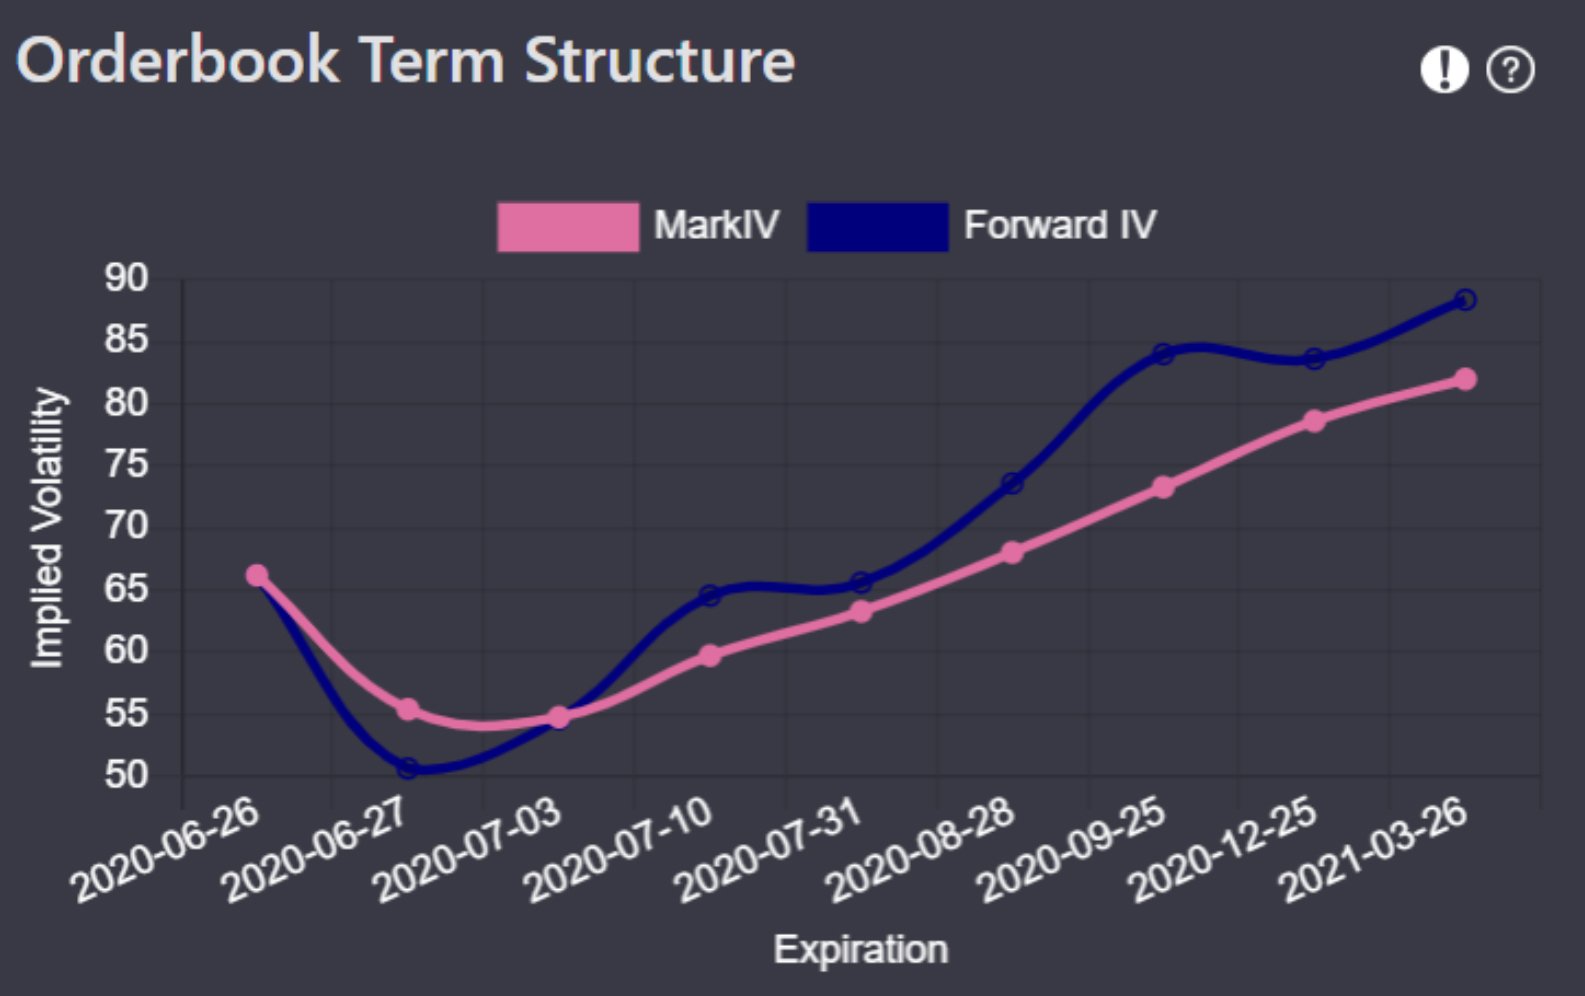
ETH option term structure on June 26th, 2020
Although the implied volatility impact is understandable, the impact on realized volatility isn’t necessarily clear cut.
Depending on who is net long or net short gamma we can expect very different impacts on the underlying markets.
Typically, it’s safe to assume that market makers on Deribit, and elsewhere, aren’t interested in taking directional bets on the underlying securities, therefore they tend to be delta hedgers. End users, who normally do not make their profits from collecting bid ask spreads, usually do not delta hedge with the same frequency as market makers do.
Given this, we can now tease out the impact on realized volatility these events can have. If market makers are net short gamma, the market risks trending and seeing large intraday price ranges as market makers are forced to delta hedge by buying higher and higher, or selling lower and lower, as prices move.
On the flipside, if market makers are net long gamma, their delta hedging impact will have the opposite effect. In this case, the impact of “gamma scalping”, when the market approaches their strike, allows market makers to sell high and buy low repeatedly, essentially leading the underlying to “pin” around the given strike with large OI.
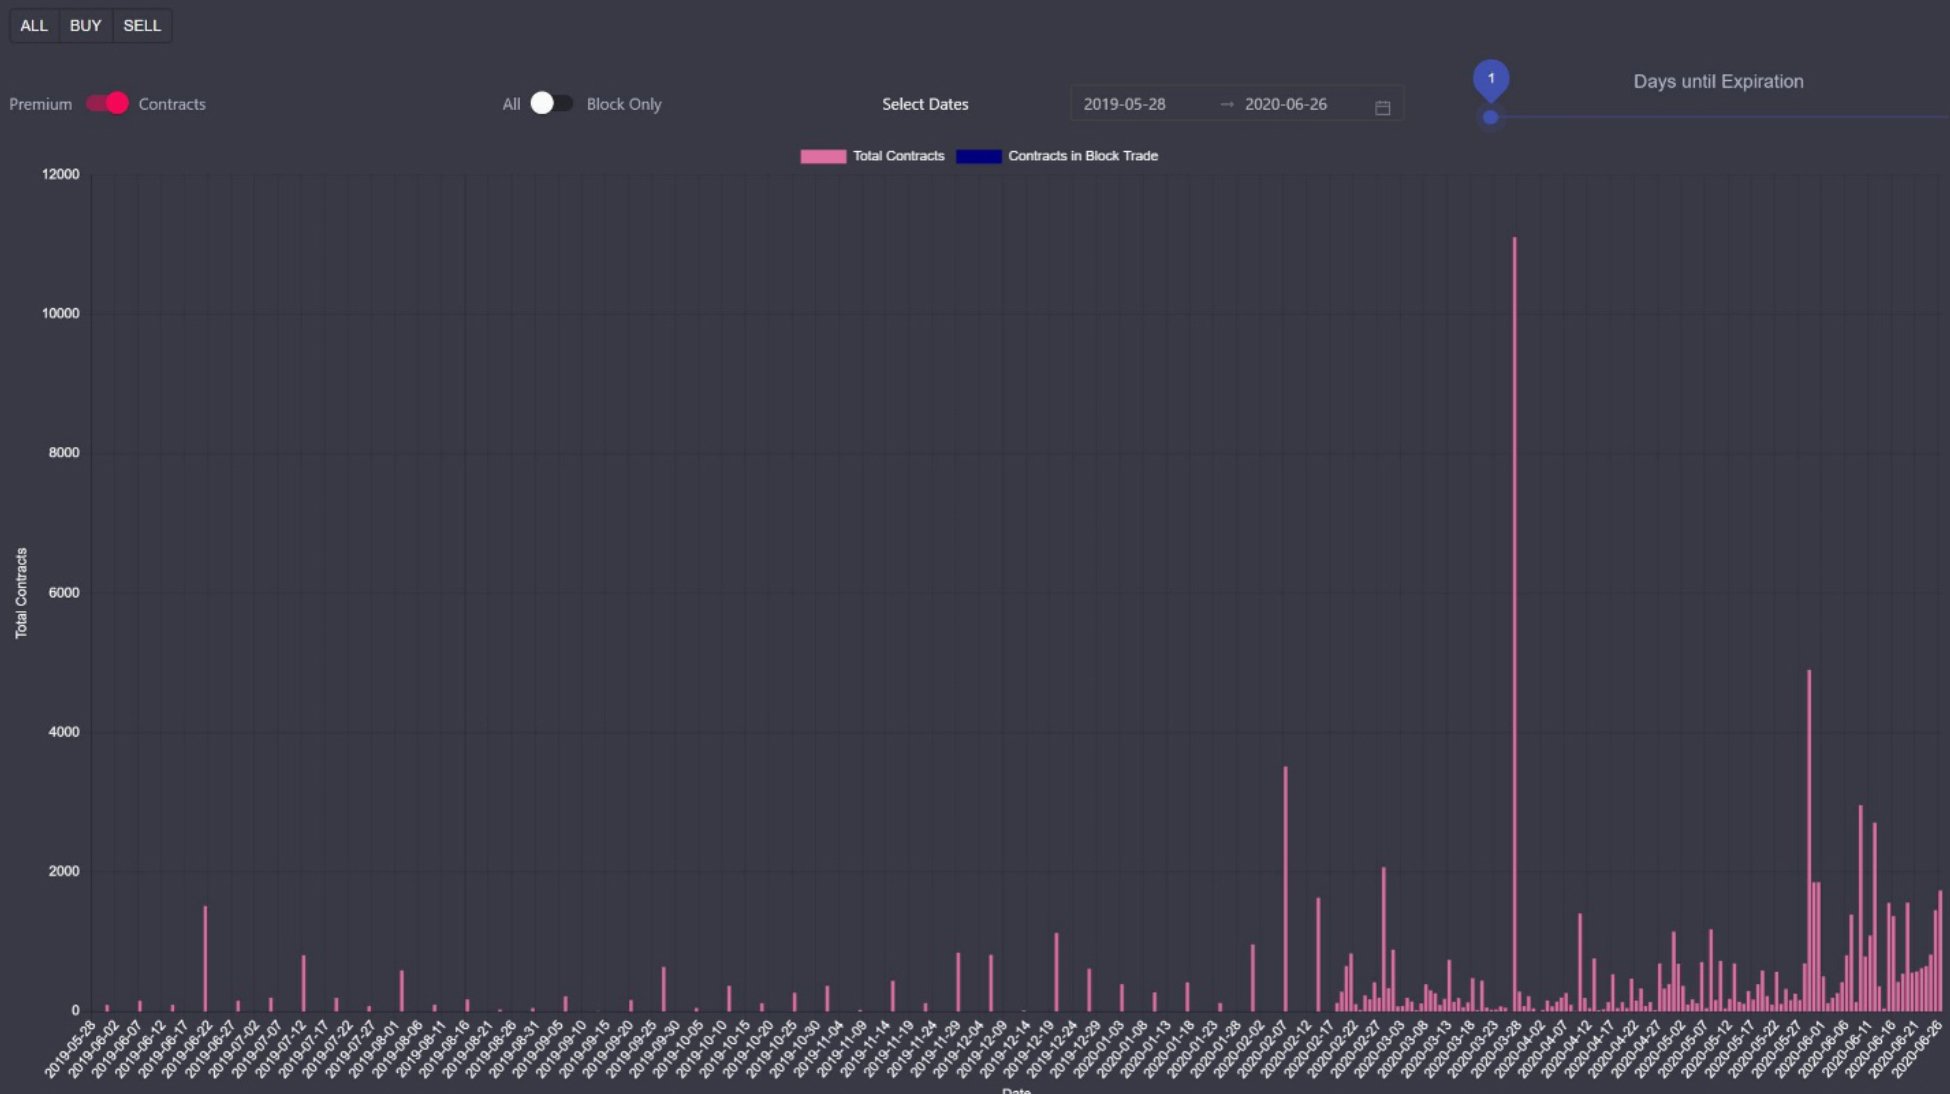
Even if realized volatility remains low, it is often the case that large OI expiration events will lead to increased trading volume. Looking at the chart below, from genesisvolatility.io, we can isolate volume for options with 0-1 day until expiration. BTC saw a large increase in volume, while ETH saw a pronounced volume spike during the March 27th quarterly expiration.
BTC option volumes for options with 0-1 day until expiration only
ETH option volumes for options with 0-1 day until expiration only
How can we know if market makers are net short or net long gamma?
Although we can’t know anything with 100% certainty, we can use robust raw data to quantify the likely positioning of market makers. First, by overlaying trading volume and open interest, we can see the impact on net OI due to buying or selling. Second, we note who is the aggressor for this trading volume. This is important because the trade aggressor will be paying the spread and therefore the counterparty to the aggressor is usually a market maker. For example, let’s try this on a subset of trade data for the ETH June 26 contracts.
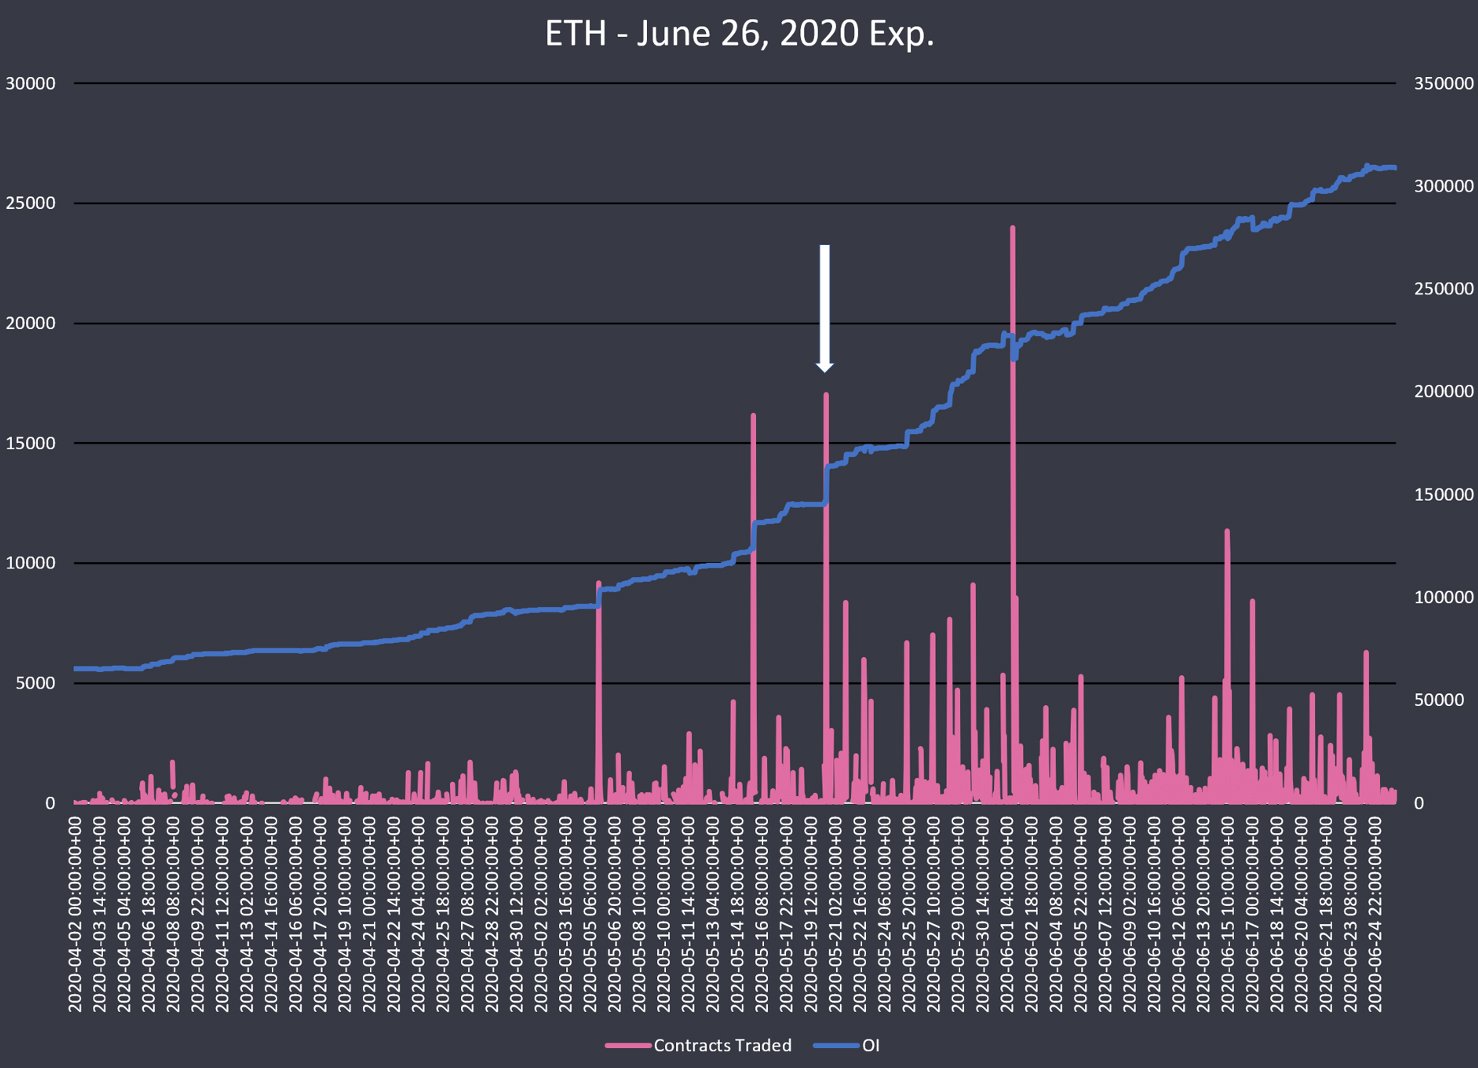
Between 1-2pm UTC on 5/20/2020 we can see an extremely large increase in the OI and the associated trading volume spike.
Digging deeper we can spot this volume and OI jump coming from a large seller of the ETH-240 calls and ETH-220 calls.
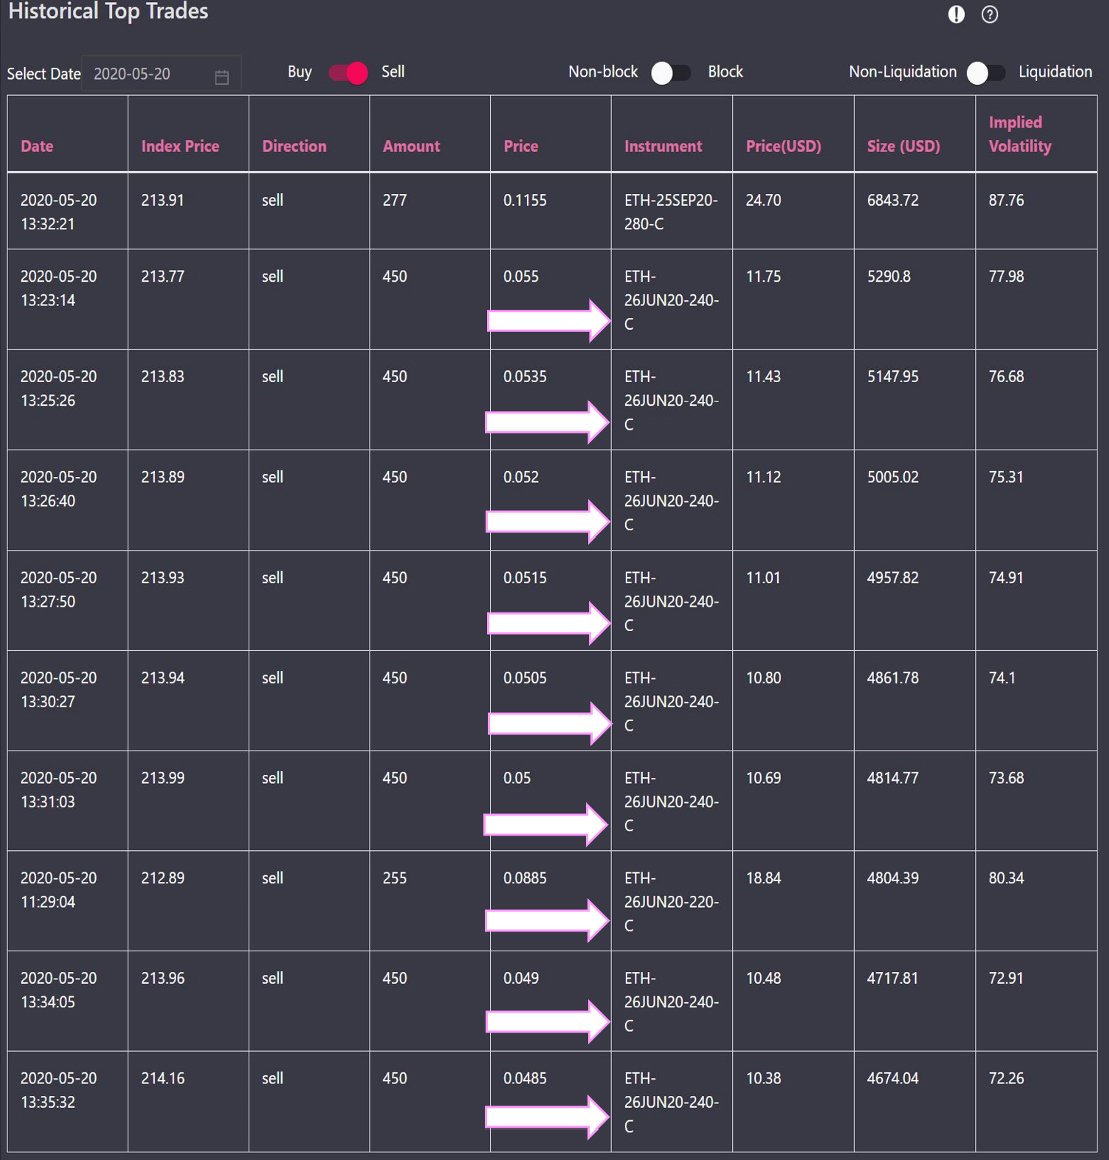
It’s now safe to assume that a market maker is now long these 240 and 220 calls. Using this granular data, we can sum the aggressors for all the trading activity of any instrument throughout time and get a good glimpse of how a market maker’s inventory is positioned.
How is all of this useful?
Going into the trading day of a large OI expiration event knowing where the OI is concentrated, who is net short gamma and how much volume we can expect, gives a trader a lot of edge. Traders can position themselves properly knowing whether the day is more likely to trend or mean revert. What price points are associated with a big gamma flip and whether the strike is likely to “pin”. Etc.
In conclusion, the June 26th expiration went down smoothly with little realized volatility. Market makers likely went into the event with no short gamma exposure. And while saw a large volume traded in the BTC expiring contracts, the ETH expiration volumes were relatively quieter. We did see an associated bump in traded implied volatilities for both BTC and ETH.