BTC Bounces Off Key Support
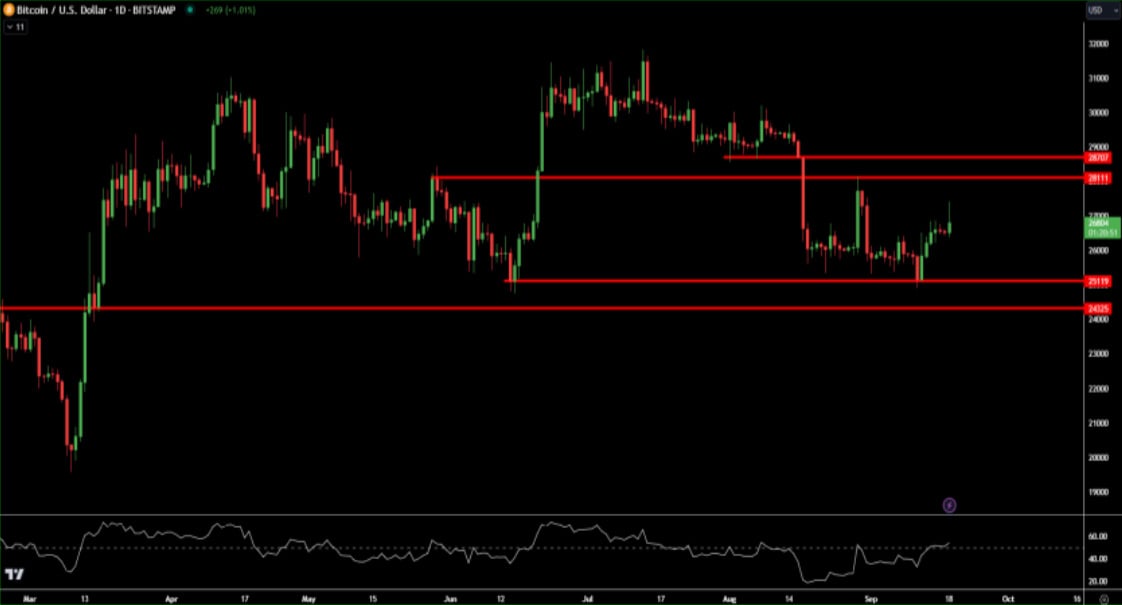
In the last week, Bitcoin has seen robust buying interest, currently anchored at its month-long average of $26.5-27K. Conversely, Ethereum lags, as has been the case in recent times. This lag in ETH is well reflected by the decline in the ETH/BTC ratio.
Bitcoin’s dominance in the market has edged up, rising from 49.2% to a notable 50%. Typically, a broad decline in altcoins correlates to a neutral-to-bullish sentiment for Bitcoin.
From a longer-term perspective, several bullish catalysts are primed to potentially bolster BTC’s value, including the upcoming halving event, the introduction of spot ETFs, and greater regulatory clarity. However, in the near term, there are concerns, including the unrealized losses by short-term holders and potential large-scale sales of seized BTC by the US government or individuals related to the Mt. Gox case. These factors are anticipated to maintain BTC’s price within its known bounds.
Transitioning to the broader economic landscape, this week is instrumental for central bank deliberations. The Federal Open Market Committee (FOMC), Bank of Japan (BOJ), and People’s Bank of China (PBOC) meetings take center stage. While no rate hike is anticipated from the FOMC at this juncture, we might observe a re-assessment in next year’s rate forecasts.

Realized Volatility Shifting Higher
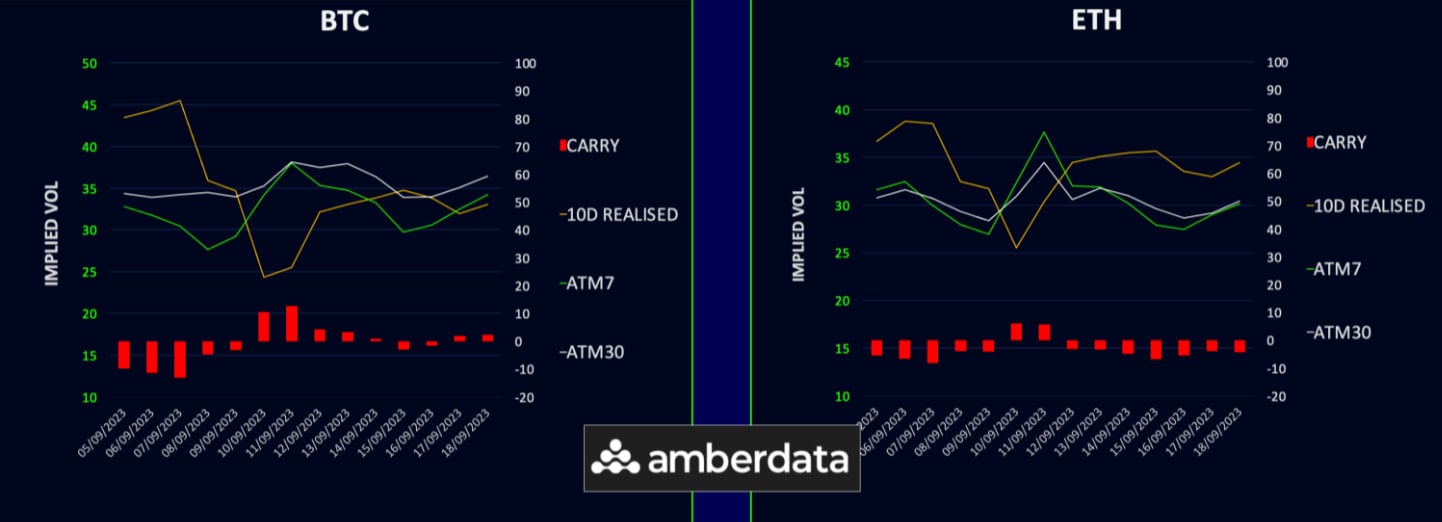
The recent surge in BTC has led to an uptick in realized volatility, which has since stabilized around the mid-30s level. Currently, the spot market is hovering within the middle of its range.
Short-term implied volatilities initially showed a downward trend; however, they rebounded post- weekend, culminating in a marginal decline over the week.
The volatility carry for Bitcoin is slightly positive. However, Ethereum exhibits the opposite, with its implied volatility dropping at a more rapid pace.

Term Structure Steepening
Bitcoin’s volatility term structure is undergoing a notable steepening: while the front-end is showing a decline, the back-end is shifting upwards. Specifically, volatility between September and October 2023 has decreased by 0.5 to 1.5 volatility points. However, for longer maturities starting from December 2023, there’s an increase observed, rising by 1 volatility point across the board. Market dynamics reflect a more pronounced inclination towards VEGA vs GAMMA.
Similarly, Ethereum’s term structure is also steepening into further contango. Volatility for September to October 2023 has been reduced by 1 to 2 volatility points. The middle of the curve, spanning November 2023 to March 2024, remains firm, increasing by 0.5 to 1 volatility point. It’s also worth noting that the volatilities for June 2024 remain stable without any significant shifts.

Vol Spread Heads Down Yet Again
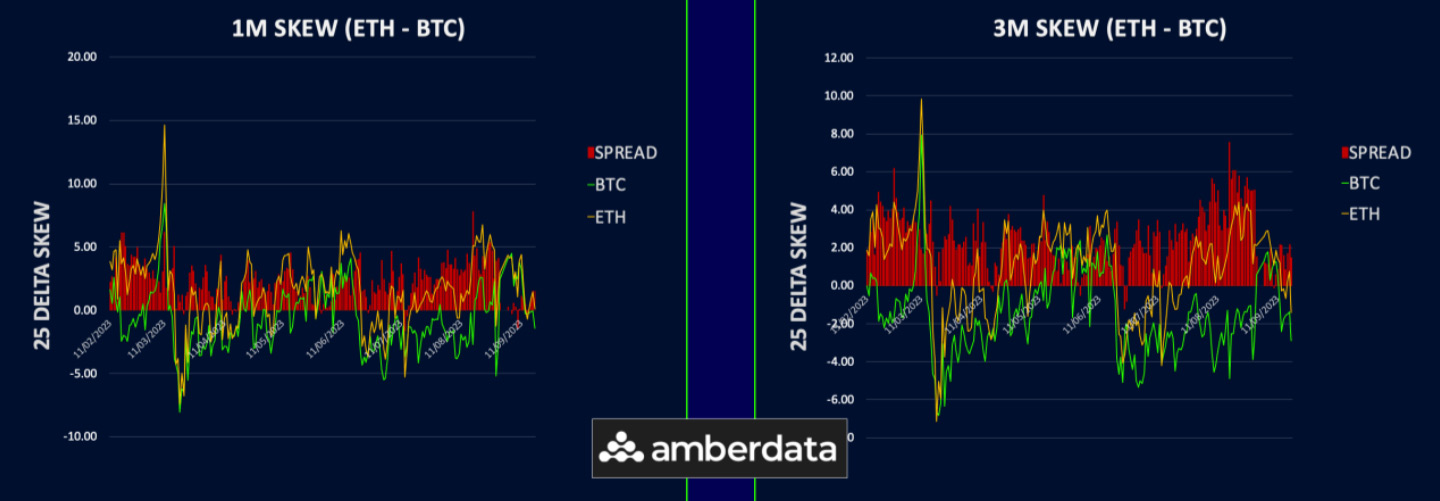
The volatility spread between Ethereum and Bitcoin is trending downwards, predominantly driven by short-term maturities this week. This movement occurs despite the 10-day and 30-day realized spreads remaining in favour of ETH.
The front-end is currently at -4, and this decline extends to -6/7 in the long-end. Notably, the 90-day spread standing at -7 vols appears to have set a new historic low.
Among options traders, there’s a prevailing scepticism regarding Ethereum’s ability to maintain higher realized volatility. As a result, they’re seeking a discount to take on Ethereum volatility – a trend that’s further fuelled by an abundance of supply from call over-writers.
From our perspective, the forward volatility remains the most attractive avenue to own this spread, so one would buy the spread in the longest maturity attainable and use 1-2 month spreads to neutralise the gamma risk.

BTC Skew Shows Call Premium Dominance
In light of the market’s robust recovery from pivotal support areas, we’ve observed a swift pivot back to call premium across Bitcoin’s (BTC) volatility curve. An exception lies with the 1-week expiry, which retains its 1 vol put skew. Durations spanning 1-3 months show a 2 vol call premium. Impressively, the curve’s long end is approaching a 5 vol call premium. It’s worth noting that the skew’s sensitivity to spot fluctuations remains very high.
Shifting focus to Ethereum, its skew has also pivoted, with call premium becoming prominent for durations extending two months and beyond. The window from 1-week to 1-month, however, remains relatively flat, tilting slightly towards a put premium.
To provide some historical context, we had previously highlighted potential signs of exhaustion on the put side as the market probed its lower bounds last week. This foresight was subsequently validated by the market’s rebound to its mid-range position.

Option Flows And Dealer Gamma Positioning
Trading volumes in Bitcoin experienced a modest uptick this week, primarily driven by increased call activity following the market recovery. Notably, a major over-writer rolled shorts by selling a September/October 28k call calendar. Direct calls we bought for October-December ’23.
Ethereum’s options volumes followed a similar upward trajectory this week. A significant portion of this volume was attributed to the covering of large, short upside calls in Oct and Dec23.
Last week, BTC dealer gamma displayed a short stance leading up to expiry. Post-expiry, it momentarily shifted to a long position but quickly reverted to short during the rally. Predominantly, dealers hold a short position for 22nd September across multiple local strikes, contrasted by a long stance for 29th September at the 26k and 27k strikes.
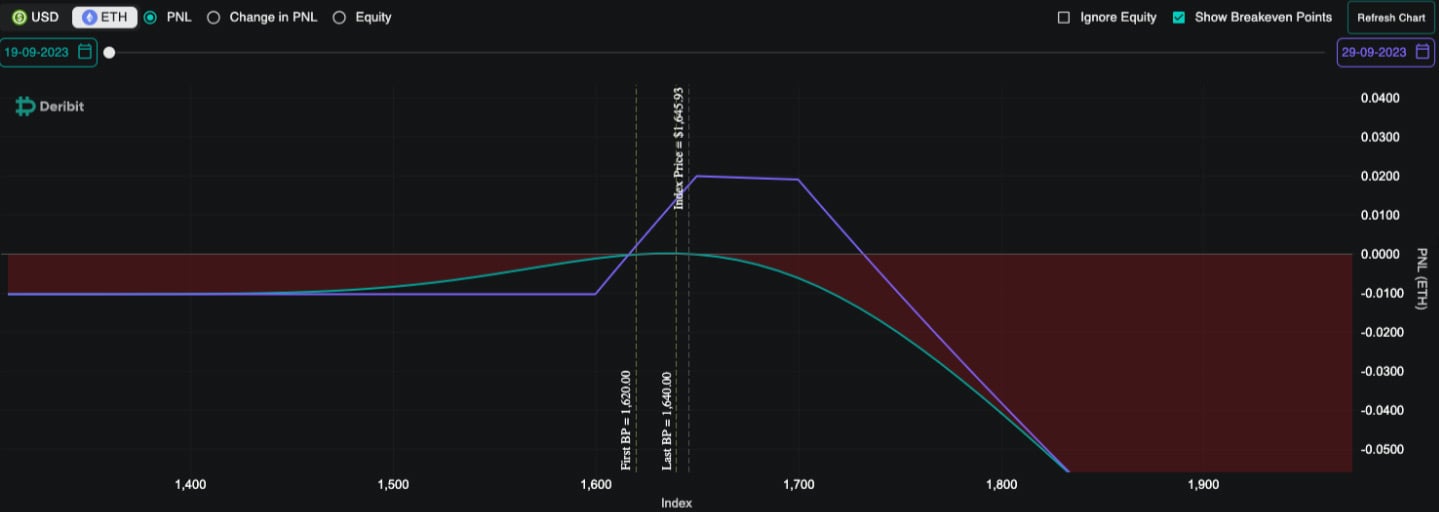
On the Ethereum front, dealer gamma has been consistently ascending throughout the week. Dealers predominantly hold long positions for the 1650-1700 strikes, both for 22nd and 29th September. The magnitude of these positions is consequential enough to influence market dynamics. Consequently, it could constrain Ethereum’s mobility leading up to the 29th September expiry, especially on the bullish side.
Strategy Compass: Where Does The Opportunity Lie?
With the large ETH gamma positioning likely to act like glue, we think using 29Sep call ladder structure to collect decay into expiry is an attractive trade with protected risk on the downside.

To get full access to Options Insight Research including our proprietary crypto volatility dashboards, options flows, gamma positioning analysis, crypto stocks screener and much more, Visit Options Insights here.
Disclaimer
This article reflects the personal views of its author, not Deribit or its affiliates. Deribit has neither reviewed nor endorsed its content.
Deribit does not offer investment advice or endorsements. The information herein is informational and shouldn’t be seen as financial advice. Always do your own research and consult professionals before investing.
Financial investments carry risks, including capital loss. Neither Deribit nor the article’s author assumes liability for decisions based on this content.
AUTHOR(S)
