

In this quarterly report from Amberdata you will find the recent BTC volatility surface trends and all major events in Q1 2023. It also covers an introduction to the DeFi option protocol Lyra, and a strategy backtest around 0DTE options.
Table of Contents:
> Forward
> Introduction
> ATM Term Structure
> Spot/Vol. Dynamics
> ATM Term Structure
> Spot/Vol-Dynamics
> Risk Reversal Skew
> Volumes
> Future Basis
> Linear Perpetual
> LYRA Protocol
> Lyra Pricing vs Deribit
> Notional Volume
> 0DTE Options
Forward
Analyzing the crypto volatility space is still a nascent game and the regimes that crypto volatility displays haven’t been figured out yet.
Another wrinkle in the crypto volatility space are the innovative venues being built on-chain to complement a more traditional volatility trading experience, which can be found on-screen at Deribit or blocked traded through Paradigm.
In April 2020 two new projects began to pioneer the idea of options built directly on-chain. Opyn and Hegic each brought a unique vision for trading on-chain options, aka “DeFi Options”.
Similar to early versions of on-chain spot trading, brought by “Ether Delta” and “Uniswap”, DeFi Options first came to market in two distinct visions:
The AMM (automated market-marker) pool model, which was pioneered by Molly Wintermute over at Hegic.
The CLO (central limit orderbook) model which was built by the Opyn team.
Since April 2020 there have been many other DeFi option protocols built, including a new strategy known as DOVs (DeFi Option Vaults) first pioneered by Ribbon Finance.
Although CeFi venues such as Deribit have shown a lot of success building the traditional CLM model, replicating something similar on-chain comes with a unique set of challenges.
It’s still up for debate what the best method for DeFi Options is going to be, but after the massive success seen from Uniswap, a smart AMM for DeFi Options has shown a lot of promise.
In this report we will introduce the LYRA protocol, which is an AMM based DeFI Options protocol.
Introduction
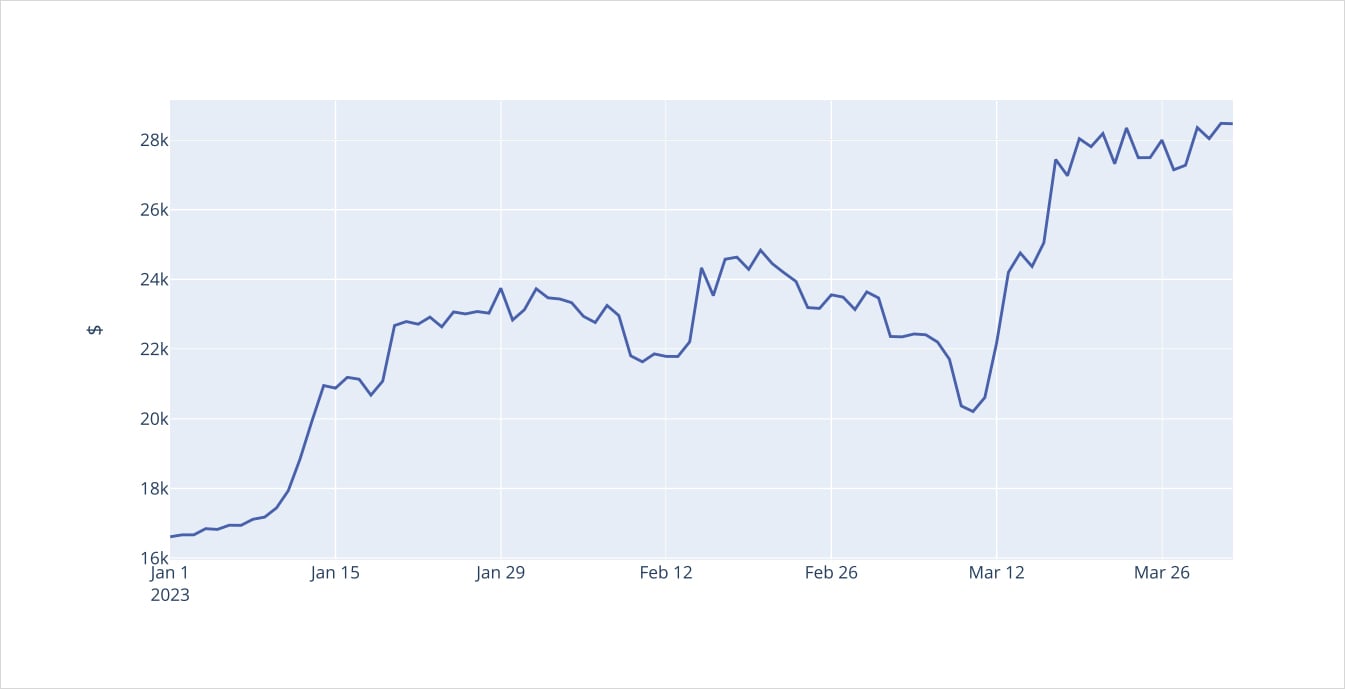
Bitcoin Spot Prices
After the way that BTC spot prices and the associated volatility surface traded in 2022, it was nearly a foregone conclusion that BTC traded as a risk-asset with the potential for violent crashes, similar to behavior seen in equities.
Reflecting on the spot/vol activity witnessed in Q1 2023 we can quickly say that 2022 activity isn’t a precedent set in stone. So far, Q1 2023 has completely flipped 2022 on its head.
BTC has traded with a positive spot/vol correlation and now resembles the volatility profile of an “alternative money” such as gold.
The SVB bank run, which has caused the Federal Reserve to respond with liquidity accommodations, is now a catalyst for both BTC and Gold prices to rocket higher.
We will examine the behavior of the BTC vol surface in Q1 2023.
We will then explore the Lyra protocol as an alternative venue and inspect the trading flow on Lyra versus Deribit.
Finally we conclude with research, conducted by Samneet Chepal at LedgerPrime, exploring 0DTE options traded on Deribit.
ATM Term Structure
BTC ATM Constant Volatility
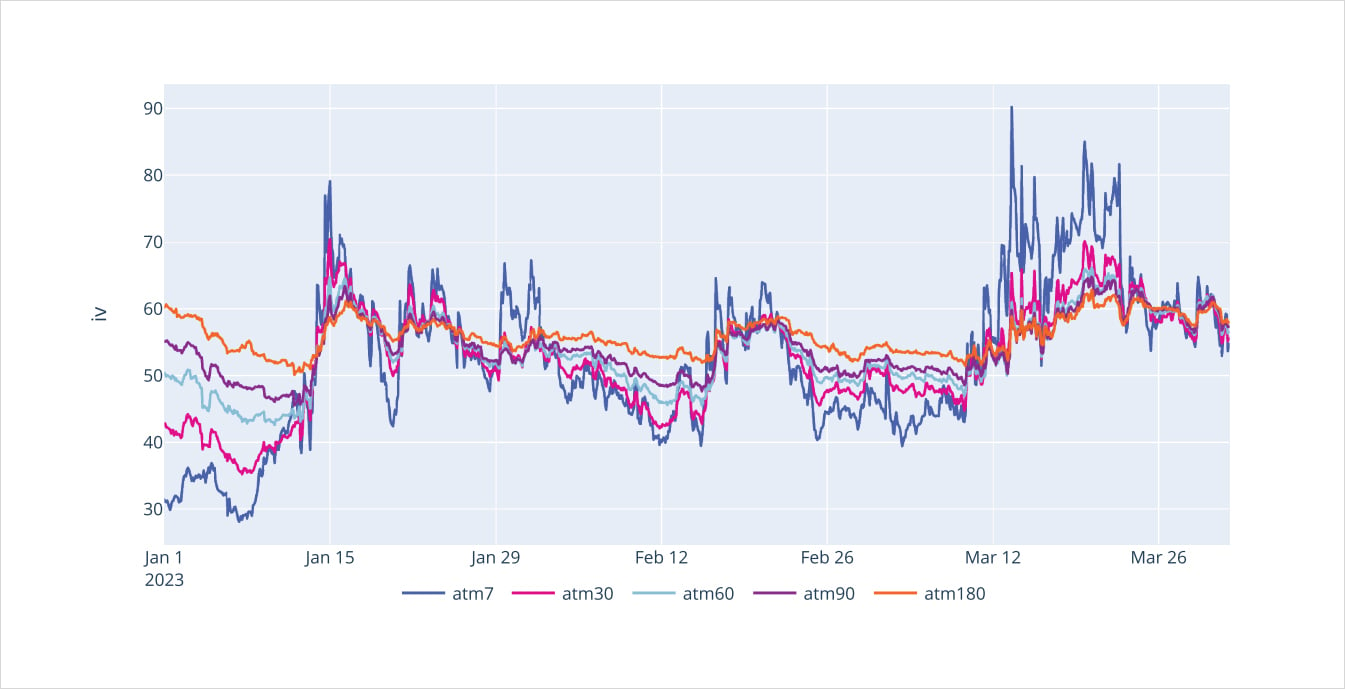
This year BTC saw two very significant volatility moves, both triggered by upside price action.
This is something quite different from 2022 because of both the spot/vol cycle and the term structure richness.
We can see that 7-day ATM volatility opened January 1, 2023 around 30% IV.
This type of aggressively low BTC IV sent the term structure into a steep Contango, printing about 0.74 net discount in the term structure at the beginning of 2023.
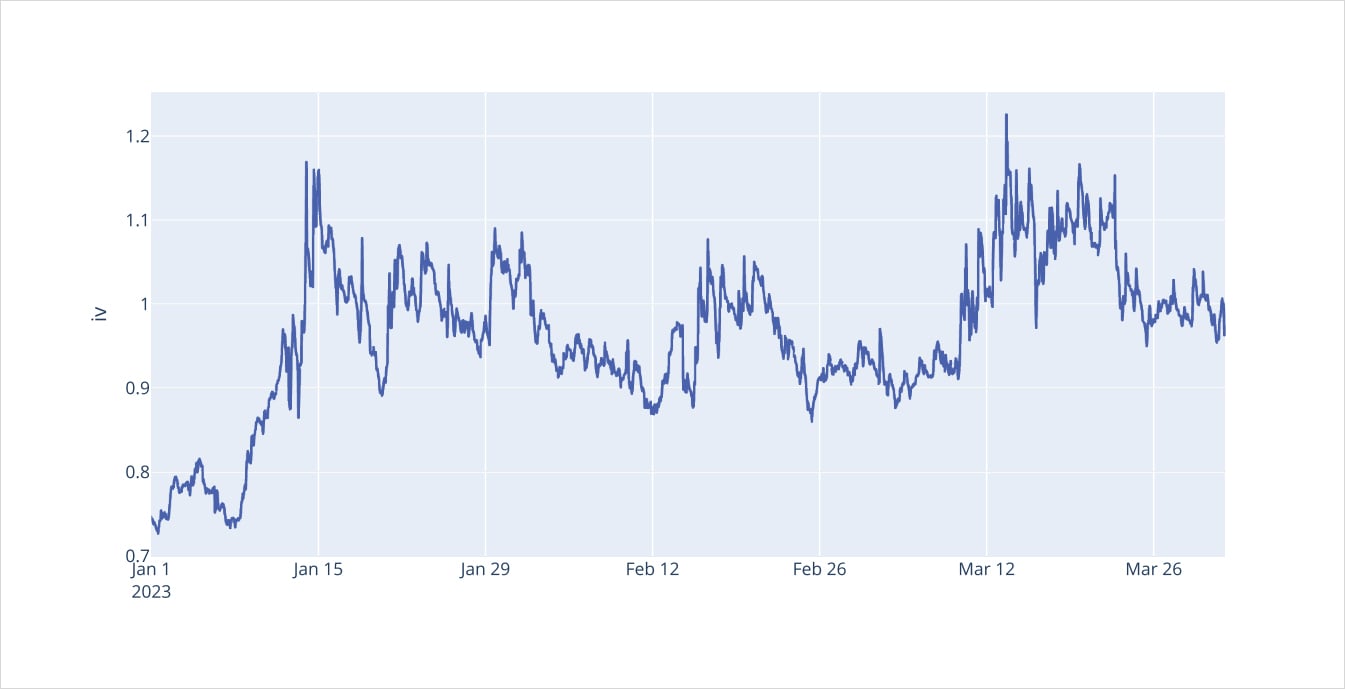
BTC Richeness (+premium/-discount) of term structure (+backwardation/-contango)
As BTC prices broke-out of a bottoming formation, velocity came into the market. This price action, in January 2023, coincided with a rally in gold and a drop in treasury yields.
The narrative around a pause in credit tightening provided fodder for a BTC rally.
When the employment report for January beat expectations by a wide margin, we saw gold quickly drop and yields rally, BTC however began to decouple and show relative strength.
The true divergence from “risk-asset” to “alternative money” came to fruition during the SVB bank crisis.
We initially saw BTC drop along with equities. This sent the ATM IV term structure into backwardation, similar to 2022 flows initially.
Over that weekend, the Fed announced a liquidity plan for SVB depositors and others in the broader banking sector. This caused BTC to quickly make new YTD highs and trade into the $28.5k range.
Another strong example of a BTC “FOMO” rally causing the term structure to flipped into a rich backwardation of nearly 1.20.
Spot/Vol. Dynamics
BTC Correlations log returns Spot/Atm30
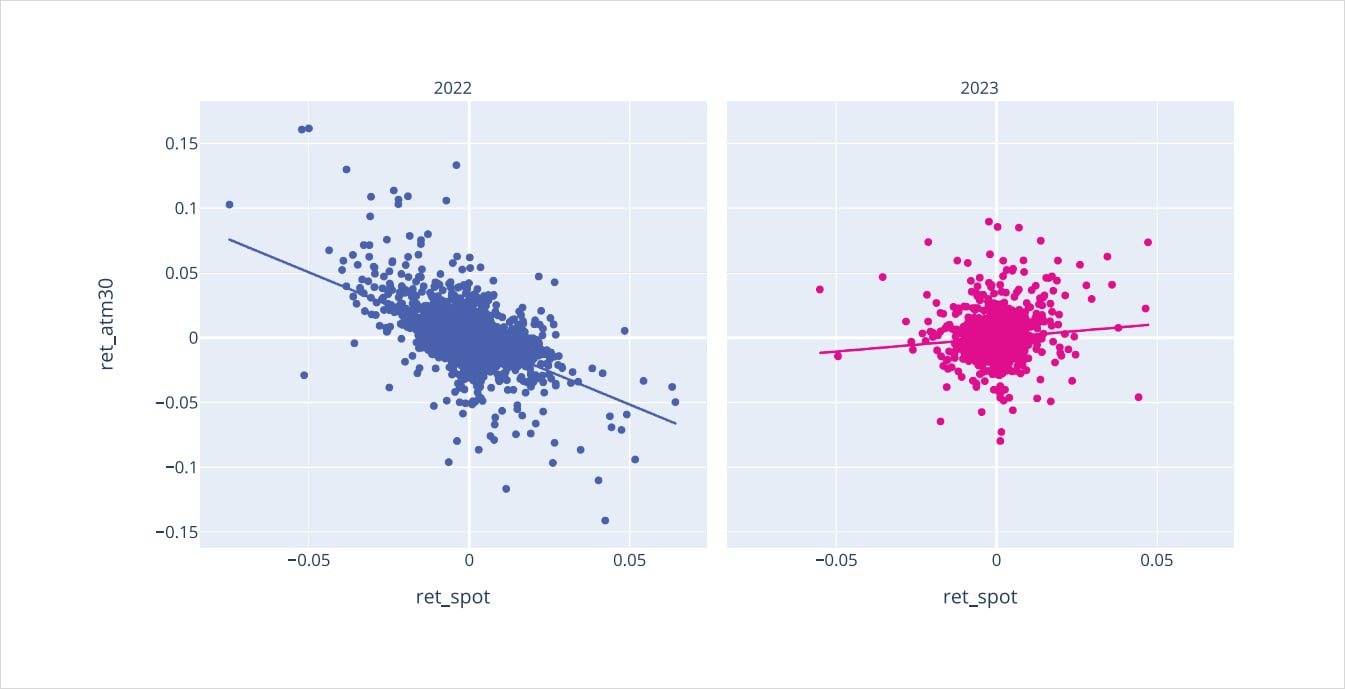
2022 stands out as a regime-changing year. We can see a much more negative scatter plot slope and a “tighter” range of readings.
On the rolling plot, we can also notice deeply negative and persistent readings of the beta values.
One of the big questions in crypto vol is whether this shift is cyclical (temporary) or structural (persistent).
n traditional markets, equity spot/vol regimes will be negative (like we see in 2022 for BTC) but commodities often display a positive relationship, as production & demand shocks affect the commodity volatility space in a different way
Spot/vol relationships in Q1 2023 reversed the 2022 dynamic.
We can see from the scatter plot the overall trend between changes in ATM30 IV and spot price changes.
BTC Rolling 7 days linear regression of log returns Spot/ATM30
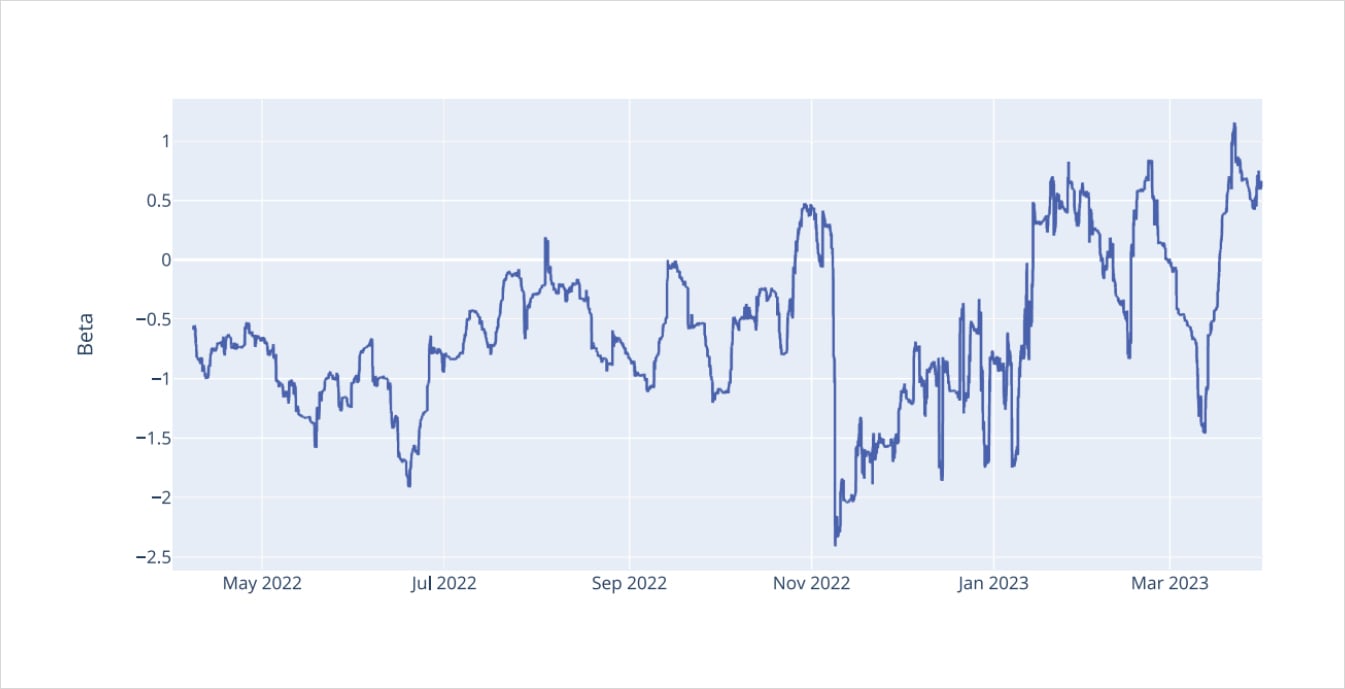
Looking at the 7-day rolling regression of these two parameters show a more precise picture of when this positive correlation was most and least pronounced.
As already mentioned, the breakout of a bottoming formation in mid-January triggered the start of a positive spot/vol regime in Q1. Brief counter examples were seen at two key moments:
- In early February with the release of the strong employment report for January.
- The initial reaction from the SVB banking crisis.
Overall, BTC was able to recover from those two key negative spot/vol catalysts to maintain an overall positive picture in Q1 2023.
Risk-Reversal Skew
Skew 30 box plot
Looking at the 25-delta risk-reversal we notice two distinctly different reactions from the examples just mentioned.
First, in reaction to the strong jobs report in early February, we can see the long-dated risk-reversal remain anchored while shorter-dated maturities dropped lower into negative values.
Second, the SVB banking crises caused all risk-reversal maturities to move lower, at least initially, in tandem then quickly recover.
This is peculiar given that long-term maturities are normally more anchored as they reflect median relationships of longer sample periods.
Another interesting insight is how quickly long-dated risk-reversals flipped into positive territory despite the volatility surface of 2022 being so decidedly negative for spot/vol dynamics.
BTC ATM30/skew30 correlation
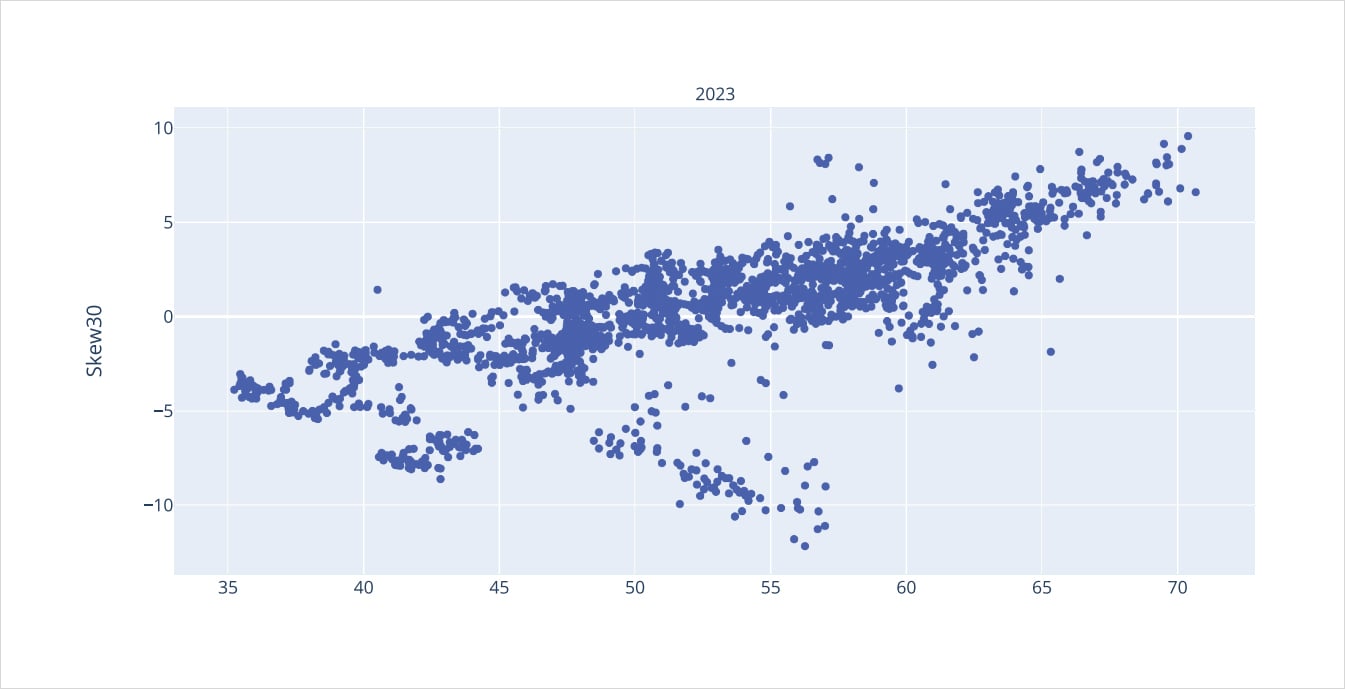
Looking at the scatter plot of the ATM30 IV and the risk-reversal levels, we can see how tightly the two moved in tandem. The spot/vol dynamics in the implied space are tight.
BTC 25Δ vs ATM Ratio Normalized constant 30 days
The way this translates directly into the 25-delta segment of the surface is by repricing the call wing higher than the ATM vol.
Throughout 2022 the 25-delta call wing traded at a discount to the ATM implied vol, in Q1 2023 the wing premium came back.
This type of repricing could suggest a structural change in option trading flow and call selling supply (for example, if BTC miners stopped selling calls against future mining rewards, etc).
Volumes
There’s an interesting story to be told in the option volumes seen this year.
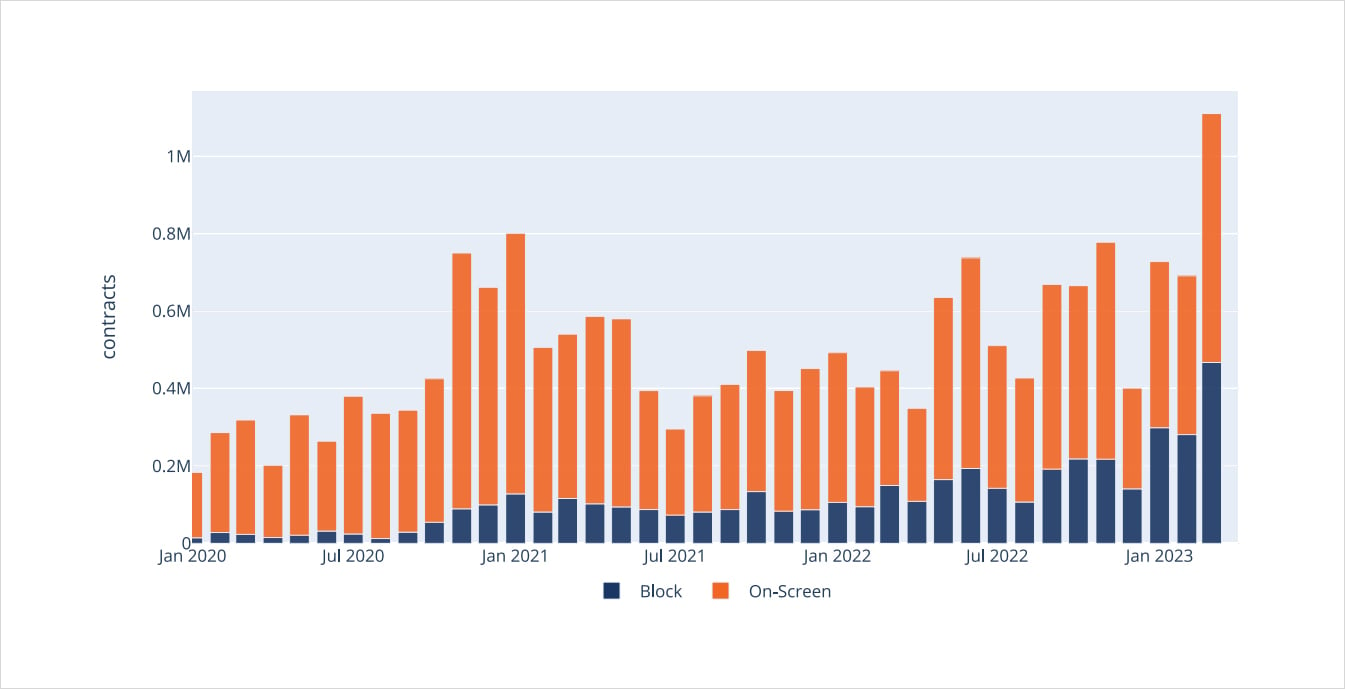
First, BTC monthly contract volumes hit an all-time high in March 2023 on Deribit, both in terms of total trades and block trades.
This is significant as it shows participation in the recent spot price rally. There are real opinions being expressed in this market. This isn’t a low liquidity move pushing the vol surface around, this is real flow.
Deribit BTC monthly volumes
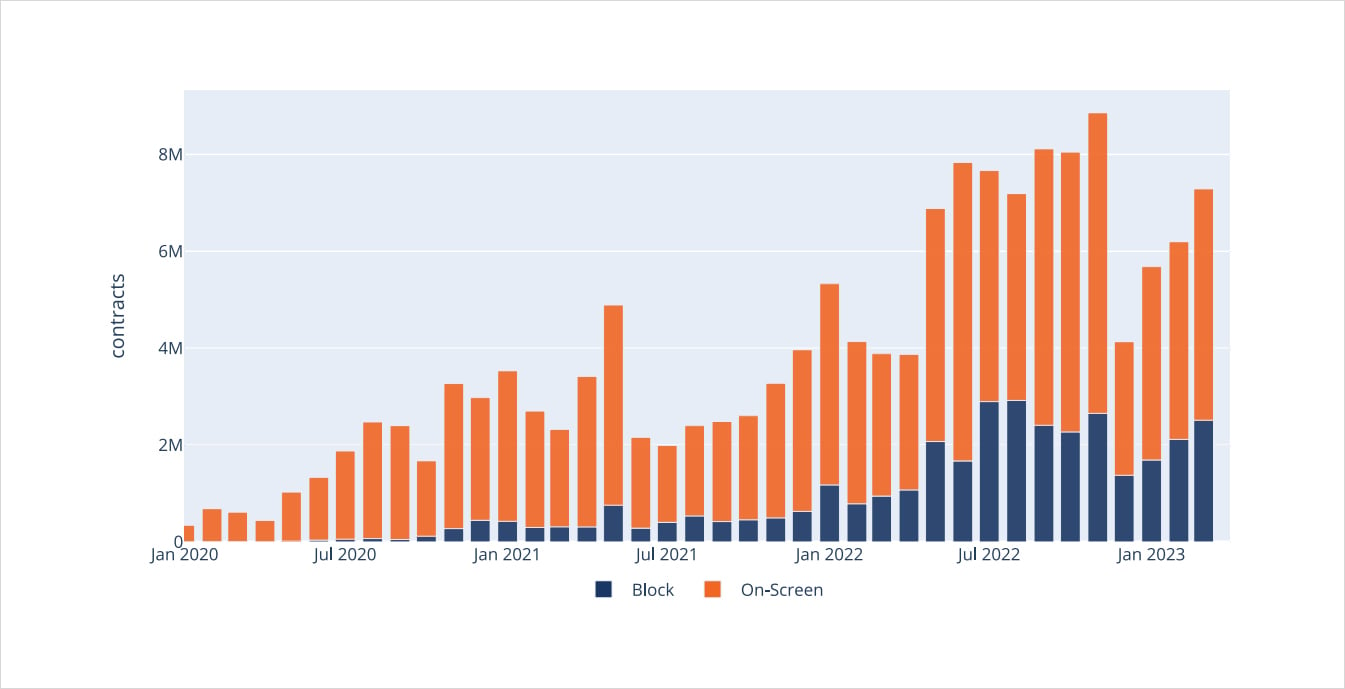
Deribit ETH monthly volumes
Open interest BTC vs ETH notional $ with Put/Call Ratio
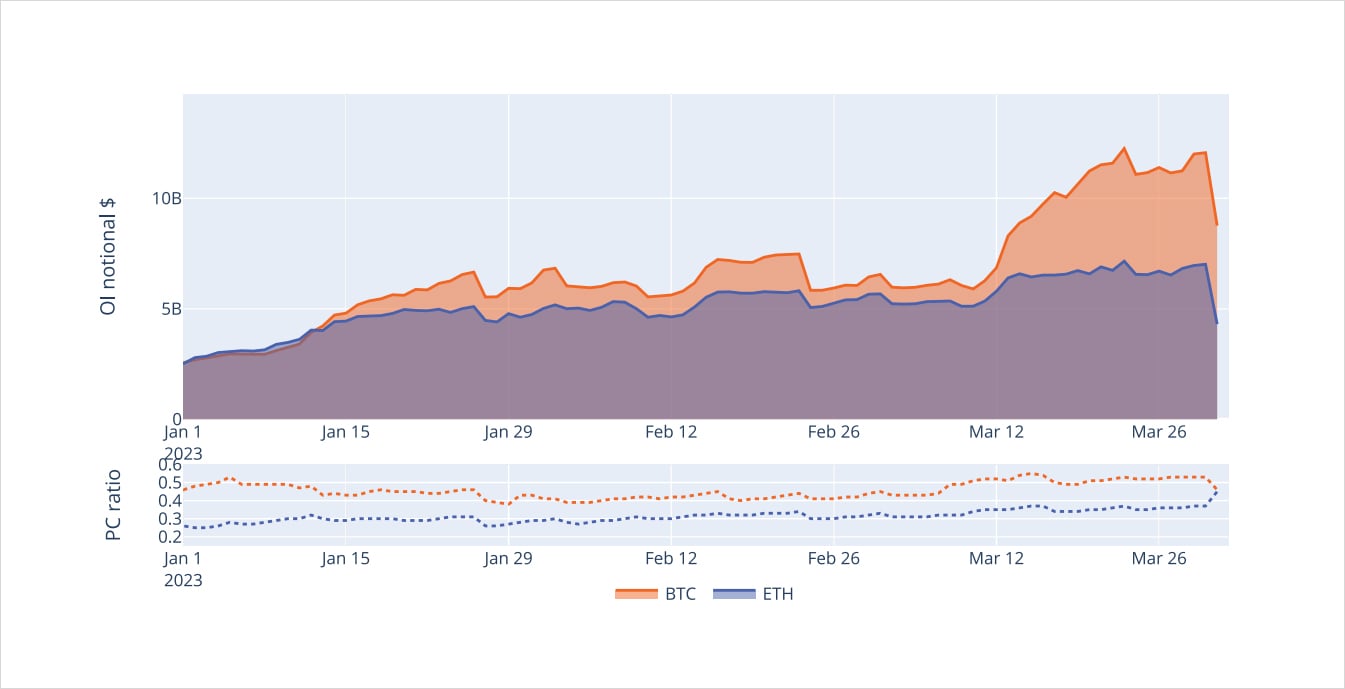
Secondly, another important phenomenon is the relative volume and open interest between BTC and ETH.
2022 was the year of the great awakening for ETH option traders, while 2023 is a return to BTC dominance, both in terms of total volume traded and open interest outstanding.
The significance of this is potentially two-fold:
- BTC’s value proposition is more of an “alternative money” pure-play compared to ETH.
- BTC lives in the jurisdiction of the friendlier CTFC as a “commodity” compared to ETH’s ambiguous categorization between “commodity” and “security”, especially post PoS merge.
Lastly, another interesting point is the convergence of the P/C ratio for both BTC and ETH.
While ETH’s open interest increased for puts, BTC’s open interest grew on the call side.
Future Basis
BTC Constant Basis annualized Box Plot
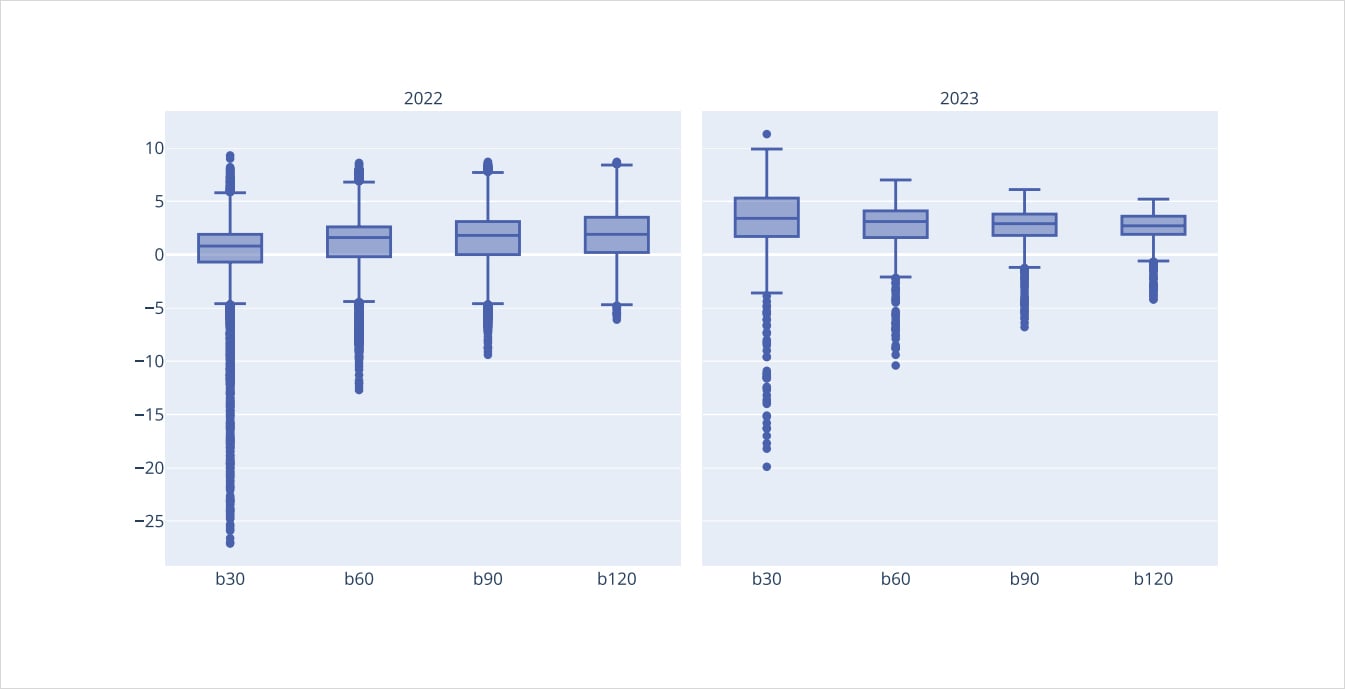
After a quiet year for the basis in 2022, we finally saw an expansion of the basis for futures on Deribit.
The 30-day basis median in 2023 was above the upper 75% percentile for all measurements throughout 2022.
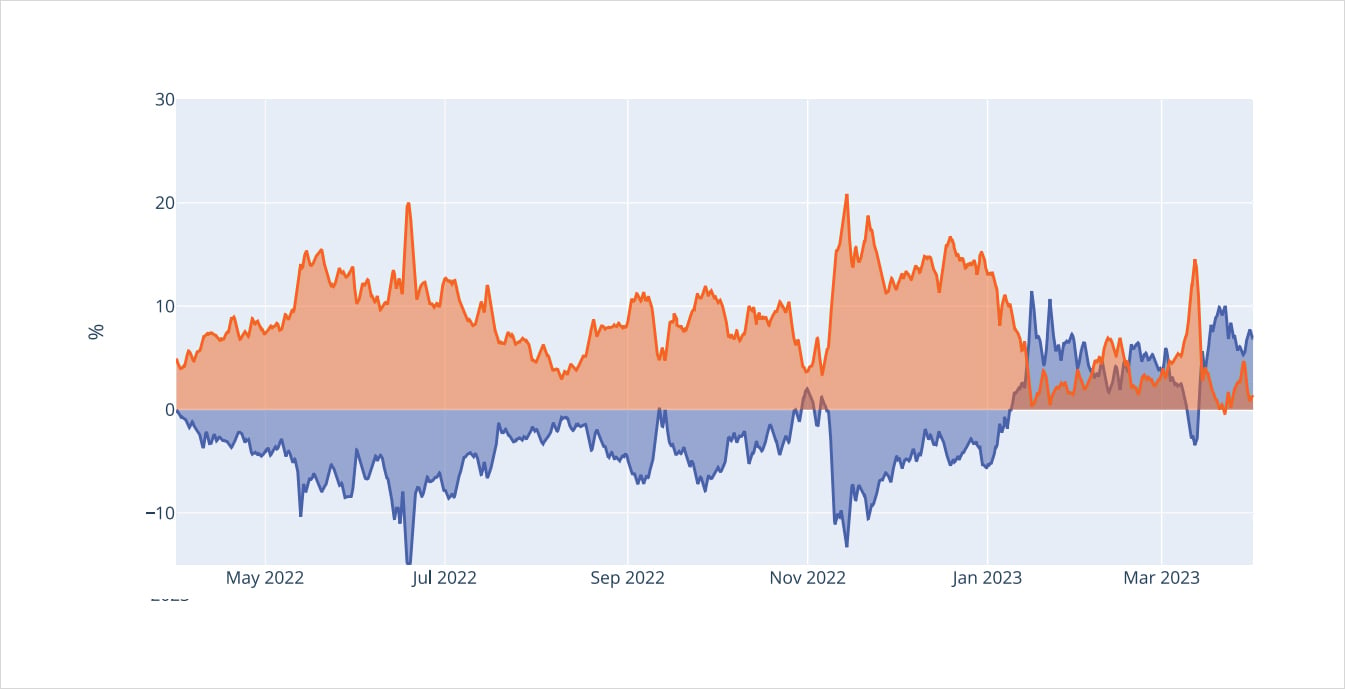
Deribit Constant Basis 30d
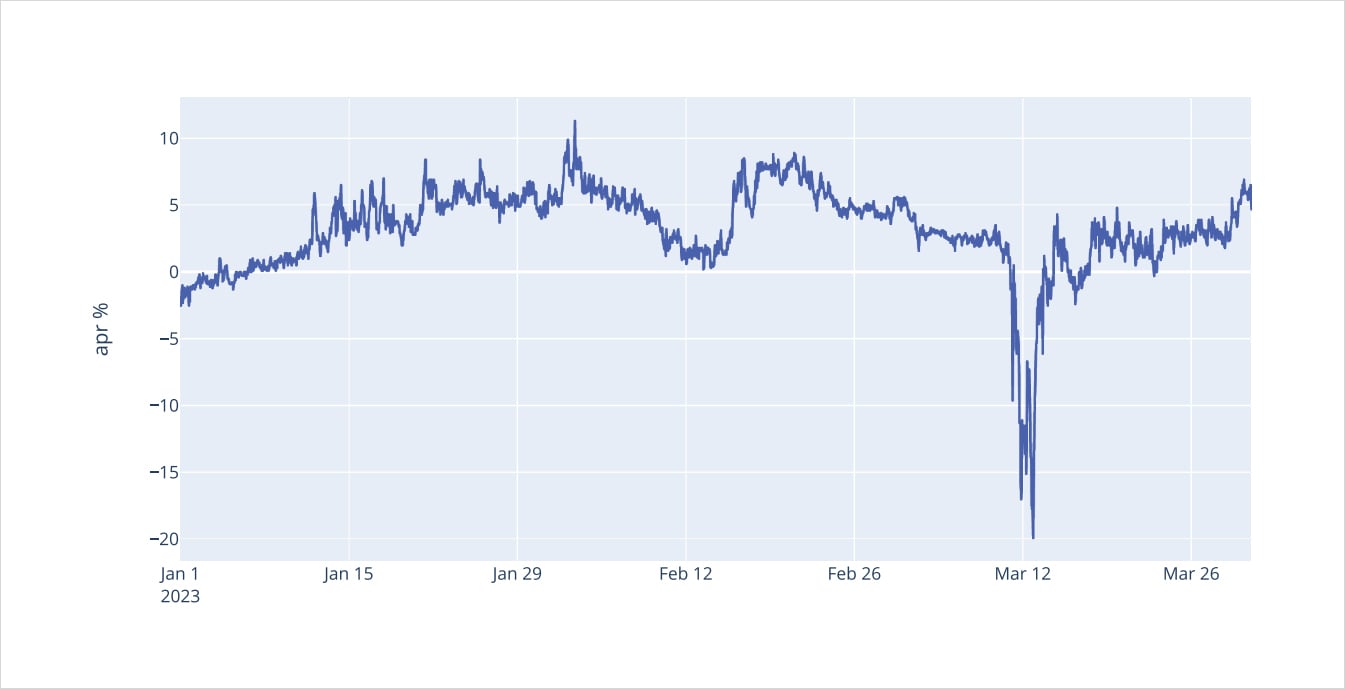
Despite seeing an overall positive basis for BTC throughout Q1, reaching a height of 10% APY, the 30-day basis still had a wide trading range.
During the SVB banking crisis the Deribit 30-day futures basis briefly hit a level of -20% APY, only to quickly snap back into a +5% yield as BTC spot prices turned around.
This type of broad range in futures basis trading bleeds into option pricing, as the extra volatility of the basis creates an additional payout dimension for BTC options.
Linear Perpetual
One of the most interesting consequences from the SVB bank-run was the complications for USDC.
Jeremy Allaire, the CEO of Circle, confirmed that there was about $3.3B (8% of market cap) of USDC dollar reserves parked at SVB.
This news caused the USDC dollar peg to break as traders were quickly discounting the potential value of locked funds at SVB, and knock-on effects, should there be further contagion.
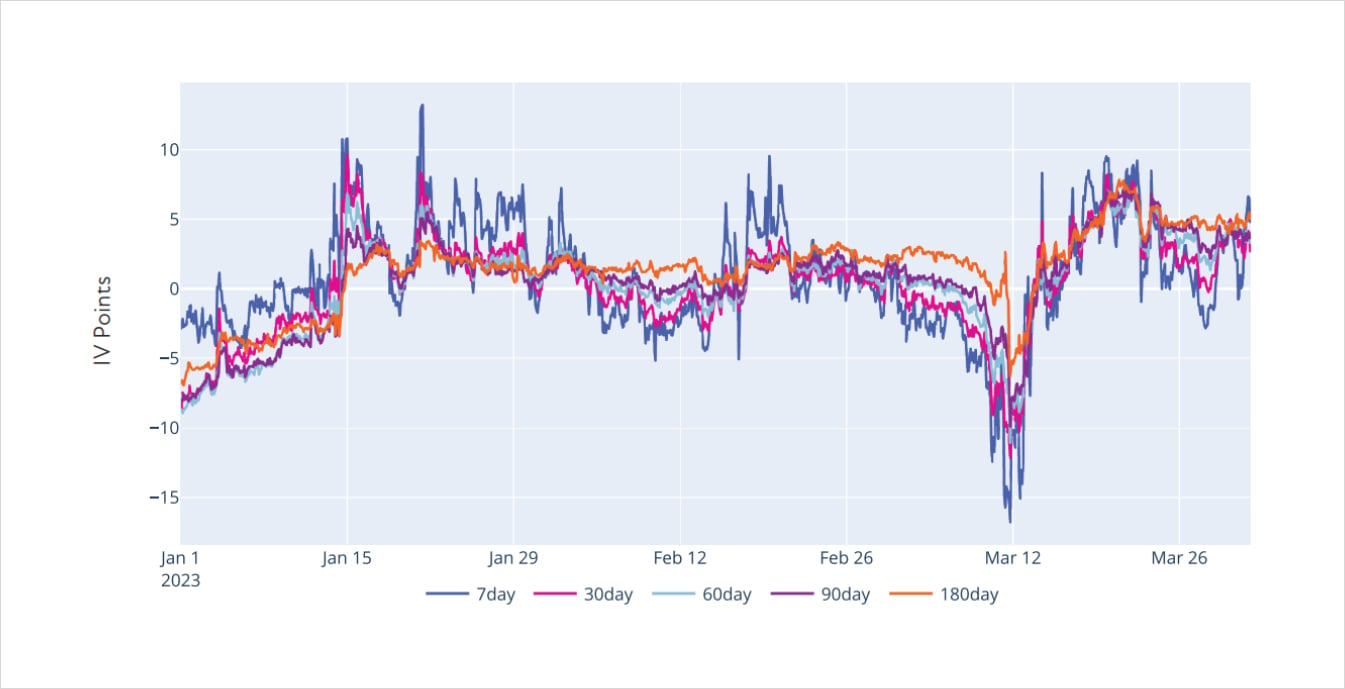
7 days Realized Volatility INdex vs USDC perp vs BTC perp
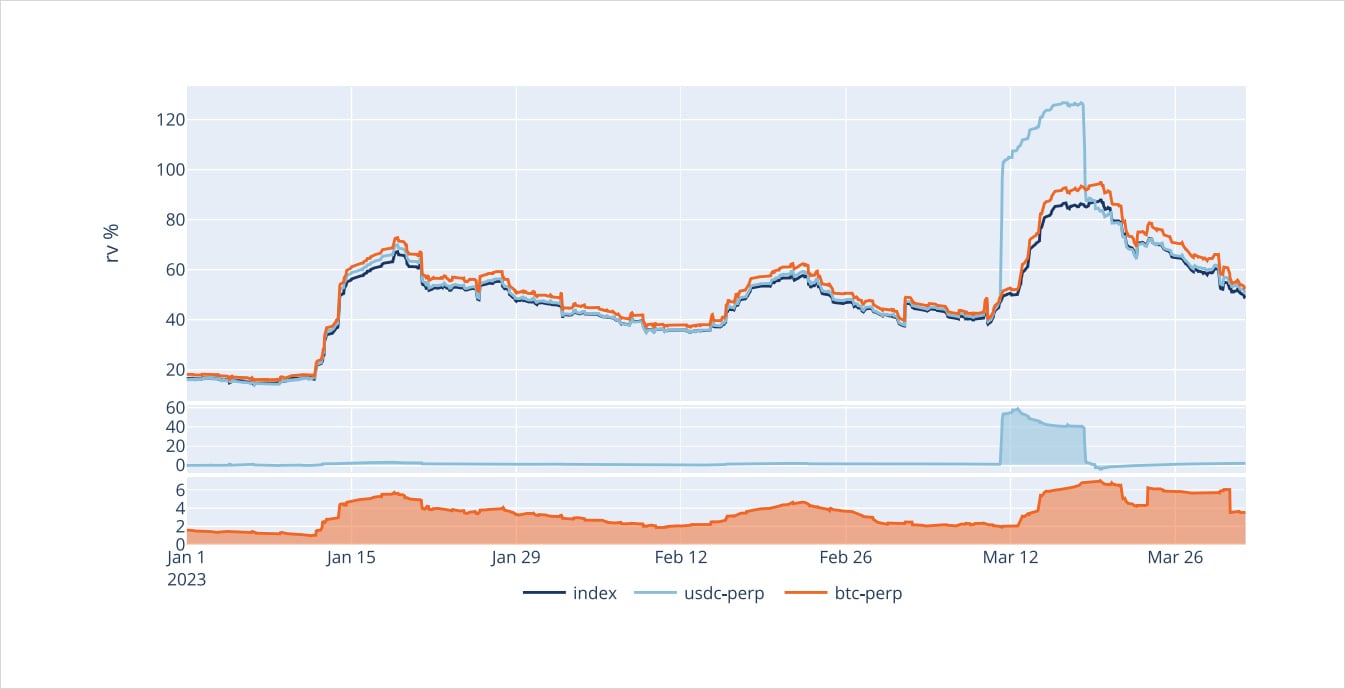
Deribit has both a coin settled perpetual contract (the flagship btc-perp) and a linear, USDC based, usdc-perp.
Looking at the chart above we can see two import data points clearly:
- The btc-perp typically trades around +4 RV points higher than the underlying index.
- As USDC’s peg broke the RV spread from usdc-perp to the index exploded nearly +60 RV points.
Price INdex vs USDC perp vs BTC perp
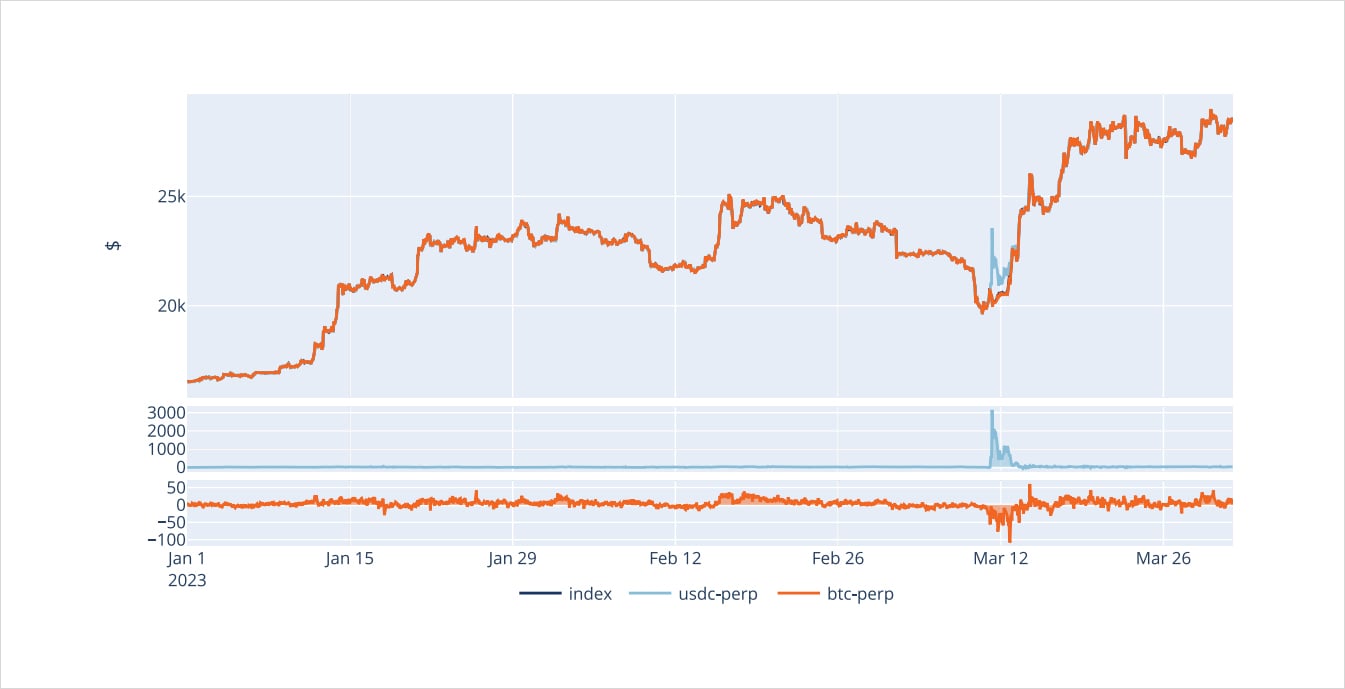
Besides the divergent RV profiles, another very interesting phenomenon was the divergent dollar spread between the index, usdc-perp and btc-perp.
As USDC’s peg broke the value of the usdc-perp exploded higher, due to a shrinking denominator, reaching a peak of about +$3,000 to the index price.
At the same time, the btc-perp started trading at negative funding, reaching a nearly $100 discount to the index.
Deribit 8h Funding Rate
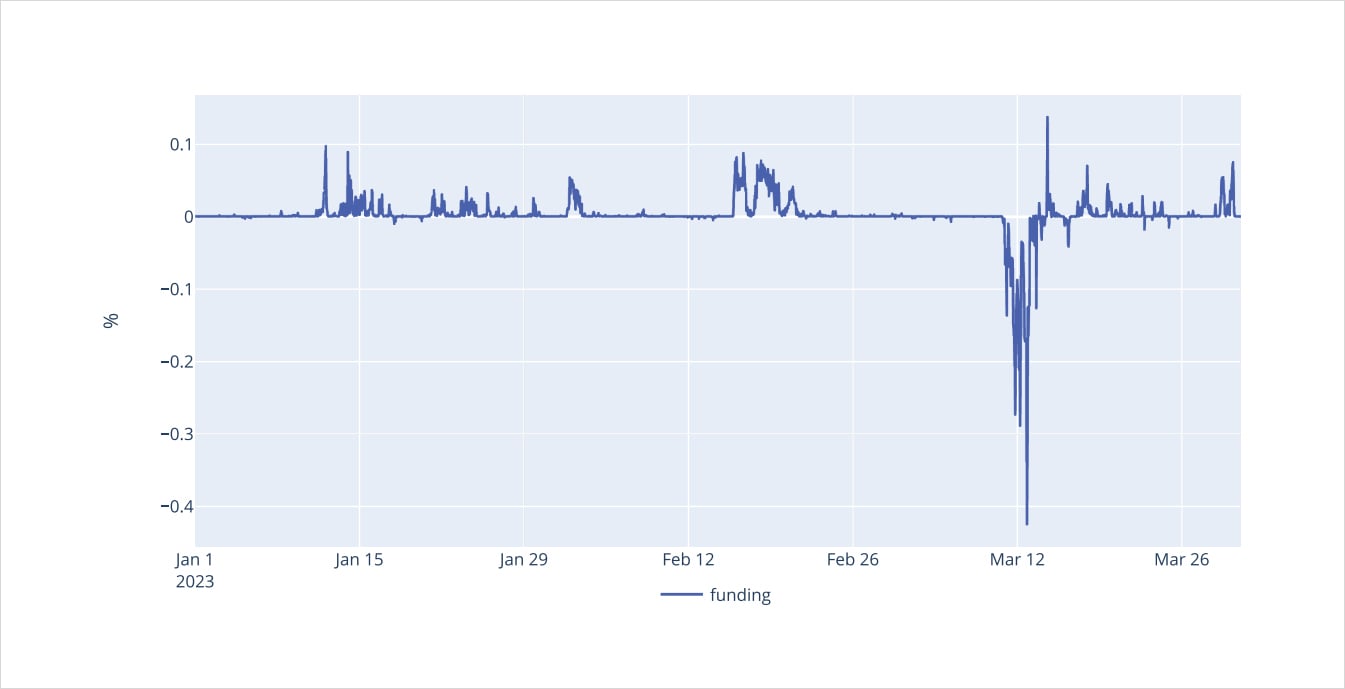
Examining the btc-perp funding in more detail, we can see 8h funding reaching nearly 40bps.
A good theory why btc-perp funding went negative was due to synthetic stable coin position building.
If traders couldn’t flatten up exposure by safely swapping BTC to stablecoin, a good alternative for CeFi traders on Deribit would be to keep their BTC denominated account hedged with a short btc-perp position.
Ultimately, BTC rebounded as the Fed bailed out SVB deposits, once again expanding their balance sheet.
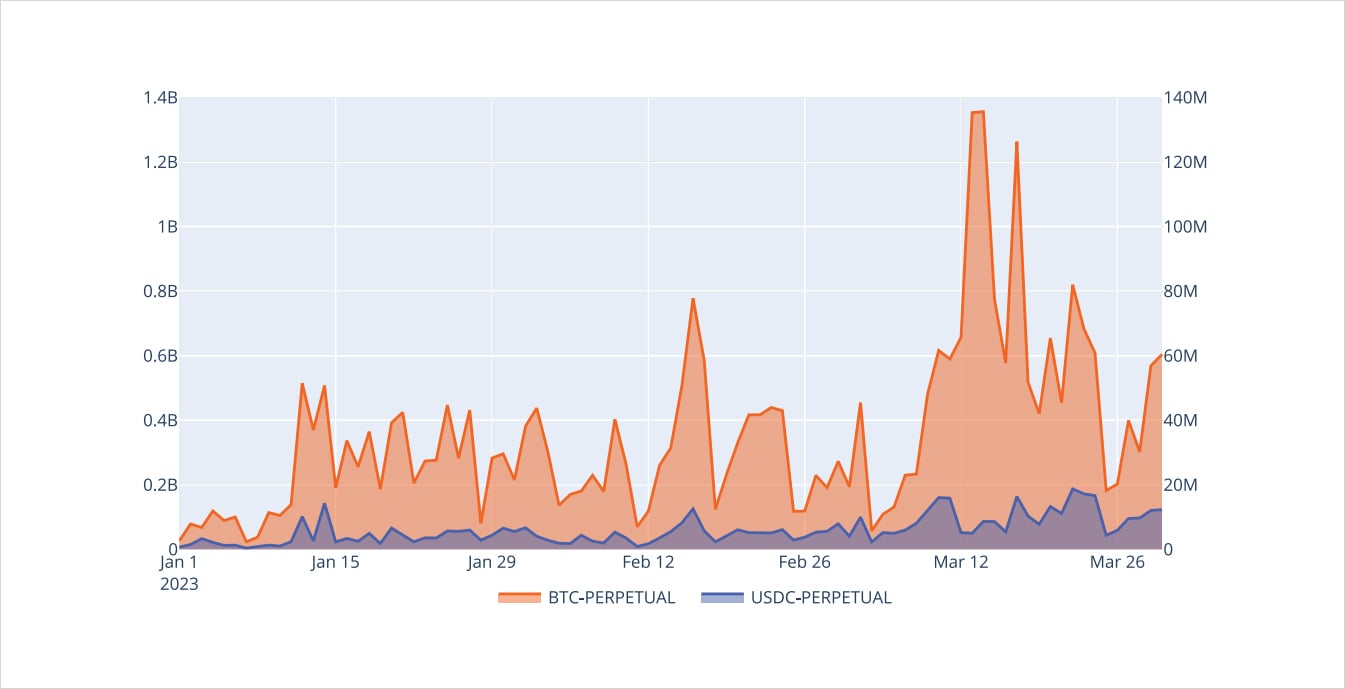
Volumes BTC Perp vs USDC Perp
Open INterest BTC Perp vs USDC Perp
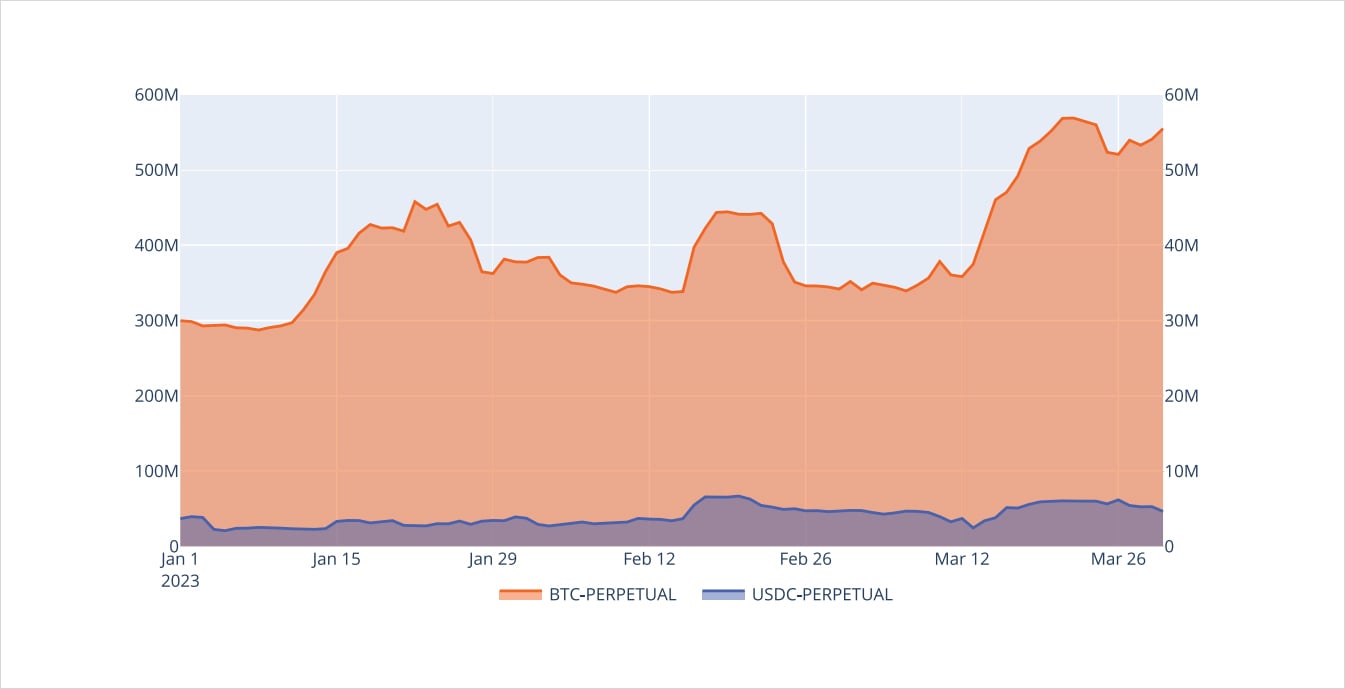
Although there was a good opportunity to pairtrade usdc-perp and btc-perp, as we quickly saw the divergence turn into convergence in a few short days, the reality is that this opportunity was constrained by liquidity.
The btc-perp contract is the most liquid instrument on Deribit, with $550m of open interest and $1.35B of peak daily volume YTD. On the other-hand, the usdc-perp could barely see $7.5m of open interest and peak daily volume of $20m YTD.
LYRA Protocol
The Lyra protocol is an AMM based DeFi options venue. Although, at first glance, AMM based solutions might not seem appropriate for options, Lyra is a smart-AMM built specifically for option pricing.
We’ll first highlight a few key features of the Lyra AMM option pricing then focus on adoption and trading data.
Lyra is an EVM based protocol that launched trading on Optimism in June 2022 and trading on Arbitrum in January 2023.
Key contract specs:
- European cash-settled options with no “failed to exercise” risk.
- Oracle prices used for settlement.
- 1x multiplier.
- 8am UTC expiration cycles identical to Deribit.
- Trader’s can either “sell to open/close” or “buy to open/close” option positions against the AMM.
There are key trade-offs between AMMs and Central Limit Orderbooks when working with DeFi options.
Although a CLO solution is the most logical approach to replicating a CeFi trading experience on-chain, there are unique hurdles that market-makers face when dealing with blockchain infrastructure.
- Throughput on-chain is much slower than CeFi exchanges like Deribit. This means market-makers will be slow to refresh quotes and can easily get “picked-off” in a fast moving market.
- The gas costs of refreshing quotes on-chain adds substantial expense compared to CeFi.
- Lastly, the nail in the coffin for market-making enterprises on-chain is the nascently low volume, making it impossible to justify the higher costs.
This is where an AMM solution greatly thrives. Assuming an AMM has an efficient pricing engine (more on that later) the ability to attract market-making capital via a passive on-chain solution has proven to be robust.
There’s an extensive supply of LP capital looking for native, self-custodied, on-chain, yield generating opportunities.
Lyra AMM
Options are not linear instruments.
This means that the “constant product” pricing engines, like those found in Uniswap, are not a viable solution for option AMMs.
Lyra has overcome these challenges by building a smart-AMM, focused on pricing the volatility surface.
Key AMM pricing engine bullet points:
- LPs deposit stablecoin into the AMM pool and receive a pro-rata share of assets.
- LPs can initiate a withdrawal of funds anytime but are subject to a 3-day lockup.
- There is no IV oracle, Lyra’s volatility surface is determined natively through trading flow.
- If delta rebalancing thresholds are met (net exposure outstanding and a 6h time constraint) anyone can call to trigger a delta hedge on behalf of the pool.
- As the AMM accumulates Vega exposure, traders will be charged an additional fee if their flow increases the AMM’s Vega risk.
- Traders in fast markets (high vol-of-vol) will incur an additional “variance fee” to compensate AMM LPs.
- Beyond these bullet points I want to explore the core concepts of the Lyra AMM volatility pricing engine.
1. Base IV
As traders execute against the AMM, flow will impact the volatility surface in a parallel manner, moving overall volatility up/down.
2. Skew Adjustment Factor
Out-of-the-money options will also have a Skew Factor in addition to the Base IV impact. This means that option flow in the wings will both impact overall IV levels and the curvature of the wings.

3. Standard Size
The AMM will adjust the volatility surface, due to the impact from trading flow, once that flow meets a minimum size threshold, known as the Standard Size.
Taken together, option prices are derived from a volatility surface, then translated into $USD and offered by the AMM to traders.
The AMM doesn’t need to constantly refresh quotes and incur expenses while no one is trading.
4. Variance Fee
Since traders have the ability to time their trading participation against the AMM, the AMM is subject to adverse selection. The AMM must stand ready to trade at all times.
As the outside world reacts to news, and events the AMM vol surface might become stale.
Here, in order to protect LPs of the AMM, we introduce the Variance Fee.
Lyra’s AMM will compare the current Base IV to its geometric-weighted-average-value over time.
As the current Base IV diverges from the GWAV, a Variance Fee is introduced to account for fast markets. The greater the divergence, the greater the fee.
This is the functional equivalent of traditional market-makers widening their quotes in a fast market.
As time goes by, the Base IV and GWAV will naturally converge causing the Variance Fee to decay away.

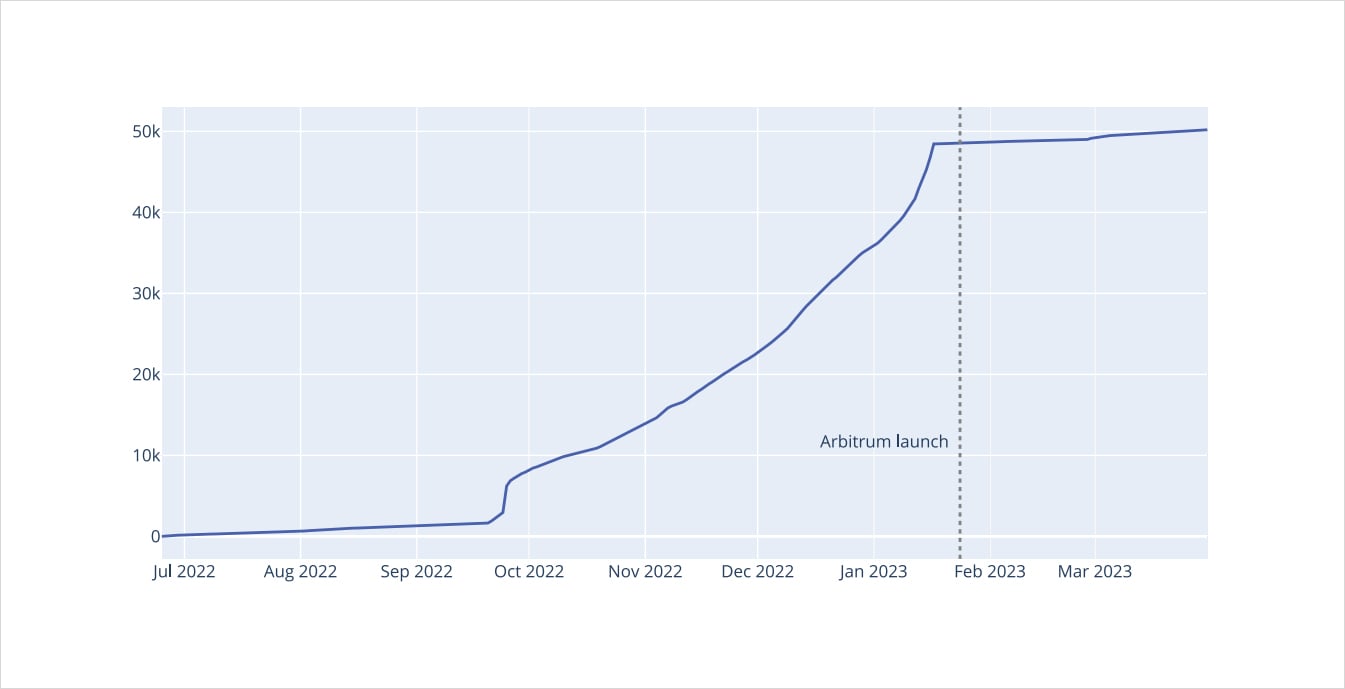
Lyra Number of Unique traders
Lyra Number of Unique Traders (10 Trades per Wallet)
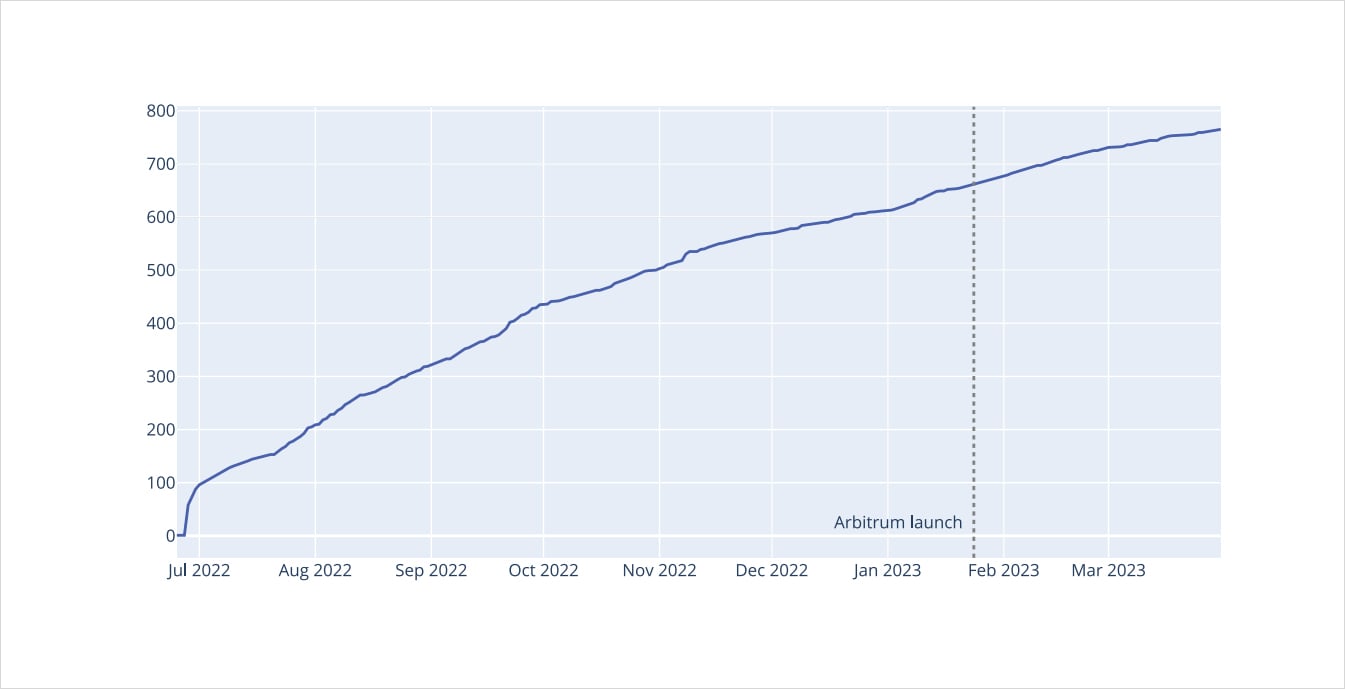
Using our Amberdata endpoints, we are able to track the growth rate of unique wallets trading on Lyra since the Optimism launch in June 2022.
One of the peculiarities that instantly catches our attention is the parabolic growth of unique wallets into the Arbitrum launch, then a flat-line for growth.
After further investigation, it turns out that the most likely culprit was growth from an “Op Quests” promotion that enabled users to unlock an NFT.
We can attempt to get a clearer picture of organic user growth by tracking unique wallets that have made at least 10 trades instead. Here we see a normal growth pattern for active Lyra traders.
Lyra Pricing VS Deribit
Lyra IV Traded Difference Compared to Deribit DTE Cluster
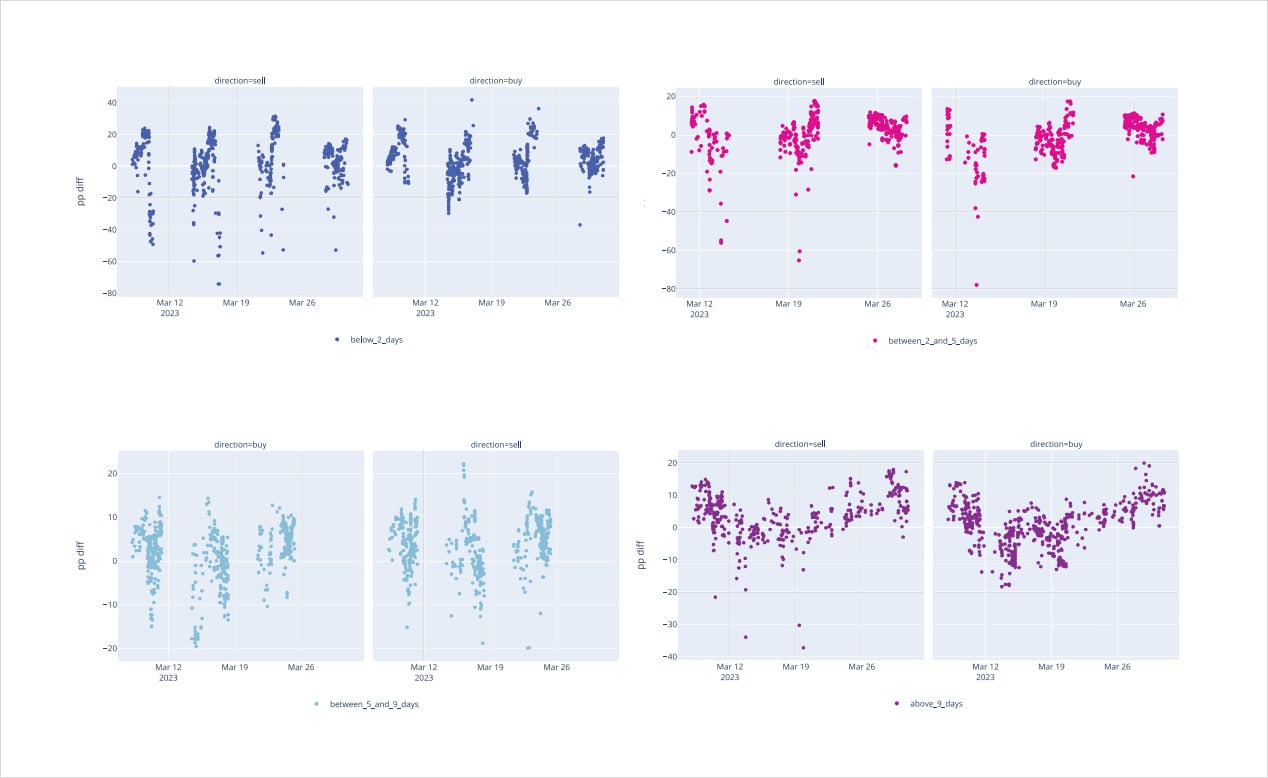
Looking at Amberdata’s historical times and sales data for Lyra, along with the associated implied volatility, we are able to compare traded vols on Lyra versus the respective Mark IV on Deribit for the same instrument and time.
We’ve segmented the Lyra trades into buys/sells and broke out the options into four distinct dte (days to expiration) buckets: 0-2 dte, 2-5 dte, 5-9 dte, 9+ dte.
One clear pattern that quickly emerges is as we extend option maturities, Lyra traded vols cluster more closely to Deribit marks.
This is logical because as options approach expiration, their premium values quickly diminish and small changes in dollar price translate to large changes in implied volatility.
Another important observation is that the distribution of flow is equally and symmetrically distributed around Deribit marks (mark iv).
Opportunity for both natural flow and opportunistic arbitrage clearly exists.
Given that we have a passive AMM pricing volatility completely organically, the efficiency of the Lyra AMM is extremely impressive. Lets not forget that March 12th, 2023 was mired by the SVB banking crisis as well. The AMM not only functioned through the ordeal, but the traded volatilities were inline with Deribit marks.
Notional Volume
Lyra Total Notional Weekly Volumes
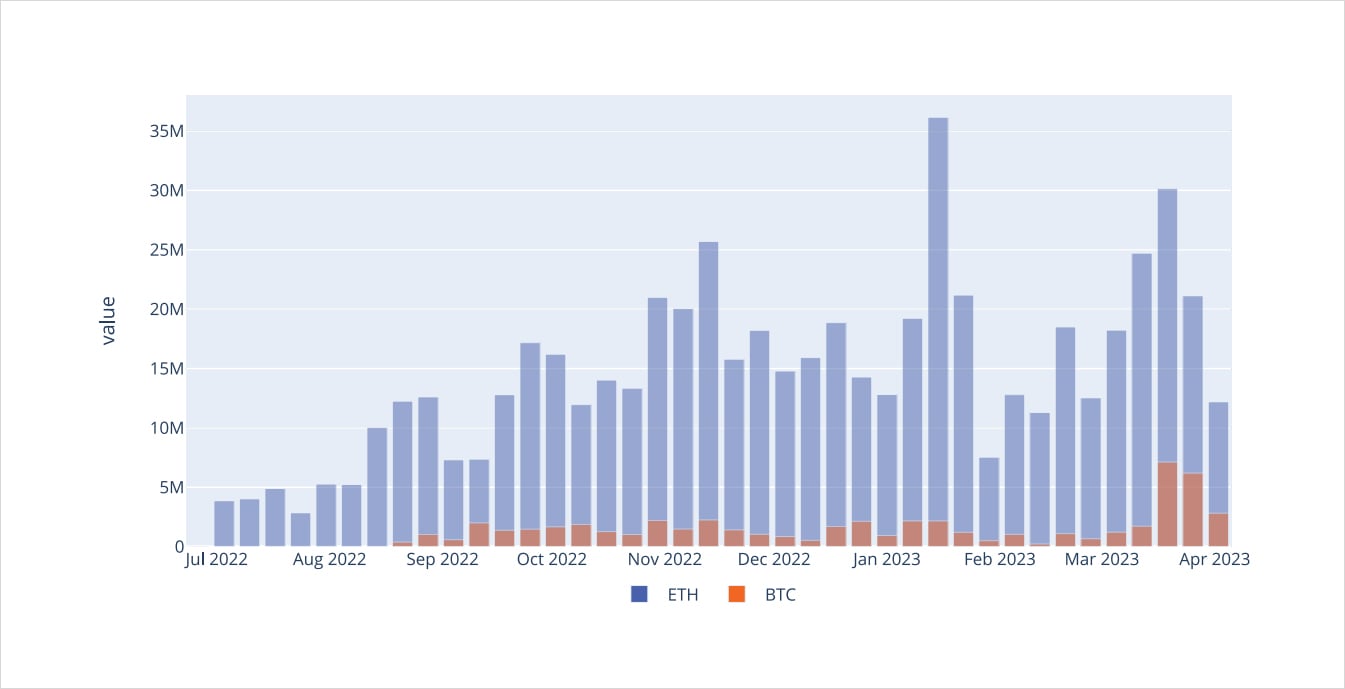
More important than unique wallet growth overtime is the amount of notional volume.
Lyra is an EVM based protocol, therefore it’s no surprise to see ETH as the main trading asset, although BTC volume quickly grew (especially in percentage terms) around the SVB crisis.
Lyra Percentage Distribution Calls/Puts (Positive Bought / Negative Sold)
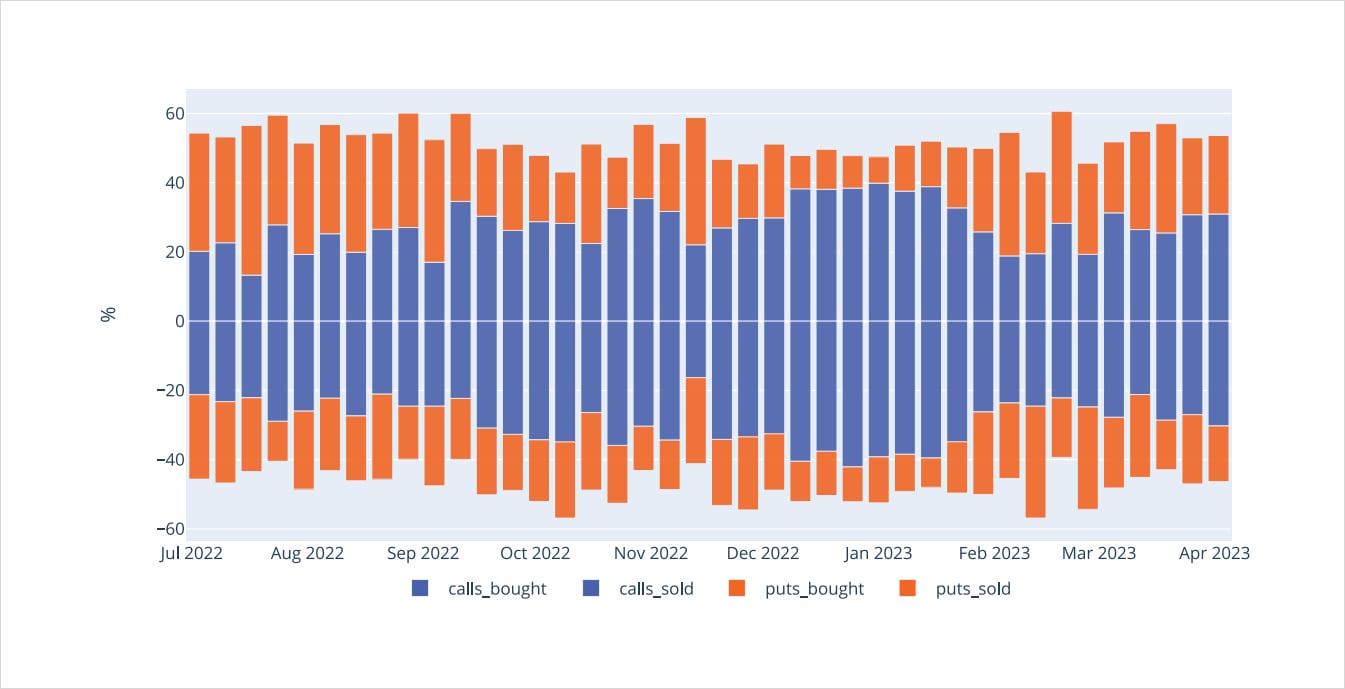
Breaking out the flow into percentage buckets, we can see that around 65% of the flow is found in call trading. We can also see a slight preference, around 55%, to option buying rather than option selling.
Conclusion
All in all, we’re very impressed with the Lyra protocol as a DeFi option trading solution.
Building an efficient option pricing engine is complicated, especially in a volatile asset class riddled with fast markets.
The appetite for persistent, passive yield, in a self-custodied manner, is insatiable in crypto.
The reward for building a good AMM is an ever-running fountain of market-making capital supply.
Note: Author personally owns about $5k of Lyra Tokens at the time of this writing.
Systematically Trading Crypto 0DTE Options: Playing With Fire
Over the past several months, there has been a noticeable rise in the volume of 0DTE options being traded in traditional financial markets. As indicated in the name, “zero-day to expiry” (0DTE) options mature on the same day and are commonly used by traders to gain leveraged market exposure while paying a low premium. Although the premiums for these options are low in dollar terms, the theta decay associated with 0DTEs is extremely rapid to the detriment of buyers. According to Goldman, in SPX option markets these 0DTEs made up over 40% of trading volumes in Q4 2022 as shown below.
44% of SPX volume in Q3/Q4 has had less than 24 hours to maturity
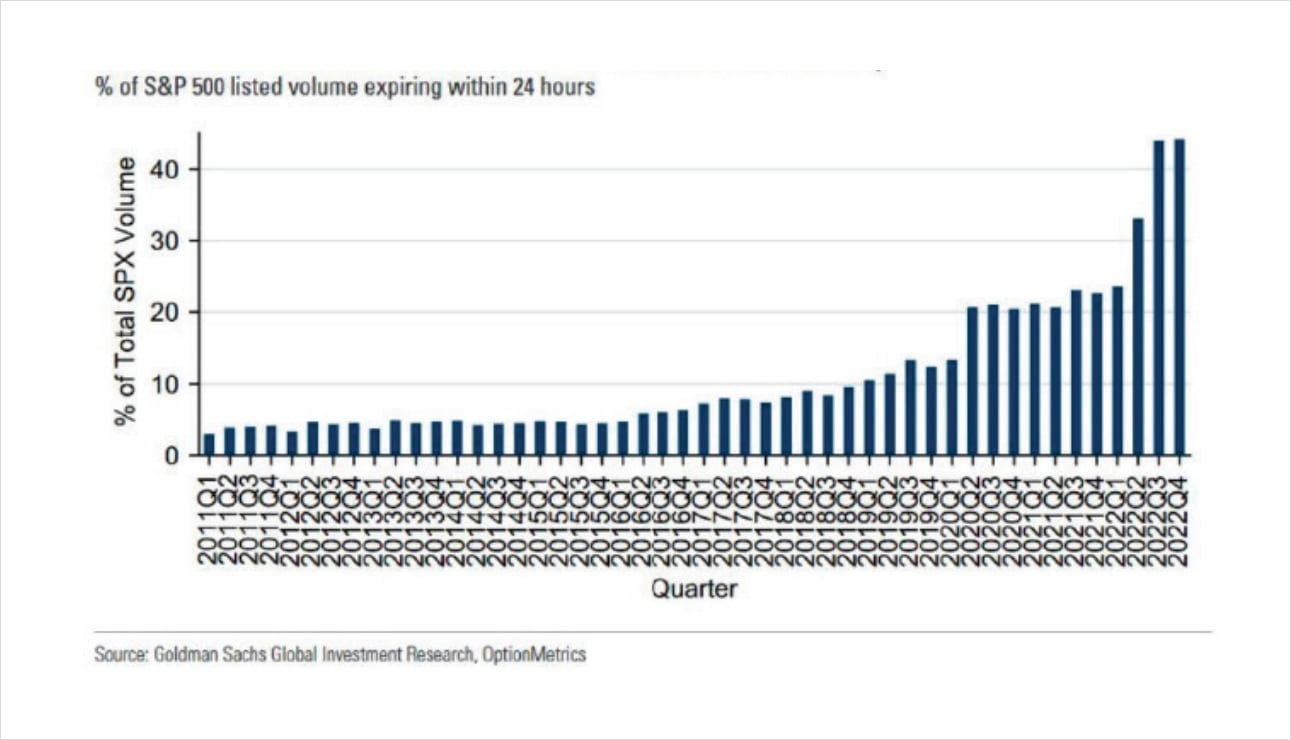
JPM also conducted a comprehensive study on this phenomena and concluded that the rise in 0DTEs can largely be attributed to HFT and algorithmic traders seeking to monetize intraday price-action using levered instruments. In the same study, concerns were brought up suggesting 0DTEs can materially impact market stability due to the sheer notional volume of these leveraged short-dated products. Based on JPM’s quant models, even a moderate move in the market could have a cascading domino effect on the broader market as a result of market-makers hedging their gamma risk. While their concerns do have merit, there have been rebuttals from other firms such as BoA indicating these “Volmageddon 2.0” risks are overblown given the 0DTE risk is cleared during the same day. Furthermore, the short-volatility positioning in the “Volmageddon” blowup during 2018 took several years to accumulate before imploding the VIX ETN space.
Although both parties make compelling points, the goal here is to identify whether we can make money from trading crypto 0DTEs in a way that doesn’t blow up our portfolio. The JPM researchers explored trading the 0DTEs on an intraday basis and found there was some advantage to trading these products if performed on a higher frequency time horizon.
One key thing to keep in mind is that option market-makers in crypto have a much smaller impact on spot prices compared to traditional dealers such as Citadel trading markets on SPX options. Therefore, the risk of a “Volmageddon” event occurring in crypto stemming from 0DTEs, let alone general systematic option selling, is highly unlikely as the options market is still developing. Furthermore, the crypto options market is nowhere close to having the same liquidity and trading infrastructure compared to SPX, therefore, it’s highly unlikely any HFT or ultra-short term strategy will reap any sustainable profits in crypto until similar advancements are made.
As a result, the goal of this research piece will be to trade 0DTE crypto options on a longer time-horizon without the need for HFT infrastructure. Notably, systematically selling volatility is a common strategy employed by many traders, therefore, we’ll study different regimes to determine optimal conditions for trading this particular strategy.
Overview of Backtest Modeling
The goal of this strategy is to systematically sell 0DTE straddles while hedging the position’s net delta on a dynamic basis.
- For each day, sell 1x ATM call and 1x ATM put option with an expiration less than or equal to 24 hours on Deribit. All positions are held straight into expiration with no early exit.
- All option trades will be executed at the top of the book best bid price.
- At the beginning of each trade, the net delta of the position will be hedged flat. At each hourly timestamp, if the price of the underlying changes more than a threshold of 2.50% since the last hedge, the model will then perform another delta hedge to bring the net delta back to zero.
- All P&L will be coin-denominated, therefore, no conversion back into USD or adjustments of deltas will be required.
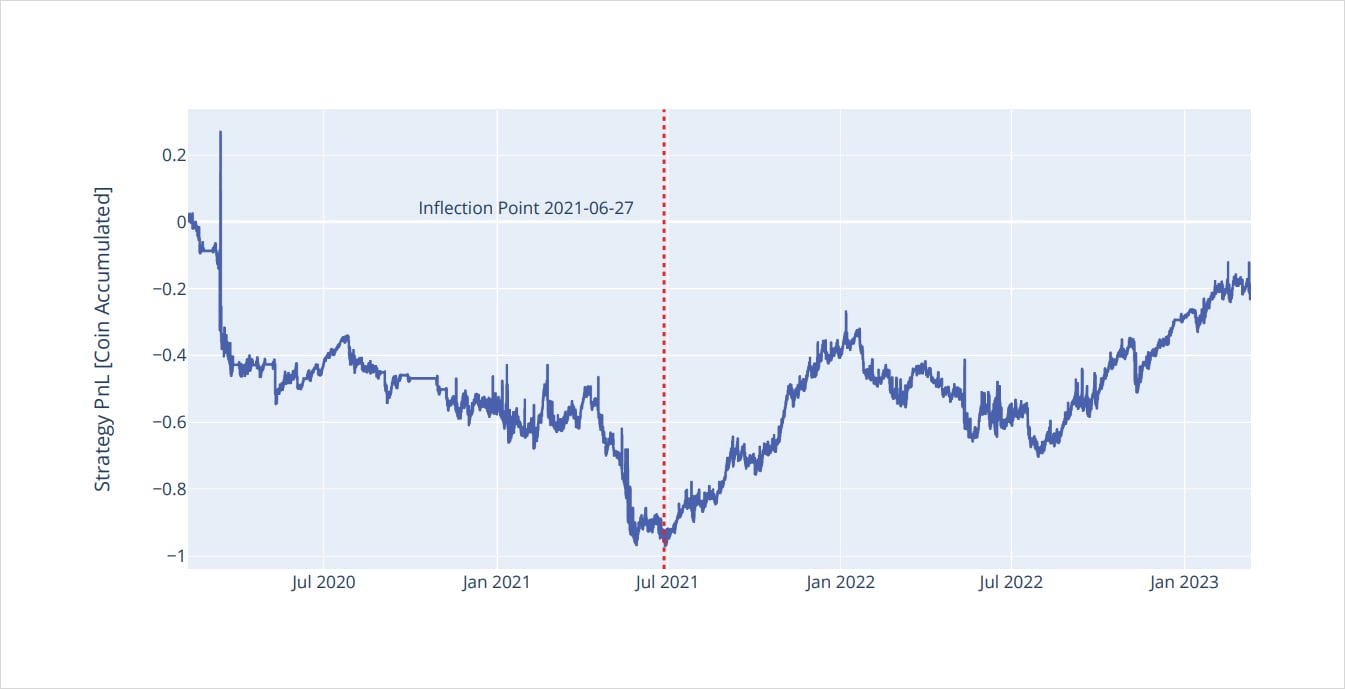
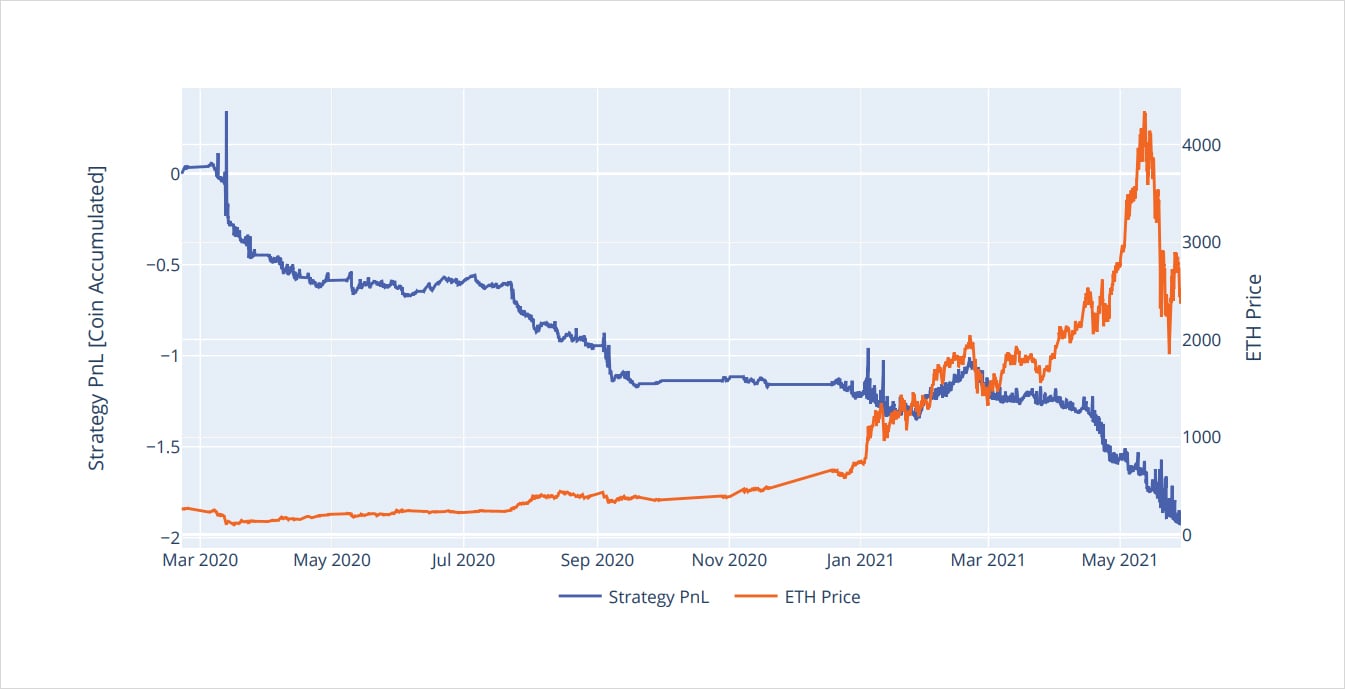
BTC Strategy performance: 2020-02-07 to 2023-03-12
ETH Strategy performance: 2020-02-07 to 2023-03-12
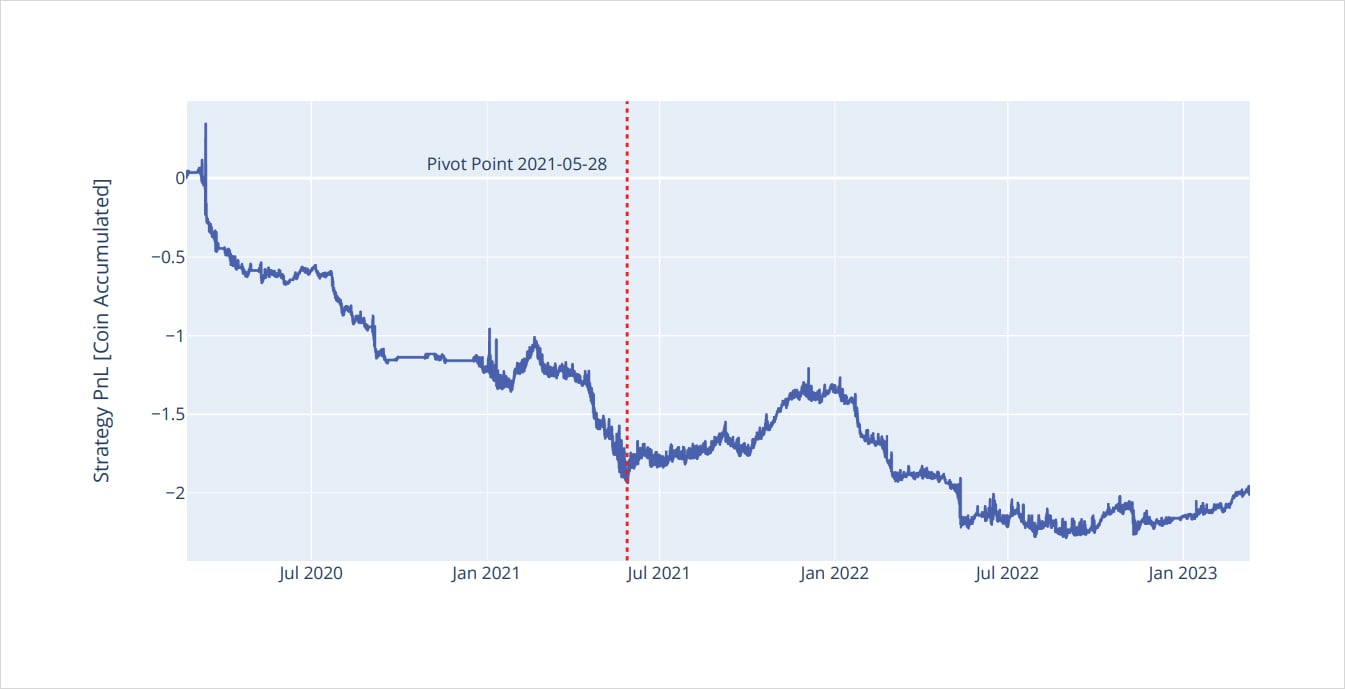
Things get a bit more interesting when we start to dissect the different regimes for this strategy. Although we are cherry-picking regimes based on past performance, this process can help us better understand periods when deploying this strategy makes sense. The vertical red lines on the plots above for both ETH and BTC correspond to key inflection points which were discretionarily selected to identify where the strategy experiences a pivot due to a regime change. Although these inflection points are not the exact same date for BTC and ETH, they are close enough for us to distinguish between the two different regimes.
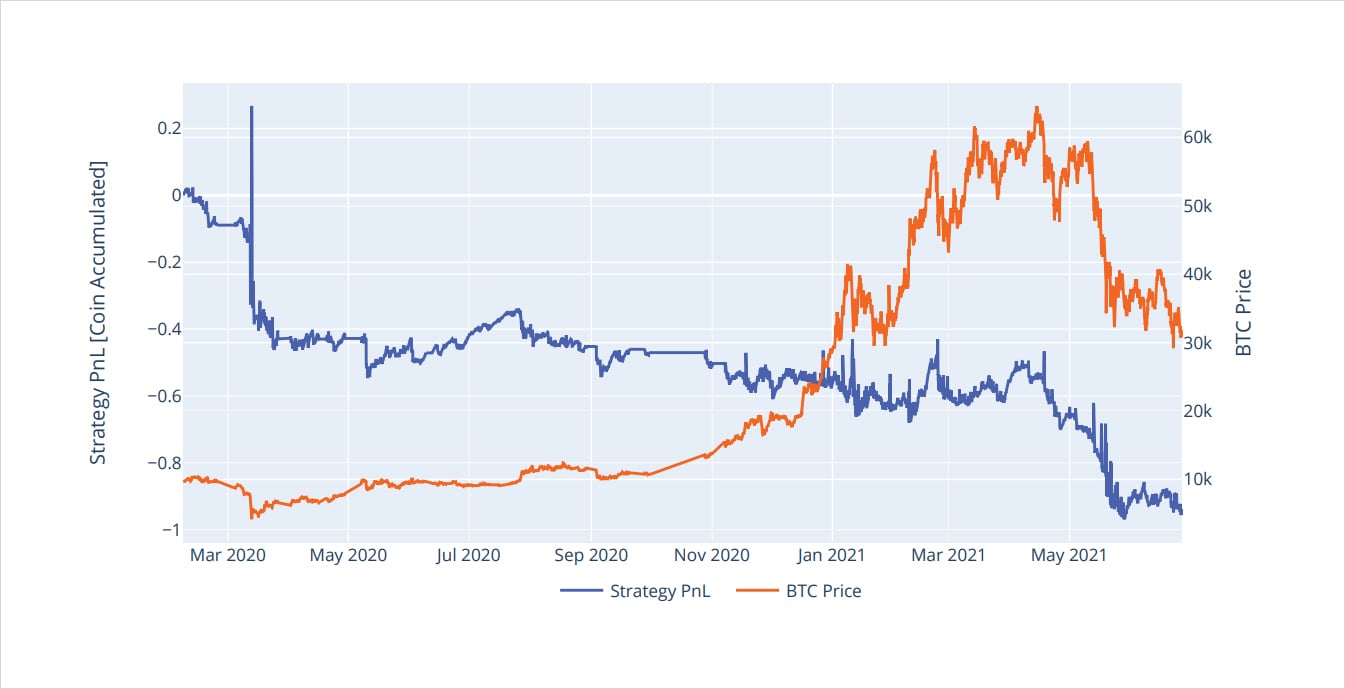
Regime #1: Bull-Run: Start of COVID to Summer of 2021
During this regime risk assets were bid up due to easy monetary conditions. Furthermore, we saw a massive flood of institutional capital piling billions of dollars into crypto which was led by Michael Saylor’s aggressive accumulation of BTC for Microstrategy’s balance sheet. Throughout this period we saw incredible volatility with massive intraday price action. Given the strategy we are running is effectively short gamma on a daily basis, the violent intraday moves during this volatile market regime would have resulted in consistent losses being accumulated over time (not to mention the risk of being exposed to infinite downside and upside losses associated with selling straddles).
BTC Strategy performance: 2020-02-07 to 2021-06-27
ETH Strategy performance: 2020-02-07 to 2021-05-28
Regime #2: Summer of 2021 to Today
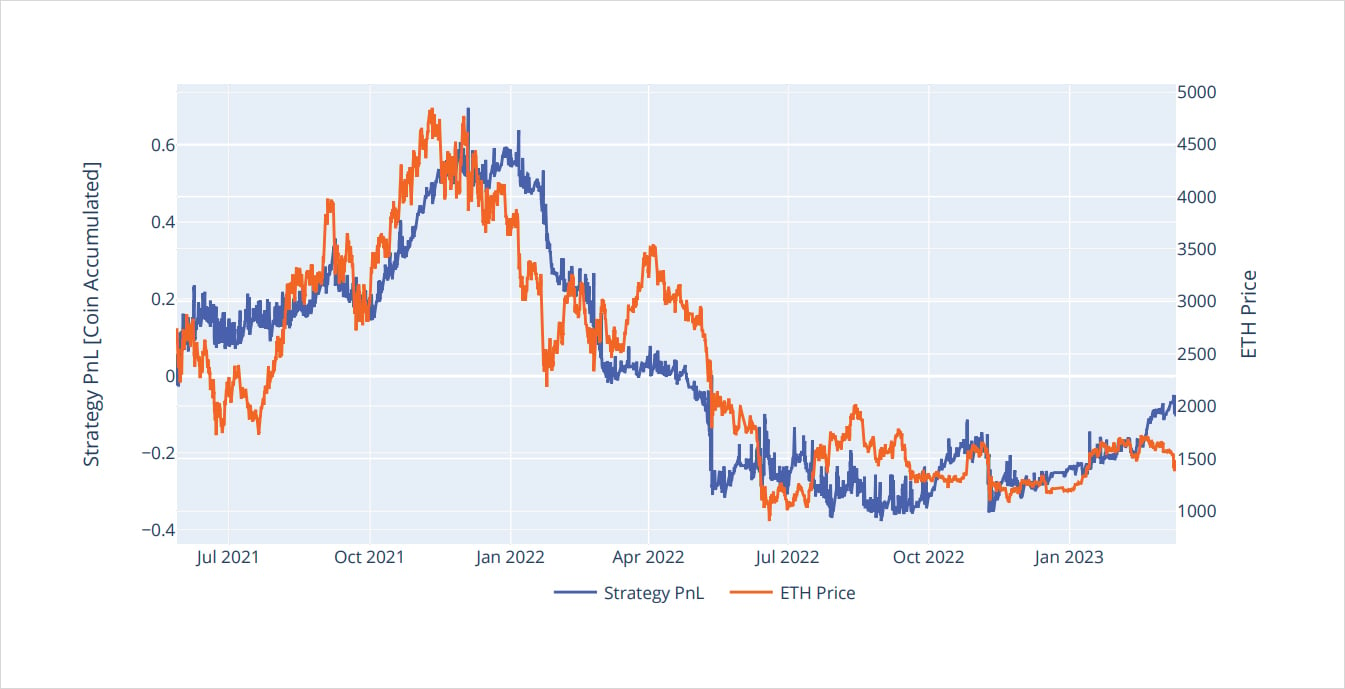
During this second regime we experienced the final innings of the bull market and a collapse in all crypto prices. Despite all the tail events during this regime such as the 3AC fallout, UST imploding and FTX collapsing, the BTC 0DTE selling strategy surprisingly performed decently well. There were still steep drawdowns when markets were volatile around these pivotal events, however, periods of choppy price action allowed the strategy to accumulate sufficient P&L by selling these super short-dated options. Unfortunately the same cannot be said for ETH. Despite being exposed to mostly the same events and market risks, ETH’s 0DTE option market behaved completely differently from BTC and failed to generate sufficient yield from option selling during periods of choppy price action.
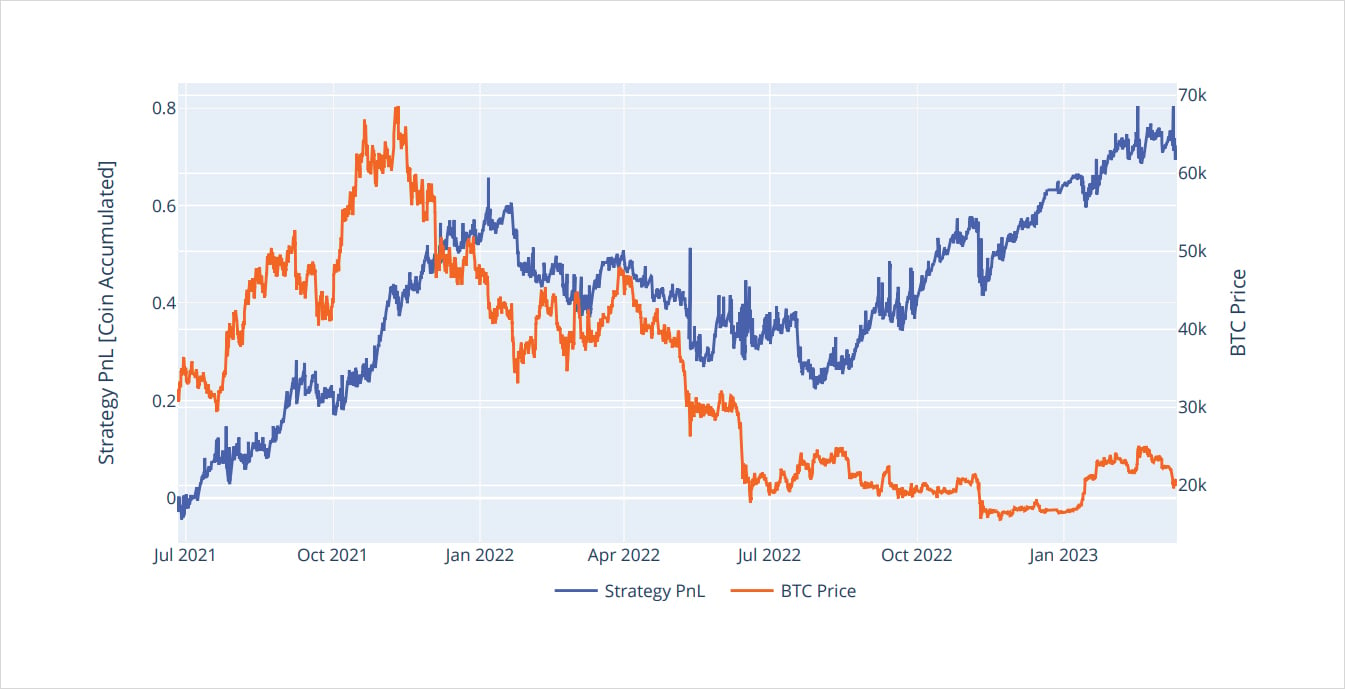
BTC Strategy performance: 2021-06-27 to 2023-03-12
ETH Strategy performance: 2021-05-28 to 2023-03-12
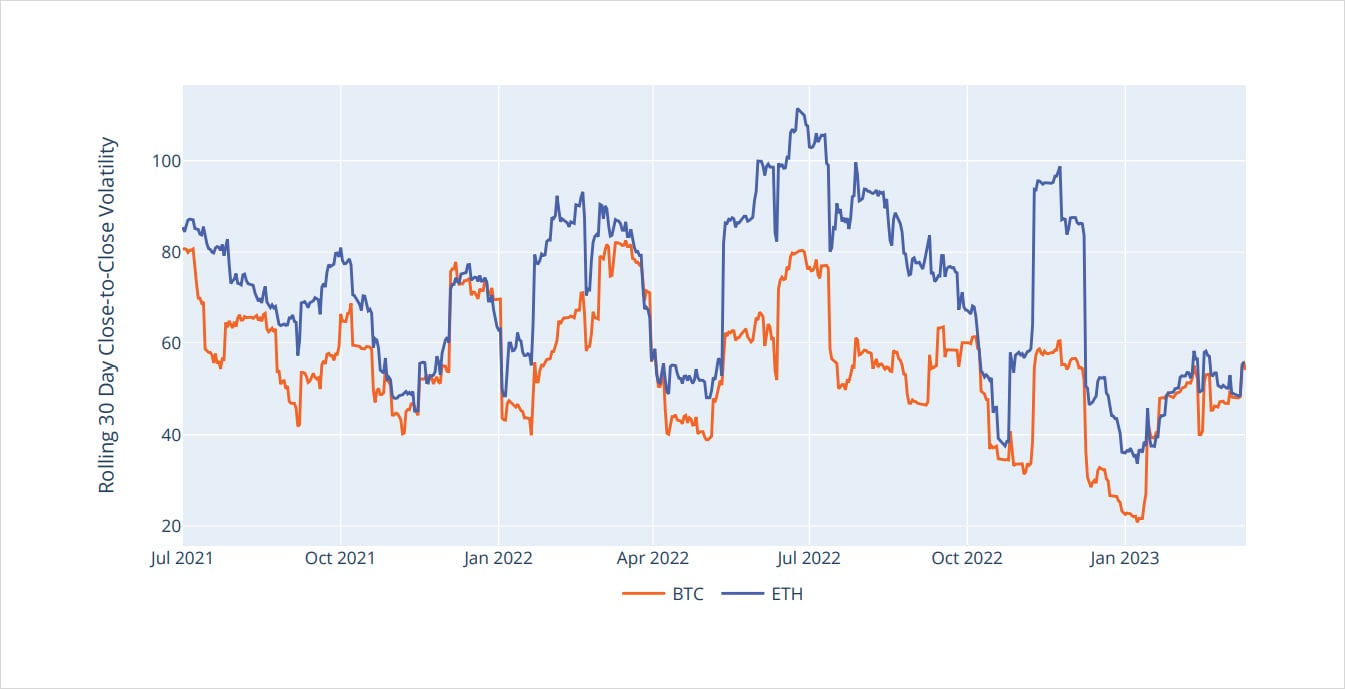
A potential reason for this stark difference in performance could be the fact that BTC was inherently less volatile than ETH during this specified time period. Specifically, on average ETH was 1.30x more volatile than BTC based on a rolling 30 day volatility metric. As such, it’s likely BTC’s lower relative volatility was the main reason the 0DTE selling strategy performed so much better during this period compared to ETH. Furthermore, it’s commonly observed that liquidity on Deribit tends to be superior for BTC options relative to ETH, therefore, executing at better bid prices for BTC may have been another contributing factor for its outperformance.
Rolling 30 day realized volatility: 2021-06-27 to 2023-03-12
Concluding Thoughts
Overall, it’s important to note that identifying these regimes is where most of the edge lies in running a shortvol or mean-reversion strategy. There are a variety of quantitative and discretionary tools used to identify these regimes such as the Hurst exponent or other technical based indicators which could filter out non-ideal trading conditions. We observed that for both BTC and ETH, selling 0DTEs during a wild bull run associated with high volatility is very unprofitable. Conversely, for BTC specifically, the best environment to sell 0DTEs is when BTC is experiencing choppy/bearish price action as we’ve witnessed over the past several months. Furthermore, in practice traders have to acknowledge liquidity for these 0DTEs may not be ideal, therefore, using an OTC or RFQ service such as Paradigm could be one tactic to help reduce adverse slippage of this strategy.
Disclaimer
The information contained in this report is provided by Amberdata solely for educational and informational purposes. The contents of this report should not be construed as financial, investment, legal, tax, or any other form of professional advice. Amberdata does not provide personalized recommendations, and any opinions or suggestions expressed in this report are for general informational purposes only.
Although Amberdata has made every effort to ensure the accuracy and completeness of the information provided, it cannot be held responsible for any errors, omissions, inaccuracies, or outdated information. Market conditions, regulations, and laws are subject to change, and readers should perform their own research and consult with a qualified professional before making any financial decisions or taking any actions based on the information provided in this report.
Past performance is not indicative of future results, and any investments discussed or mentioned in this report may not be suitable for all individuals or circumstances. Investing involves risks, and the value of investments can go up or down. Amberdata disclaims any liability for any loss or damage that may arise from the use of, or reliance on, the information contained in this report.
By accessing and using the information provided in this report, you agree to indemnify and hold harmless Amberdata, its affiliates, and their respective officers, directors, employees, and agents from and against any and all claims, losses, liabilities, damages, or expenses (including reasonable attorney’s fees) arising from your use of or reliance on the information contained herein.
THANKS TO
Greg Magadini – CFA, Fabio Bassani, Tony Stewart, Euan Sinclair, and Samneet Chepal – CFA