
BTC has reached its highest price YTD, finally breaking through the $12,000 price resistance level! This comes nearly two months after the September price crash when BTC retraced to $10,000 level following a then-record price. Since then, the price has been slowly trending up, with monthly volatility increasing to 43%, up from 33% on Wednesday – its three month low, previously observed in late July. The ETH market has followed a similar pattern.
The steady growth of BTC comes during the global Covid-19 crisis and can be partially attributed to more institutional investors entering the market. However, this also introduces new risks. 2020 was the year when BTC reached its highest correlation with the S&P 500. On Wednesday, the one-month BTC-S&P 500 correlation was only at a mere 7%. However, the annual correlation has remained at a moderate 45% level. As near-term global Q4 outlook remains inconclusive, a market pull-back or accelerated recovery could yet again test the crypto safe haven thesis.
When equity markets experience significant unexpected price drops, investors tend to close the positions on their best performing assets to cover their losses on other assets. BTC has been outperforming most assets this year, thus in case of another market downturn, BTC could suffer similarly as it did in March. Therefore, falls in the stock market could trigger profit taking on BTC. This delicately poised position suggests that there are opportunities with volatility so low and skew quite flat.
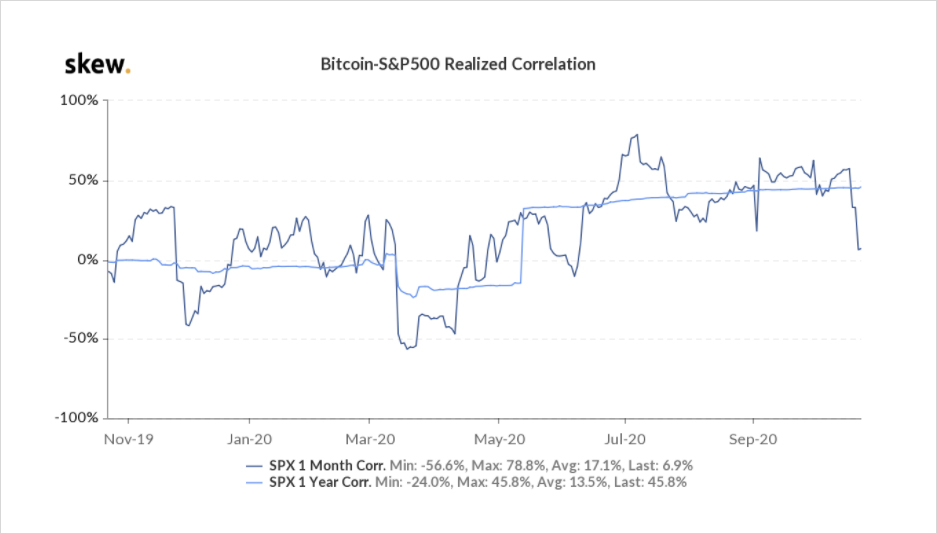
S&P 500 & BTC Realised Correlation (1 Month and 1 Year).
Macro Outlook
Upcoming months could bring significant changes to the current Covid-19 pandemic recovery cycle. The most discussed event – the U.S. presidential election is only two weeks away. However, its impact on the global economy could be relatively short-lasting, while stalling growth of the tech sector, delayed efficacy data on Covid-19 vaccine, and further postponement of Covid relief could cause longer-lasting shockwaves to the global economy.
The impact of changing expectations of the U.S. election result can also be observed in the S&P 500 VIX November future, which has decreased from its closing value of 36.15 on September 3, to 29.85 on October 20. The fear of uncertain election results and how long this ambiguity might last could explain the spike in expected volatility after the election day. Nonetheless, with more polling data, this fear has decreased, yet the overall volatility levels remain high with S&P 500 VIX December future at 29.1 and January future at 28.6. The average VIX in the past ten years has varied from 15 to 20 volatility points.
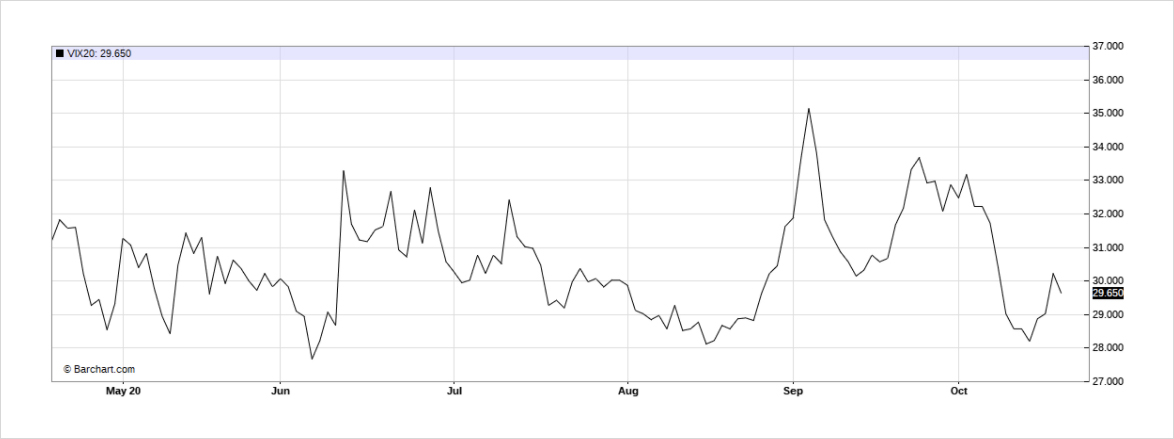
S&P 500 VIX November Future Price.
The expected volatility in global markets shows that there might be more tumultuous months to come, and due to increased correlation with crypto in 2020, crypto traders should be aware of the risks. Typical elections are always associated with increased volatility. Therefore the options expiring the days after the election are always trading with premium to those with longer expiration dates to compensate the volatility sellers for more significant price shocks and low time value remaining.
During the first week of October, the December 18 options were trading 2 volatility points higher than the November 4 options*, unusual pricing for the election period. However, these expectations have changed in the past two weeks, as now only the November 9 options are trading with 0.5 volatility points premium to November 4 options. The change in premium structure shows that this election is expected to have a similar impact on the market, while the longer-dated expected volatility suggests more impactful events to come.
Impact on Crypto
The table below shows the 10 best and worst S&P 500 trading days by returns in 2020, and the returns of BTC and ETH on the corresponding days.
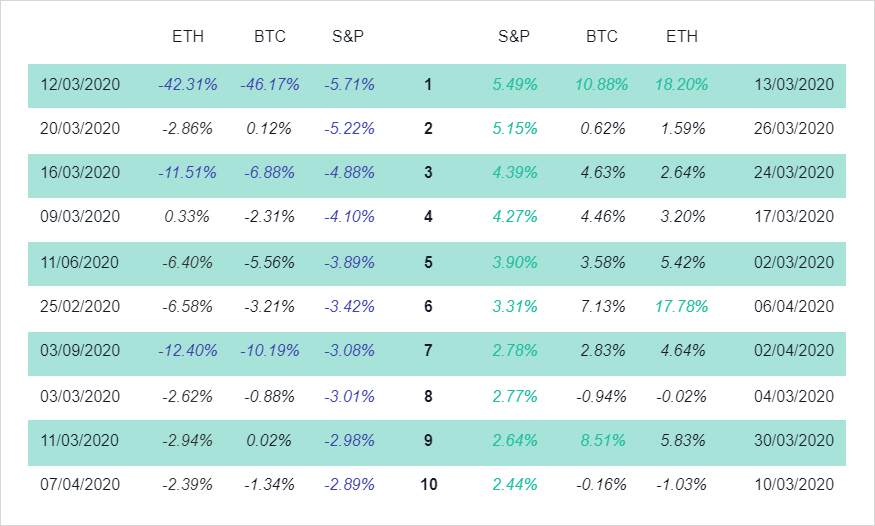
S&P 500 – 10 Best and Worst Trading Days by Returns.
30% of the worst trading days and 20% of the best trading days for BTC and ETH coincide with S&P 500, demonstrating that market shocks can have a consequential impact on crypto markets, with decreases in price more pronounced than increases. BTC and S&P 500 one month correlation increased to 79% in mid-July. Due to this, monitoring large macro events that could affect your crypto portfolio is an essential aspect for limiting the downside price risk.
What Could Shake Up the Markets?
Tech – has been the main driver behind the stock market recovery throughout the Covid-19 crisis. However, over-reliance on one sector can cause a significant market pullback if the growth of that particular sector was to decline. Tech sector has outperformed the broader market for over a decade, and the fast-paced growth might no longer be sustainable. Especially with the personal computer industry over performing in the past 3 quarters despite otherwise low growth, and the harsh criticism of Section 230 (protection of free expression) aimed at IT companies. Stricter regulatory measures and return to pre-Covid growth rates might cause a sharp drop in expected earnings, and cause a downward price pressure on the whole index. In recent weeks, more hedge funds have started to short this sector, singling a shift in the market sentiment.*
Biotech – Covid-19 vaccine could finally allow the world to return to its normal way of living. Therefore it is no surprise that markets rallied up with the news of the first expected results of Phase 3 efficacy trials around the end of November. However, Johnson & Johnson and AstraZeneca – two of the leading developers of the Covid-19 vaccine have previously faced trial setbacks. If more issues were to arise, more delays might cause an overall bearish market outlook.
US – While there still is no agreement on the stimulus deal, the market has been recovering without any significant liquidity injection into the economy since May. Currently, the US Treasury General Account has accumulated more than $1.68 trillion, ready to be released into the US economy. This could cause a positive boost and accelerate the overall market recovery, and benefit BTC due to potential fear of inflation.
Expected BTC Market Activity
An active options market can reveal a lot of information about the underlying market and can provide valuable insights into how to adjust your trading strategy, taking into consideration the widespread market expectations. Implied volatility allows us to analyse the market outlook of crypto traders, as it is a forward-looking measure derived from the market price of an option. When plotted against expiries, it demonstrates the expectations of market uncertainty over time and the potential market impact of a specific event. This is known as the term structure of volatility and can be compared to the term structure of bond interest rates across the maturity spectrum.
The picture below shows the term structure of Deribit BTC options. Due to the time value of options, the term structure tends to be upward sloping. However, the humps demonstrate an expected sharp price movement in a particular period of time. Similar to the traditional markets, the BTC market has priced in potential volatility in the election week of October 30 until November 6. The increased volatility is expected to continue at least until the end of Q4.
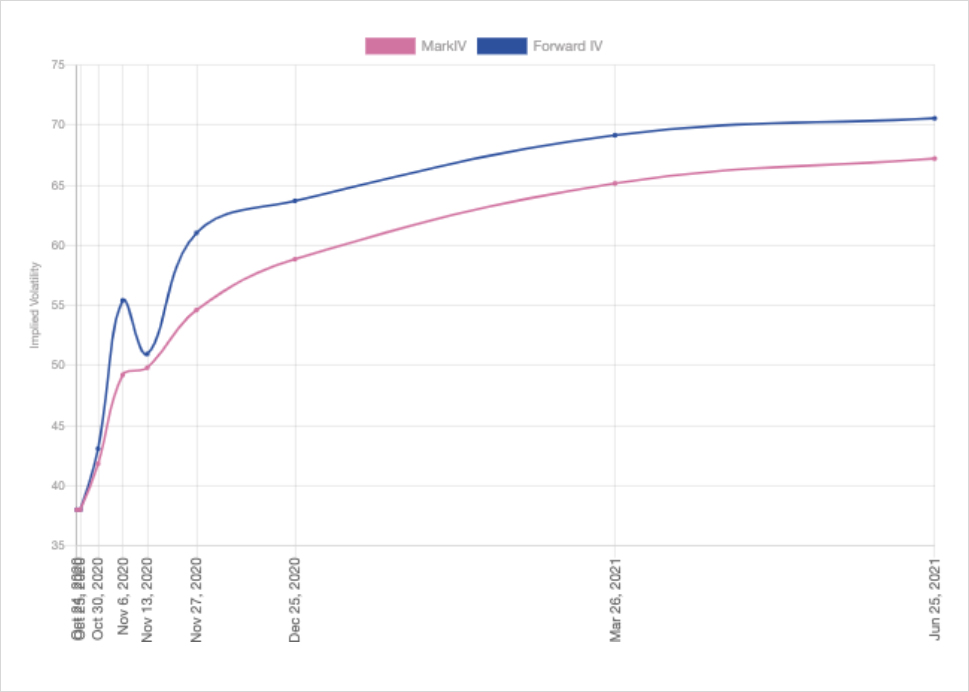
BTC Orderbook Term Structure by Genesis Volatility.
Implied volatility can be used as an unbiased estimate of the future realised volatility, and can be the building block of your trading strategy, considering your own expectations of the market.
Volatility Trend
The week started with BTC daily implied volatility reaching its lowest value YTD – 2.9%. And although it bounced back soon after, it is still 15% below the annual average due to the past sideway market activity. ETH implied volatility followed a similar pattern, however, due to slowing down of the DeFi hype in the early fall, its implied volatility has dropped even below its realised volatility.
As volatility is known to be mean-reverting (a trend that has been observed in crypto markets – low volatility periods followed by significant volatility spikes), the current volatility displays a good entry point in crypto options markets.
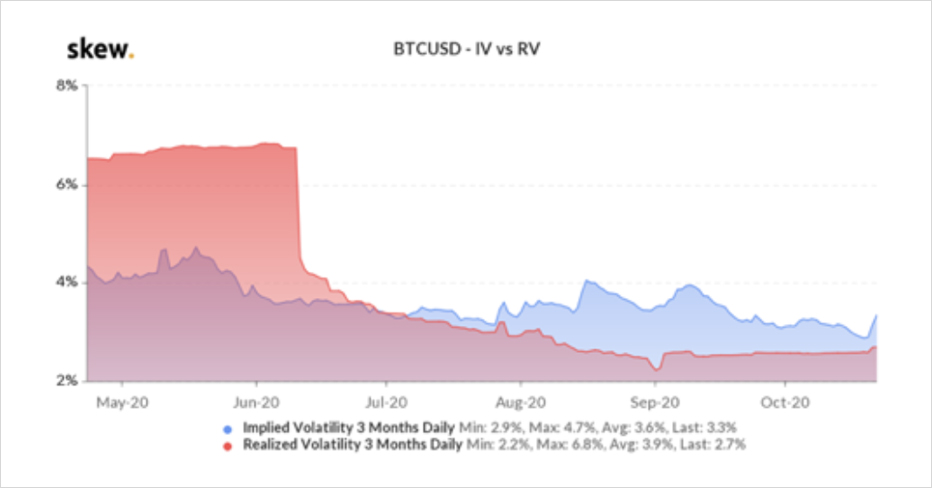
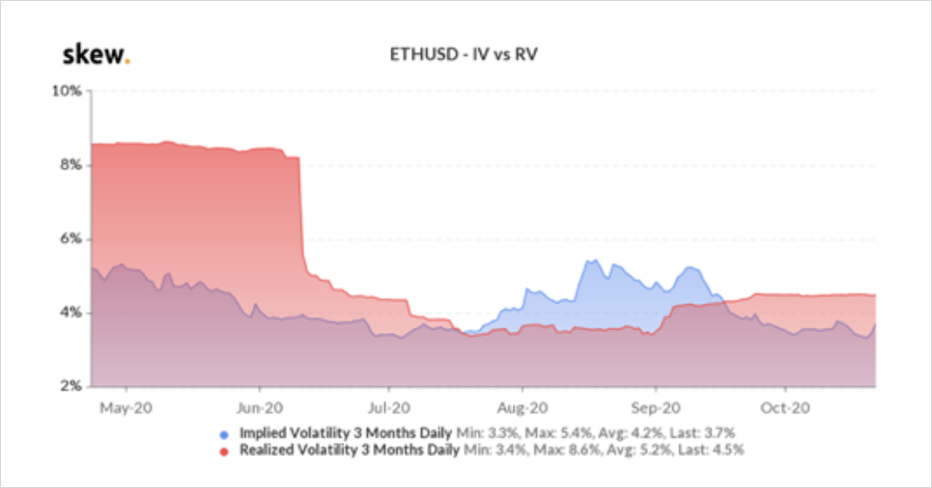
BTC and ETH Daily Realised and Implied Volatility
After the latest price spike, the crypto market is bullish, displaying a -9.1% 25-delta skew premium. A significant shift from the 9.6% 25-delta skew premium only a month ago. Although crypto traders are known to be more risk-tolerant, it is in sharp contrast to the 9.8% 25-delta skew premium for SPY, where market sentiment has turned more bearish with the election coming closer and uncertainty growing. Crypto traders who are more risk-averse can benefit from this by using options to hedge their market exposure during potentially turbulent macro events – such as the upcoming election. And roll over their positions according to the changing market sentiment to minimise the high premium costs of long-term options.
Those who do not have an opinion on price direction, but believe in increased volatility can benefit from multiple volatility trading strategies. More experienced traders can benefit from dynamic hedging, gamma scalping and volatility arbitrage between highly correlated assets such as ETH and BTC. While the first time volatility traders can bet on large price moves by using straddle and strangle strategies that have a limited risk profile, yet significant upside potential. Or risk reversals to trade skew.
Uncertain times require more advanced trading strategies, and crypto options can provide the flexibility you need!
Ulla Rone
Business Development Manager at Deribit
AUTHOR(S)
