
Implied volatility has broken its months-long downwards trend as the most recent spot action has resulted in a moderate increase in realised volatility.
ETH volatility has continued to trade just below that of BTC, having traded at a volatility premium for much of its derivatives markets history. Despite incredibly strong spot performance in 2023 by both assets, BTC’s and ETH’s volatility smiles continue to price up- and down-side protection at similar levels, continuing a trend of skew being capped from above that we have observed since mid-2021.
Volatility Turns a Corner
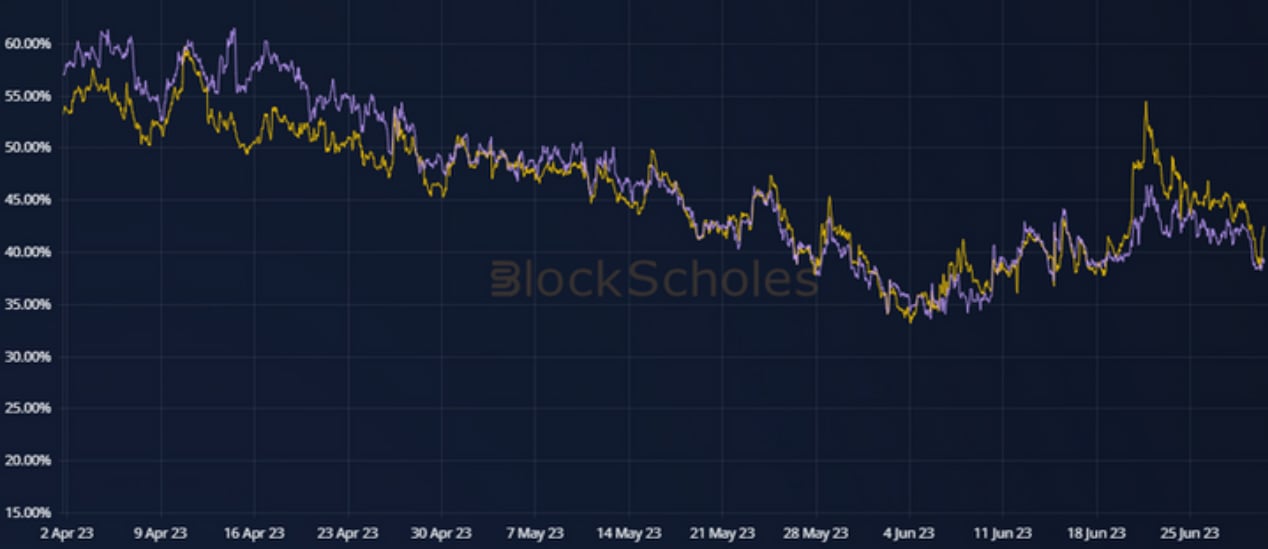
Figure 1 Hourly BTC (yellow) and ETH (purple) 1 month tenor, ATM implied volatility of Deribit traded options over the last 30 days. Source: Block Scholes
June heralded a reprieve from the persistently downwards trend of the volatility implied by BTC and ETH options. This coincided with a wave of positive sentiment (enjoyed by BTC markets in particular) following news of several TradFi institutions taking serious steps into digital-assets.
Last month we commented on the relationship between trading volumes in spot markets and delivered volatility as both reached the lower bound of their historic ranges. This month’s increase in vol (delivered and implied) was spurred on by a small pickup in trade volume. However, neither volumes nor volatility managed to match even the levels recorded in mid-January of this year, and both have some way to go to match the activity and choppiness that we have previously taken for granted.
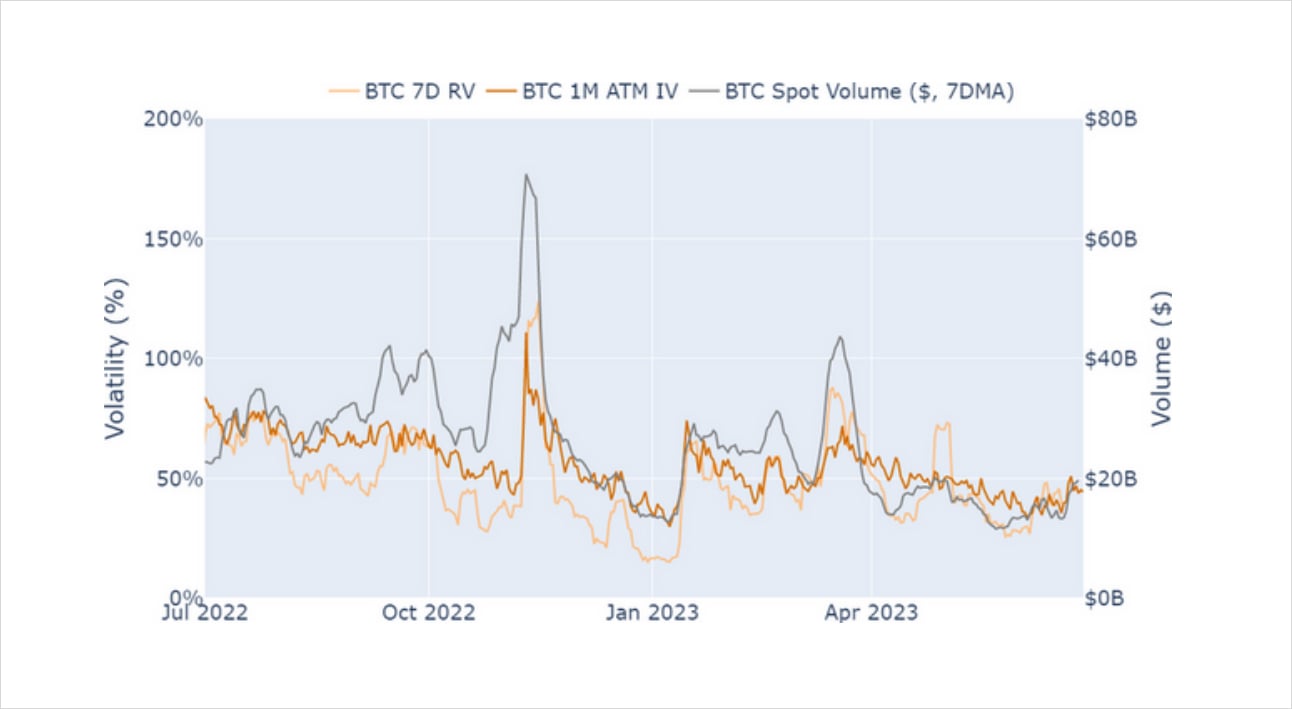
Figure 2 Daily annualised 7-day BTC realised volatility (light orange), 1-month tenor, ATM implied volatility (dark orange), and 7-day moving average of spot trade volume in US dollars. Source: Block Scholes (volatility data), Yahoo Finance (spot trade volume data)
Cross Asset Volatility
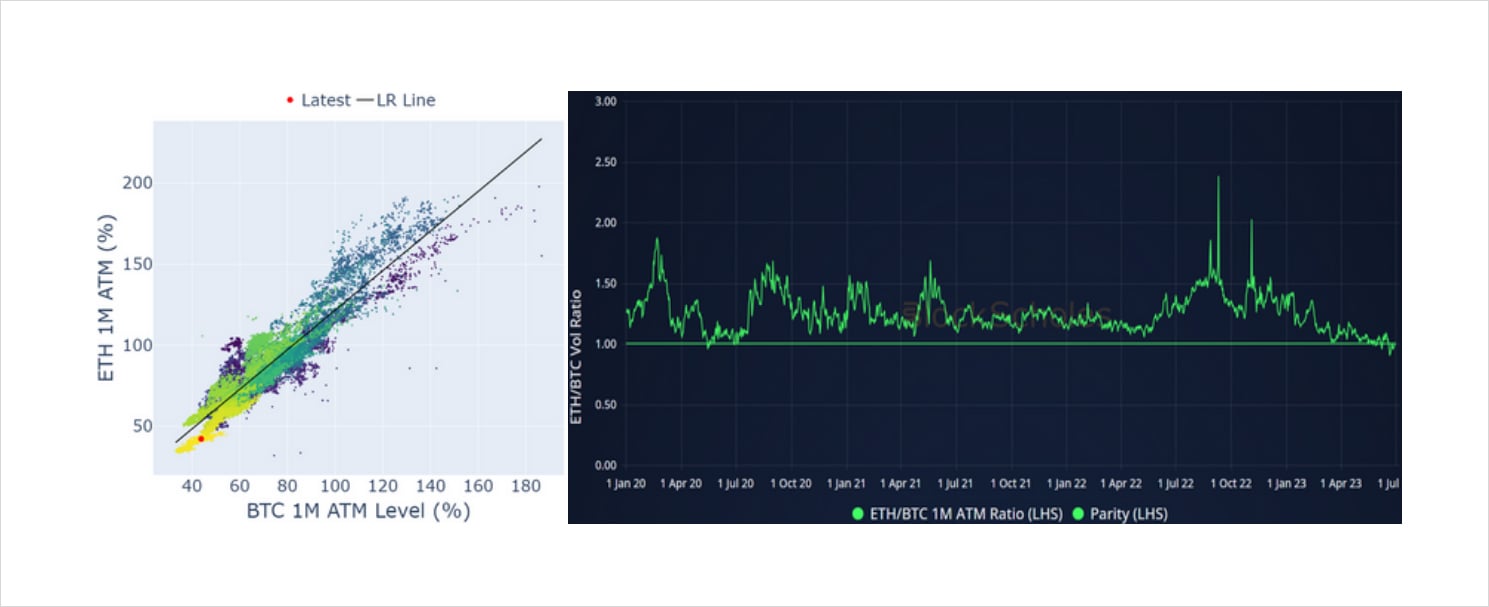
Figure 3 (a) Hourly BTC (x axis) and ETH (y axis) 1-month, ATM implied volatility from 1st Jan 2020. (b) Ratio of ETH 1-month, ATM implied volatility to BTC’s since 1st Jan 2020. Source: Block Scholes
The fall of ETH ATM vol below that of BTC which we highlighted last month has extended to the longest period that we have observed and continues to suggest a further downwards trend. ETH’s annualised implied vol is at just 42% at a 1M tenor, some 10 vol points lower than we would expect given that ETH optionality has historically traded at a distinct premium to the level of BTC’s implied vol.
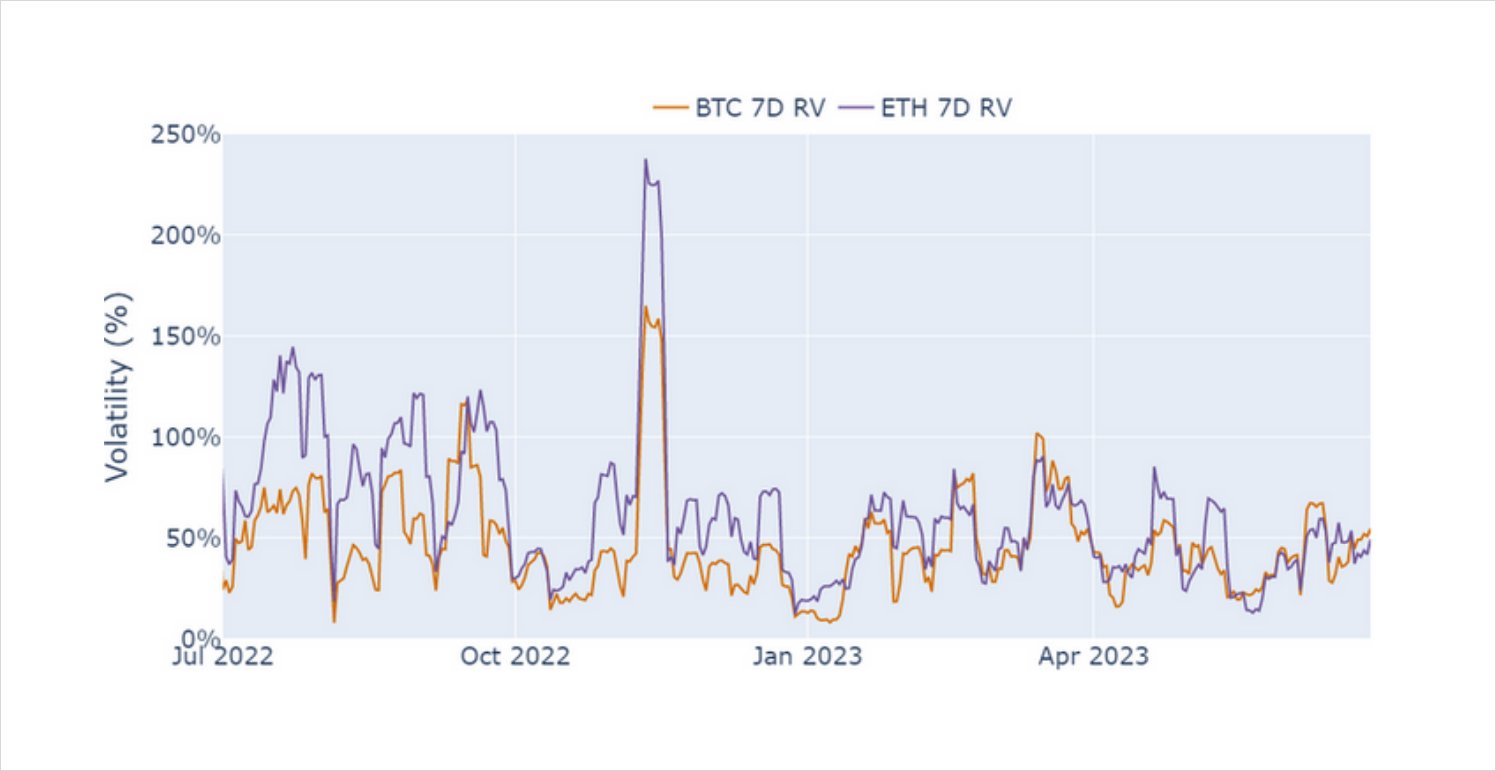
Figure 4 Daily annualised 7-day BTC (orange) and ETH (purple) realised volatility as measured by the standard deviation of hourly log-returns (light orange). Source: Block Scholes
We can attribute the slightly lower level of ETH’s implied vol in part to the lower level of realised volatility with which ETH’s spot price has moved. Historically, ETH’s spot price has been more volatile than BTC’s, leading to higher forward looking volatility expectations. The standard deviation of their log-returns over the past 7 days show that BTC’s and ETH’s spot prices have been trading at 44% and 42% delivered vol respectively.
Sentimental Skew
Bullish spot price action has been led by BTC since the successful switch of ETH’s consensus mechanism to a Proof of Stake system in Sep 2022 and throughout 2023. BTC has posted returns of +52% (+86% YTD) whilst ETH has lagged at just +15.3% (“just” +57.7% YTD). Accordingly, BTC’s volatility smile has been consistently less skewed towards OTM puts than ETH’s throughout this period.
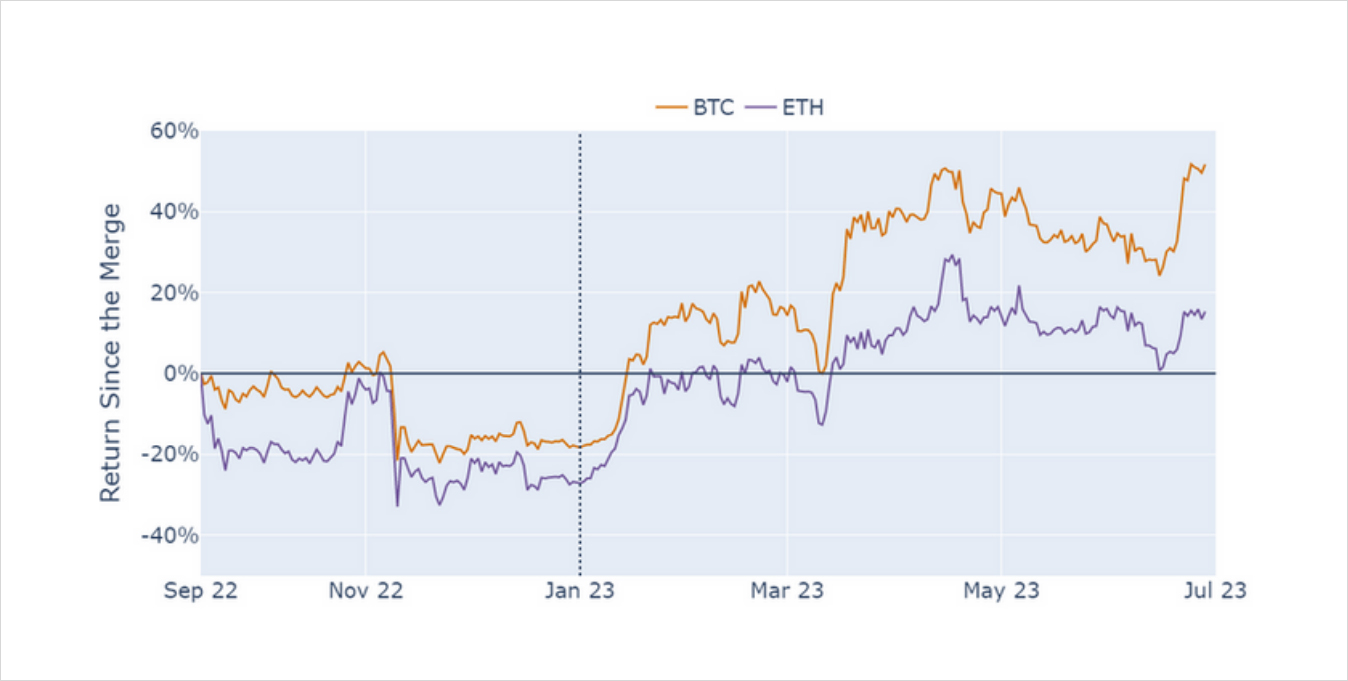
Figure 5 Return of BTC (orange) and ETH (purple) spot price since the 15th September 2023, the date of Ethereum’s switch to a Proof of Stake consensus mechanism. Source: Block Scholes
However, despite the strongest spot performance in both assets, neither vol smile has reflected a significant swing towards positive sentiment. Downside protection has, except on several short-lived occasions, been priced at a significant implied volatility premium to OTM calls. Positive spot moves have led to a return to a neutral smile, rather than an outright preference for upside participation.
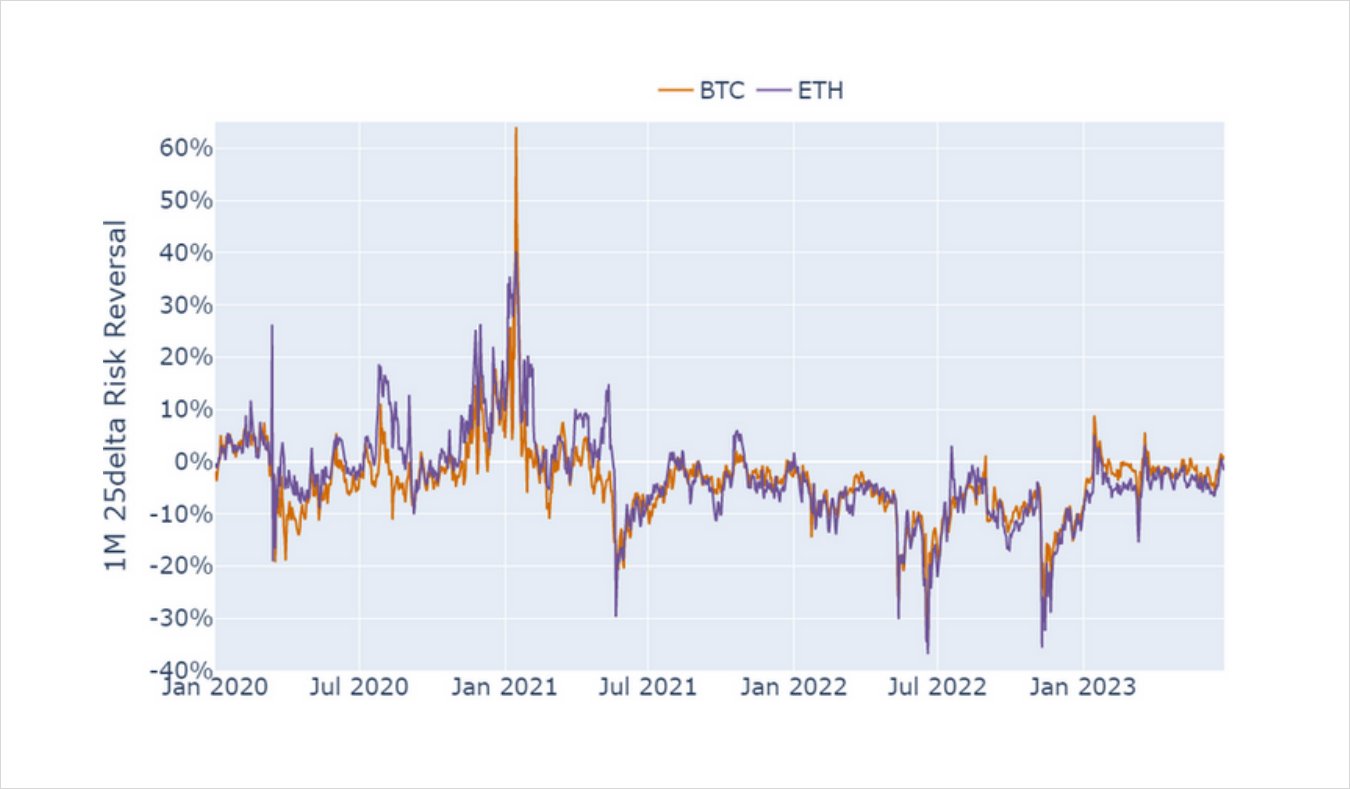
Figure 6 Daily BTC (orange) and ETH (purple) 1-month tenor, 25-delta risk reversal since Jan 2020. Source: Block Scholes
This is a trend that we have observed since at least mid-2021. To visualise it, we display the return recorded over the previous 30-days and compare it to the contemporaneous level of the 1-month tenor, 25-delta risk reversal. Data recorded before and after the 14th April 2021 (chosen as the timestamp of the first of the two peaks reached in that year) show different behaviours in response to the returns over the previous 30 days.
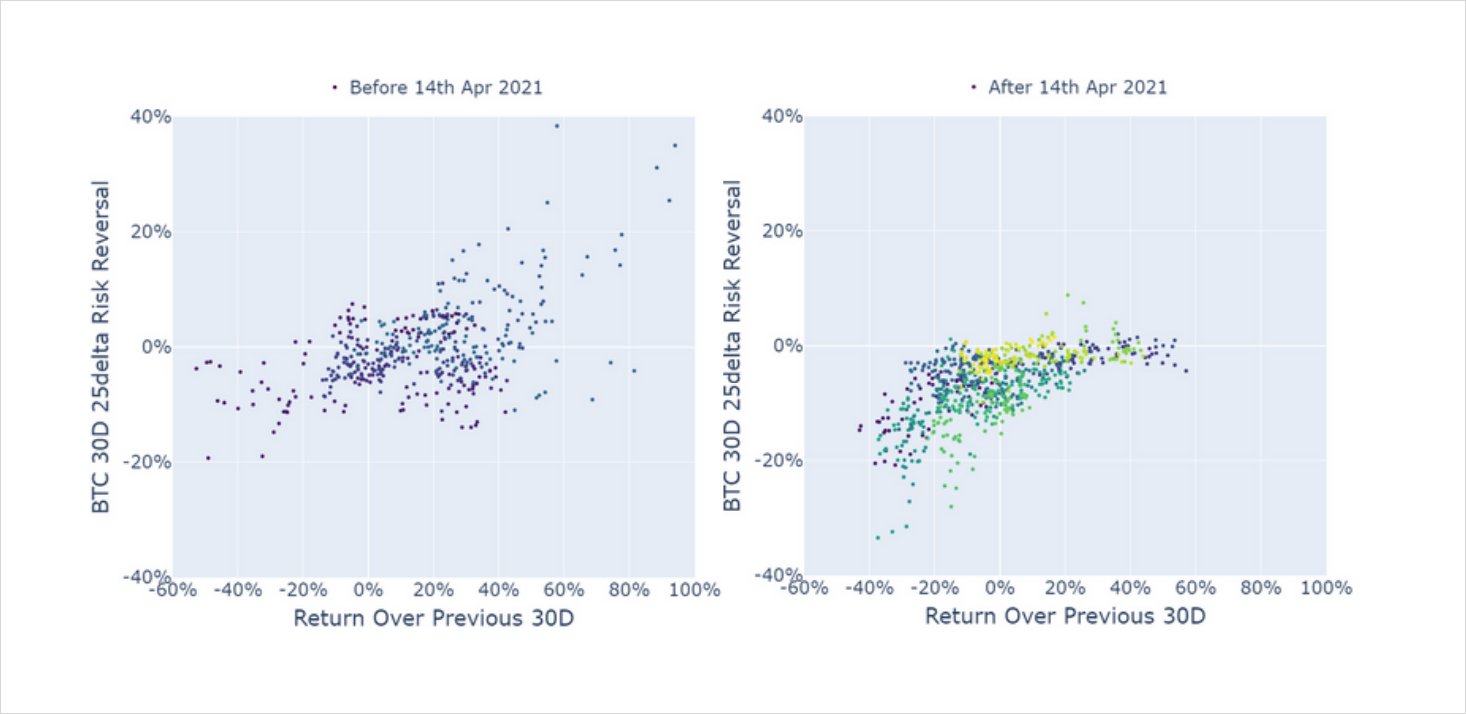
Figure 7 Daily observations of returns over the previous 30 days (x-axis) and contemporaneous BTC 1-month, 25- delta risk reversal (y-axis) before (left) and after (right )April 14th 2021. Source: Block Scholes
Whilst sizable selloffs result in a plunge for the 1M, 25-delta risk reversal, similarly sized rallies have not caused the vol smile to skew sharply towards calls. Instead, in such cases we see a return to a neutral vol smile as the skew appears to be “capped” at 0. This is in contrast to the more symmetric response observed before early-2021, where the correlation is more apparent on the way up as well as down.
One explanation for this is the hedging activities of holders of the underlying asset, either miners or whales. Such holders may hold a bullish conviction in the long run, but wish to hedge against downside volatility in the short term. This would result in them buying puts (and potentially even selling calls) and applying a put-ward pressure to the smile. However, why this behaviour appears to begin only in early 2021 is unclear.
AUTHOR(S)
