
Crypto-asset derivatives markets now report implied volatility as near the lowest levels recorded since January 2020.
This follows an extended trend of dropping realised volatility and falling trade volumes across centralised spot exchanges. Just as surprising is the fall of ETH’s implied volatility below that of BTC, which has happened only once before in the period considered. This is made more remarkable by its recently larger relative realised volatility, which has historically been a good indicator of the relative levels of implied volatility between the assets.
Volatility and Volume
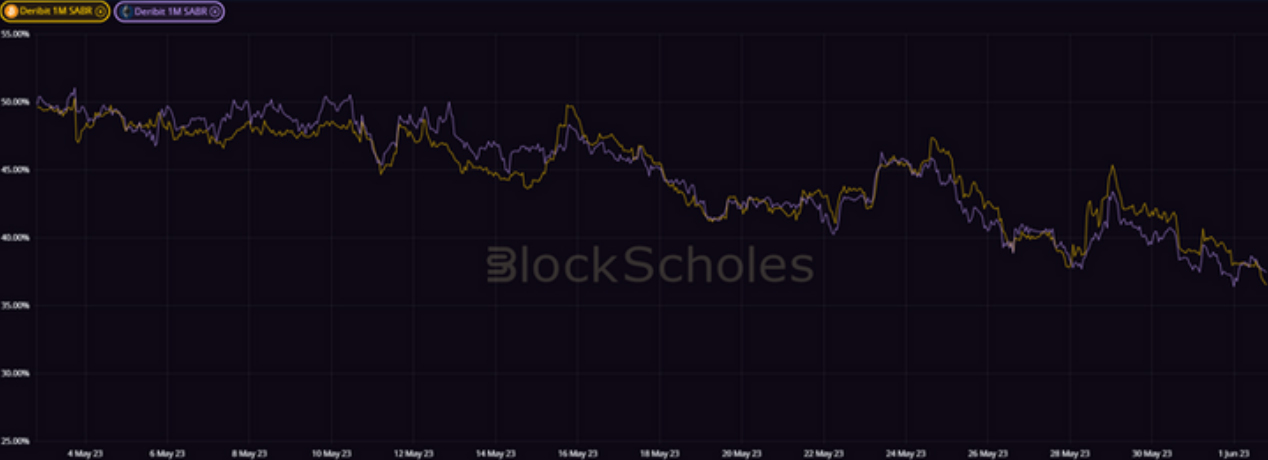
Figure 1 Hourly BTC (yellow) and ETH (purple) 1 month tenor, ATM implied volatility of Deribit traded options over the last 30 days. Source: Block Scholes
The outright levels of crypto-asset implied volatility (as measured by the ATM level at a 1 month tenor) have fallen significantly since the spike observed in November last year as a result of the FTX collapse. May saw the lowest levels recorded since Jan 2020, the earliest days of a liquid crypto-asset derivatives market, for both BTC and ETH options.
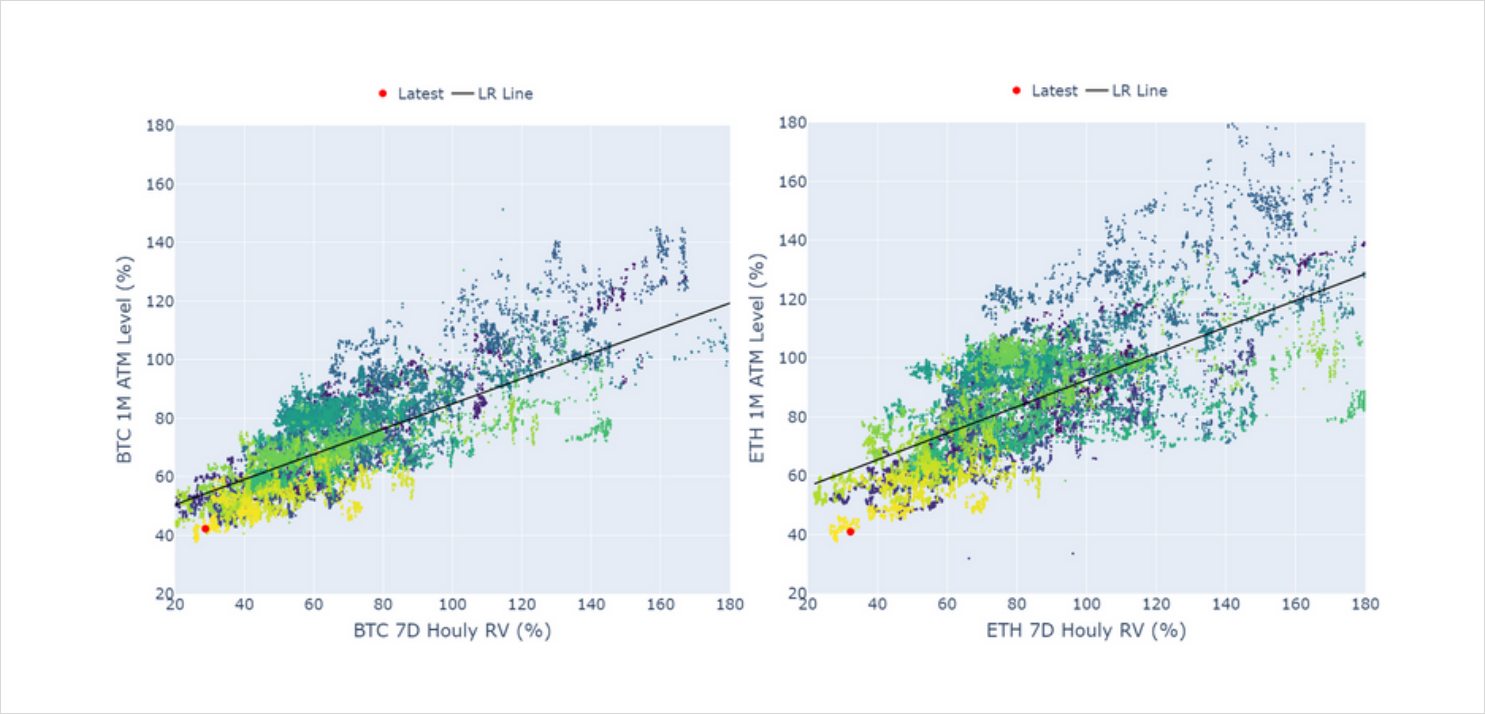
Figure 2 (a) Hourly annualised BTC 7-day realised volatility as measured by the standard deviation of hourly-log returns and 1-month tenor, ATM implied volatility from 1st Jan 2020. (b) Annualised ETH 7-day realised volatility as measured by the standard deviation of hourly-log returns and 1-month tenor, ATM implied volatility from 1st Jan 2020. Source: Block Scholes
The remarkably low levels of implied volatility can be explained by similarly historically low levels of realised volatility. Figures 2a and 2b show a strong relationship between forward-looking volatility expectations and historic estimates of realised volatility, in both BTC and ETH options markets. This is because the biggest driver of forward looking volatility expectations is the actual volatility observed in the price path of the underlying asset. Traders use this as the best indicator of future volatility as they expect the underlying asset to continue to trade with the same behaviour.
The most recent trend of both metrics (shown by the colour gradient of the plotted points) shows that realised volatility has been falling in tandem with implied volatility for some time. We also note that the range of implied volatility is tighter than that of realised (particularly for BTC), and that the strength of the relationship degrades somewhat at higher values of realised vol.
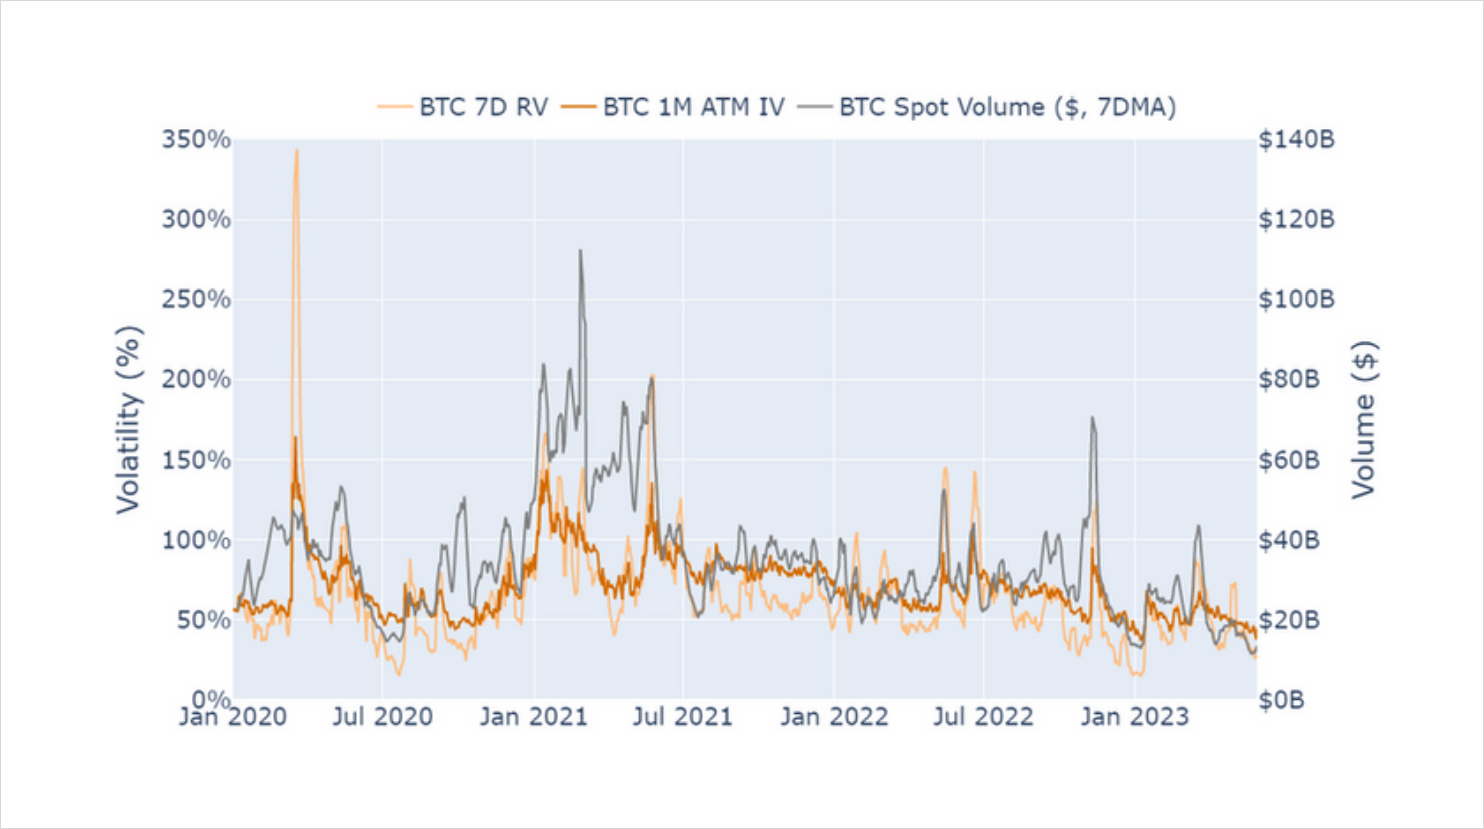
Figure 3 Daily annualised 7-day BTC realised volatility as measured by the standard deviation of hourly log-returns (light orange), 1-month tenor, ATM implied volatility (dark orange), and 7-day moving average of spot trade volume in US dollars. Source: Block Scholes (volatility data), yahoo finance (spot trade volume data)
In addition to the expected relationship between realised and implied volatility, we also observe a close historical relationship between spot trading volumes and the realised (and therefore implied) volatility of the price path of the underlying asset. This behaviour is present in both BTC and ETH markets.
Large price swings (both up and down) tend to be driven by high trading volumes – possibly as traders are drawn to the high volatility regime offered by crypto-assets – as seen by the spikes in volumes near to the rally in April 2021 and the FTX crash in November 2022. When trading interest and volumes are low, prices remain more stagnant – resulting in a lower forecast for volatility in the near future. At the same time that derivatives markets are recording all-time low volatility, spot markets are reporting the lowest daily traded volumes since pre-Jan 2020.
It is not immediately clear whether the current fall in trade volume can be attributed to one of institutional or retail traders or both. After exploding in the first half of 2021 on the back of an incredible run to then all-time high spot values, trade volumes settled somewhat near to $40B per day. Whilst already much lower than the days of high activity in 2021, the trend downwards appears to have been exacerbated by the collapse of FTX in November before briefly reversing as traders participated in the two rallies at the beginning of this year.
Relative Volatility Levels
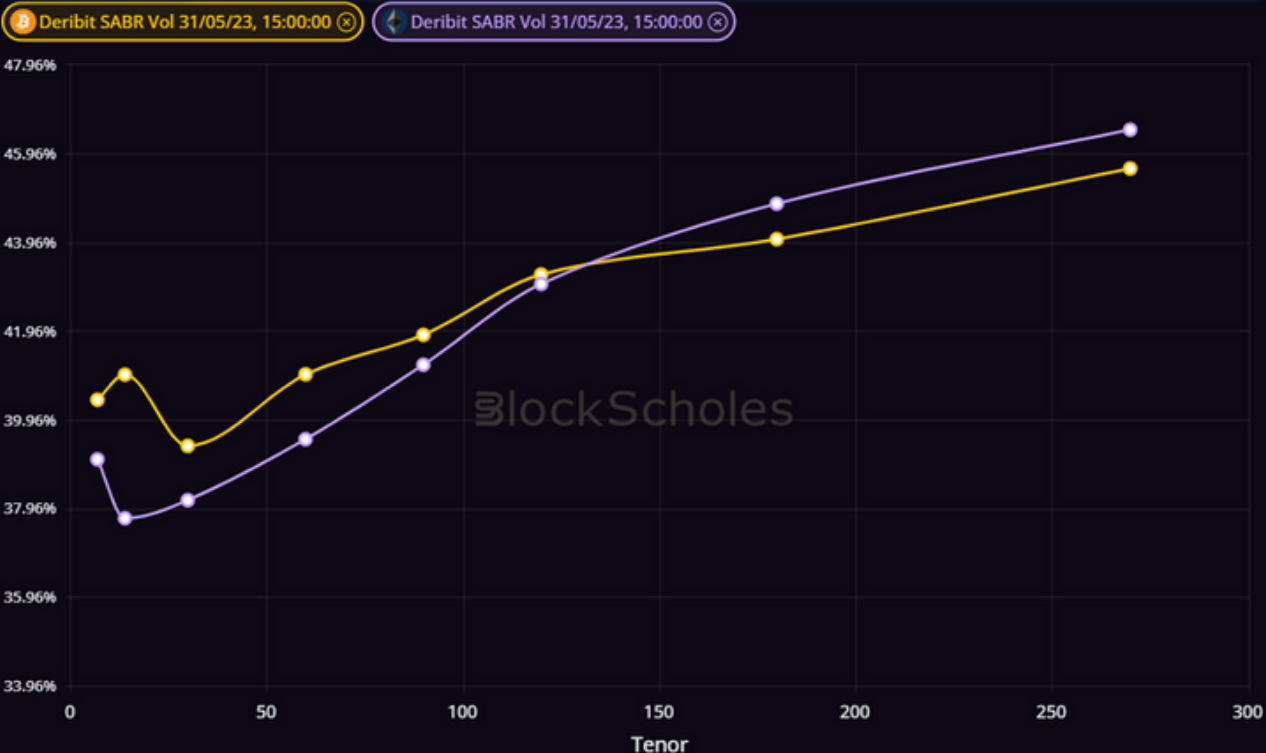
Figure 4 Term structure of ATM volatility of BTC (yellow) and ETH (purple) options at a 19:14 UTC 1/6/23 snapshot. Source: Block Scholes
In addition to both assets recording all-time low values, the implied volatility of ETH options is lower than BTC’s across the front end of the term structure until a tenor of 120 days.
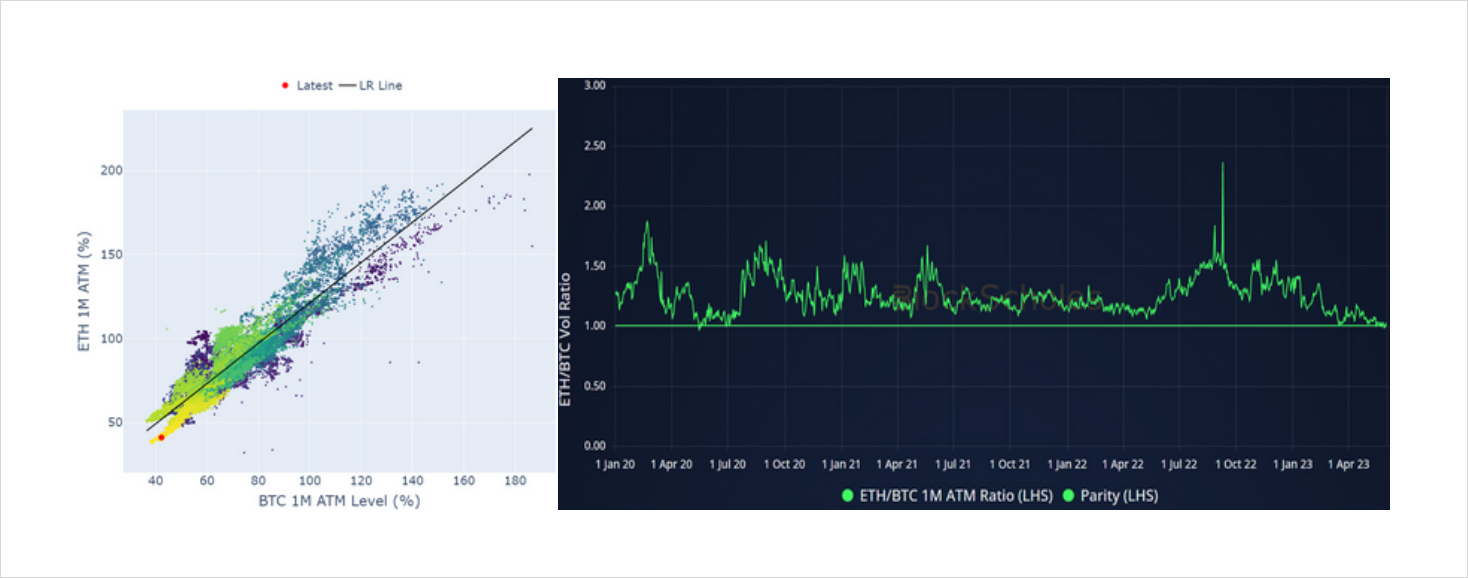
Figure 5 (a) Hourly BTC (x axis) and ETH (y axis) 1-month, ATM implied volatility from 1st Jan 2020. (b) Ratio of ETH 1-month, ATM implied volatility to BTC’s since 1st Jan 2020. Source: Block Scholes
This is distinctly unusual. Throughout the overwhelming majority of the three year period we are able to collect reliable data from a liquid derivatives market, the volatility implied by ETH options has been above that of BTC options. Aside from several spurious hourly timestamps, it is only in April 2020 that we have seen markets assign a consistent premium to ETH volatility.
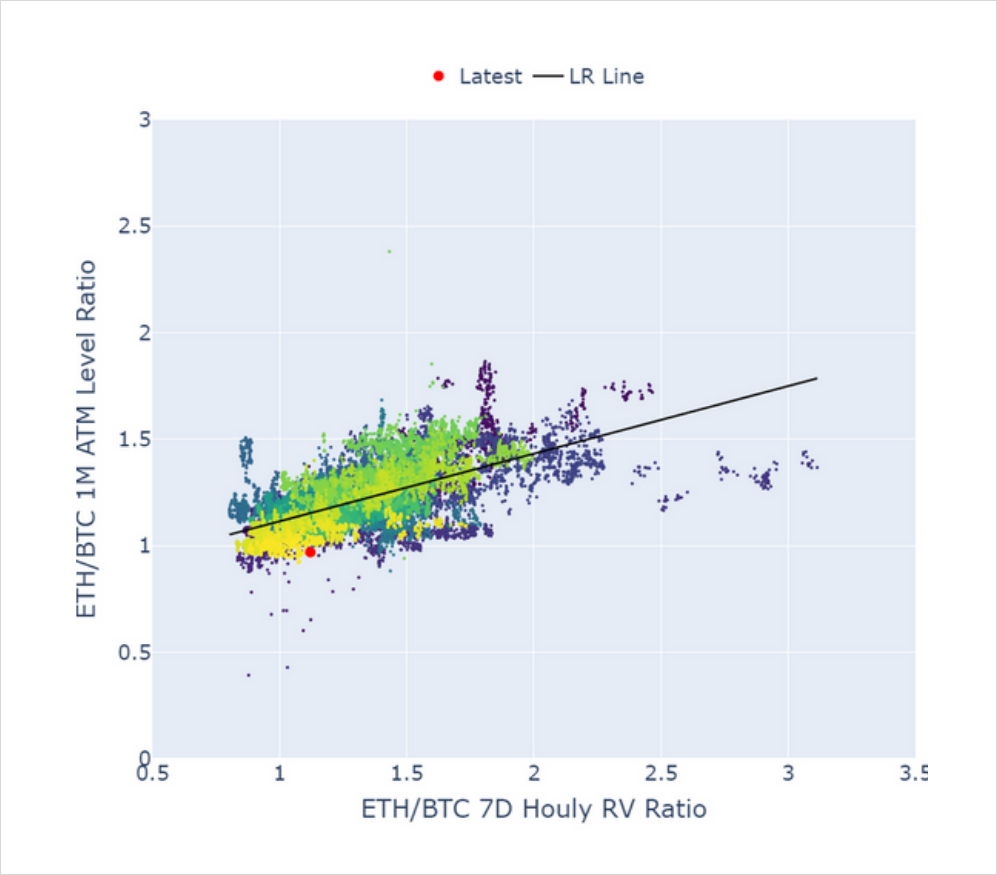
Figure 6 Hourly ratio of ETH’s 7-day realised volatility to BTC’s (x axis) and ratio of ETH’s 1-month, ATM implied volatility ratio to BTC’s (y axis). Source: Block Scholes
ETH’s historically low volatility compared to BTC’s is even more vivid when we consider the delivered volatility of the two assets. Figure 6 shows the ratio of ETH’s realised volatility to BTC’s on the x axis and the ratio of ETH’s implied volatility to BTC’s on the y axis. Whilst ETH implied volatility is at its lowest levels relative to BTC’s, historically we have seen its realised volatility fall much further below the realised volatility of BTC on many occasions. From the historical relationship between the two assets, we would expect ETH’s relatively choppier price action over the past month to imply a similarly larger premium for implied volatility too.
We are particularly interested in how this peculiar market structure develops. If outright implied volatility picks up once more, the historic relationship would suggest that we would expect to see ETH options experience a proportionally higher increase in implied volatility. However, it is also possible that significant changes to Ethereum’s network have changed that relationship and, in the absence of uncertainty around the implementation of the upgrades, will see Ethereum trade much more calmly.
AUTHOR(S)
