

Futures-implied yields have recovered rapidly from their November lows to reflect forward prices trading near to spot across the term structure. At the same time, the volatility implied by at-the-money options has returned to pre-crisis levels.
In contrast, the volatility smile grows steeper, as deeper OTM options retain their richness. Will a strong move validate that extreme pricing and in which direction will it be?
Implied Yield Term structure
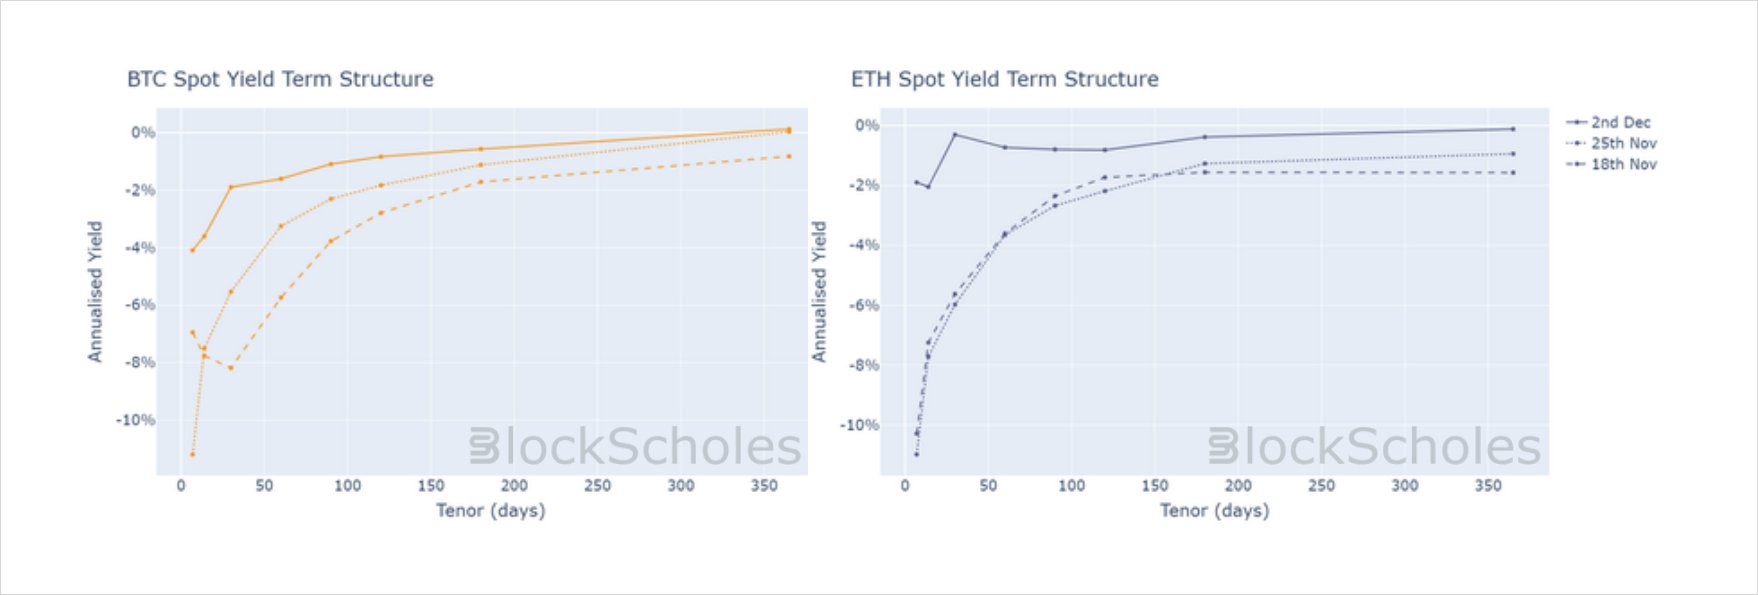
Figure 1 (a) Term structure of BTC future-implied yields for three key dates (b) Term structure of BTC future- implied yields for three key dates. Source: Block Scholes
- The future-implied yield term structures of BTC and ETH have both reshaped over the past three weeks, with both now trading much flatter and much closer to zero than before.
- This indicates a cooling in the negative sentiment that saw short-tenor, annualised yields plunge to near -20%, and marks a quick recovery from the pessimism it indicated just weeks before during the height of the market uncertainty.
SABR Volatility of Volatility
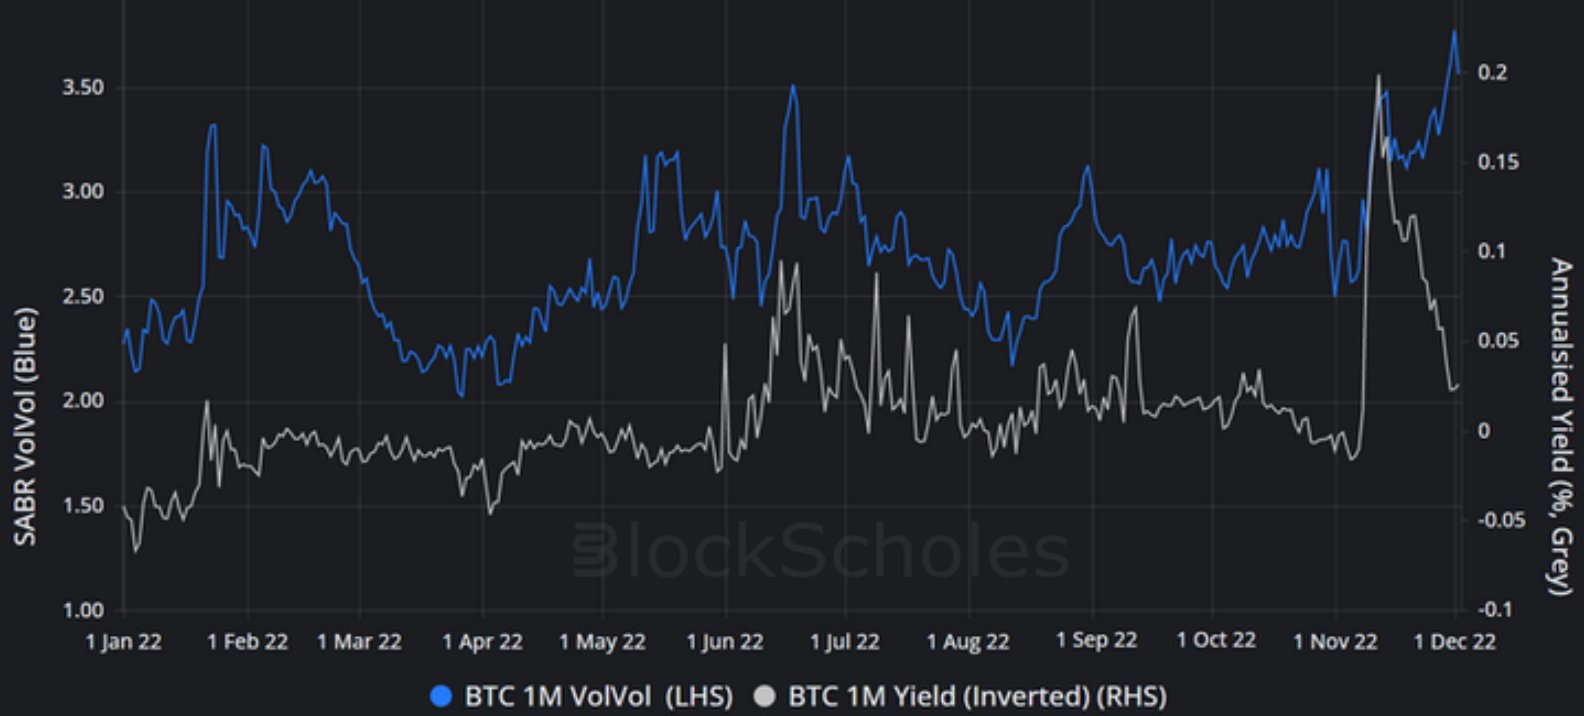
Figure 2 Hourly BTC (orange) and ETH (purple) SABR calibration Rho parameter at a 30-day tenor from 17th Nov 2022. Source: Block Scholes
The SABR Vol of Vol parameter corresponds to the volatility of volatility used to model the volatility smile. The higher the volatility of volatility, the steeper the smile and the more expensive deep OTM puts and calls are when compared to options struck ATM.
- However, the recovery of implied yields back towards positive values has not been accompanied by an abating in the steepness of the volatility smile.
- Over the past , the SABR Vol of Vol parameter has signalled steepness in the volatility smile at the same times that negative yields have indicated an increased demand for short exposure in futures markets.
- In Figure 2 we plot those two parameters alongside each other, with the RHS axis of annualised yields inverted in order to aid visualisation of its correlation to the SABR Vol of Vol parameter.
- The chart shows that the 1 month forward price dropped sharply below spot on the 12th November and has recovered rapidly in the three weeks since.
- Strangely, we have seen volatility of volatility increase over the same period, meaning a steepening in the wings of the vol smile at the same time as demand for short futures exposure has diminished.
SABR ATM Volatility
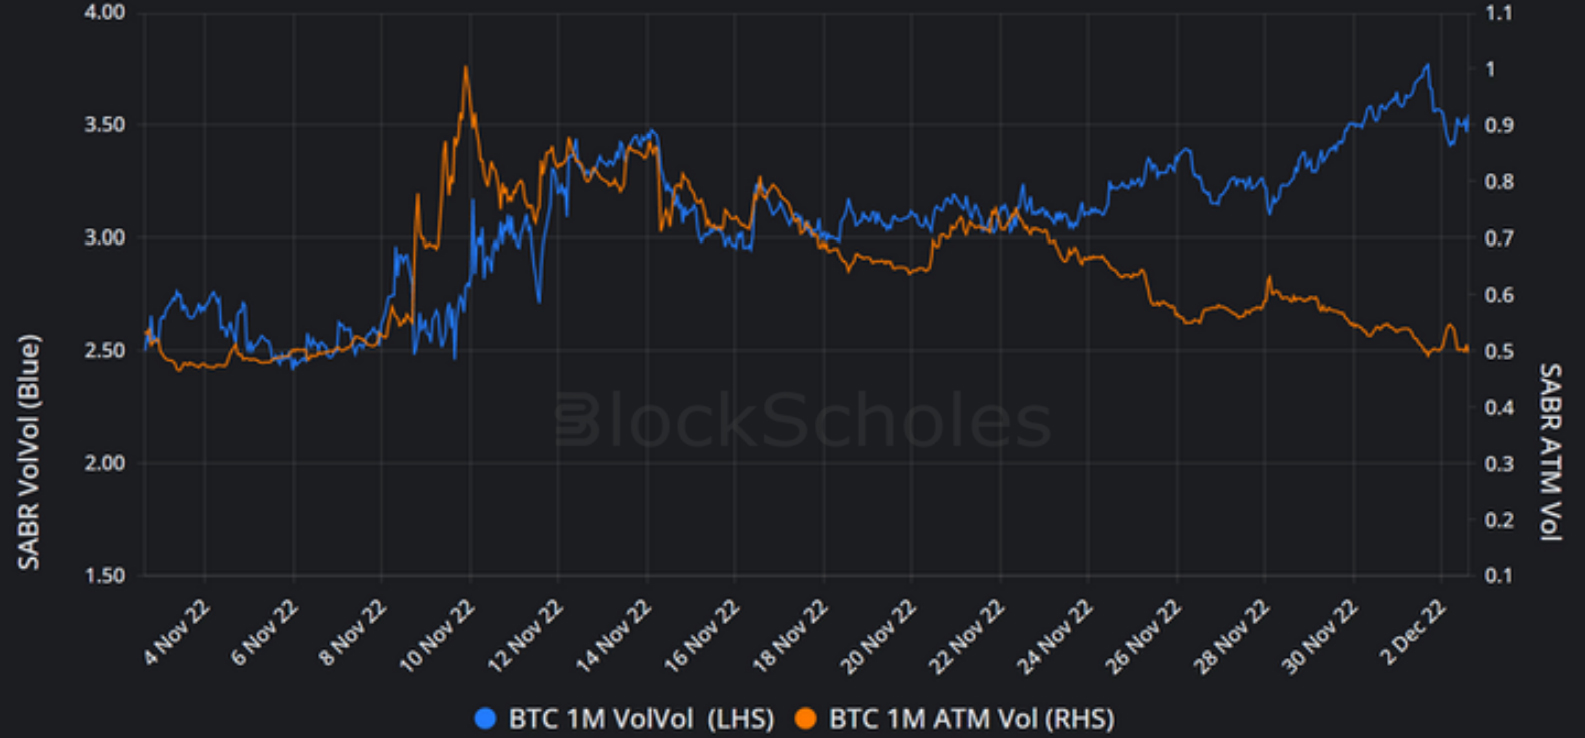
Figure 3 Hourly BTC 1 month Vol of Vol (orange) and ATM volatility (blue) from 4th Nov 2022. Source: Block Scholes
- Figure 3 shows that the increase in the steepness of BTC’s vol smile is due to a drop in ATM volatility, rather than an increase of volatility implied by the pricing of options in the wings.
- That divergence has grown since beginning in the last week of November; deep OTM options have remained at similar levels of richness whilst options struck at-the-money now trade at pre-FTX crisis levels.
The recovery of futures-implied yields from extreme negative pricing to near zero is at odds with the growing premium assigned to deep OTM options. Where previously the steepness of the vol smile had reflected the pessimism indicated by negative implied yields, it is now no longer supported by a strongly negative term structure. Furthermore, the increasing richness in the wings is caused not by an increase in demand for deep OTM protection (as it was at the beginning of ), but by a drop in ATM vol levels. The market therefore appears to be bracing for a sharp move in spot price, without making any strong statement on its direction.
AUTHOR(S)
Trading with a competitive edge. Providing robust quantitative modelling and pricing engines across crypto derivatives and risk metrics.