The higher yields-to-spot that are implied by BTC future prices have fallen to match those of ETH’s. The latter asset’s yields did not flinch during the spot rally following the unlock of staked ETH on the Beacon chain, possibly due to the hedging activities of traders with staked ETH positions. The decline in positive sentiment was observed across the term structure of both assets, but was joined by a change in skew towards OTM puts for ETH options only. That means that ETH’s skew has now reversed its post-Shapella recovery relative to BTC options, now pricing OTM puts at a 5 vol premium to calls at a 1 month tenor.
Future Implied Yields

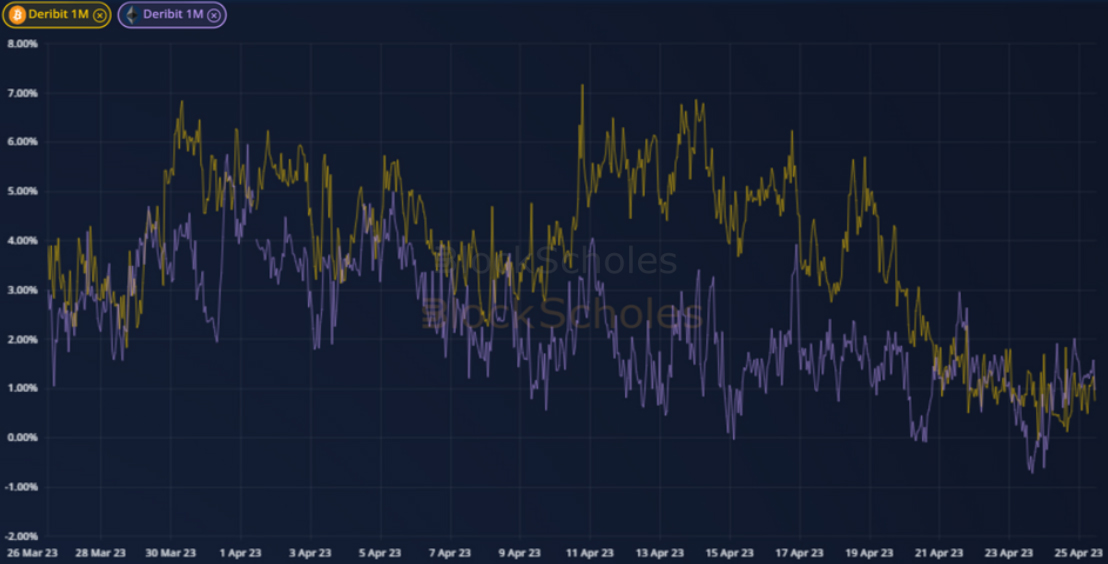
Figure 1 Hourly BTC (yellow) and ETH (pale purple) annualised 1-month future-implied yields to spot over the last month. Source: Block Scholes
- ETH’s future-implied yields have traded below those of BTC’s consistently throughout 2023.
- The divergence was more stark mid-April near to the unlock of staked ETH tokens on the Beacon chain.
- This is possibly due to hedging activity to options near to the unlock date, or even evidence of early synthetic “unlocking” of ETH tokens by taking the opposite exposure in the futures market.
- Since the 21st of April, however, the futures markets reflect a similar sentiment for both assets, with the 1-month future prices at their closest to spot prices since March.
Yields and Spot

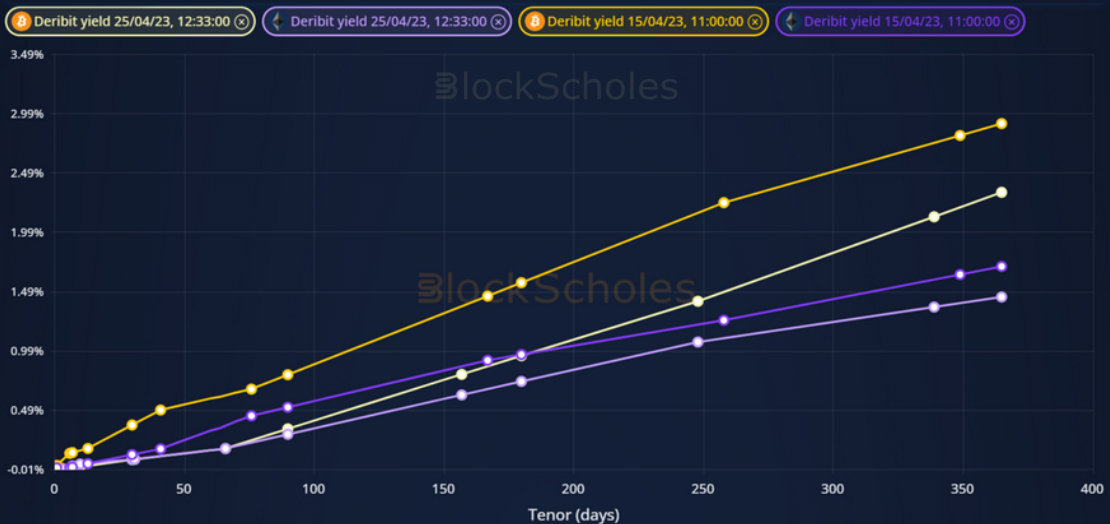
Figure 2 Term structures of future-implied yields of BTC (yellow) and ETH (purple) at 25/4/23 12:33 UTC (lighter colours) and 15/4/ 11:00 UTC (darker colours) snapshots. Source: Block Scholes
- The term structures of both assets are lower, reflecting that futures prices have fallen relative to spot during the selloff over the last week.
- Whilst still above that of ETH, BTC’s terms structure has fallen further than ETH’s between the two snapshots.
- Both assets show a relatively flat term structure at both timestamps.
Divergence in Risk Reversals

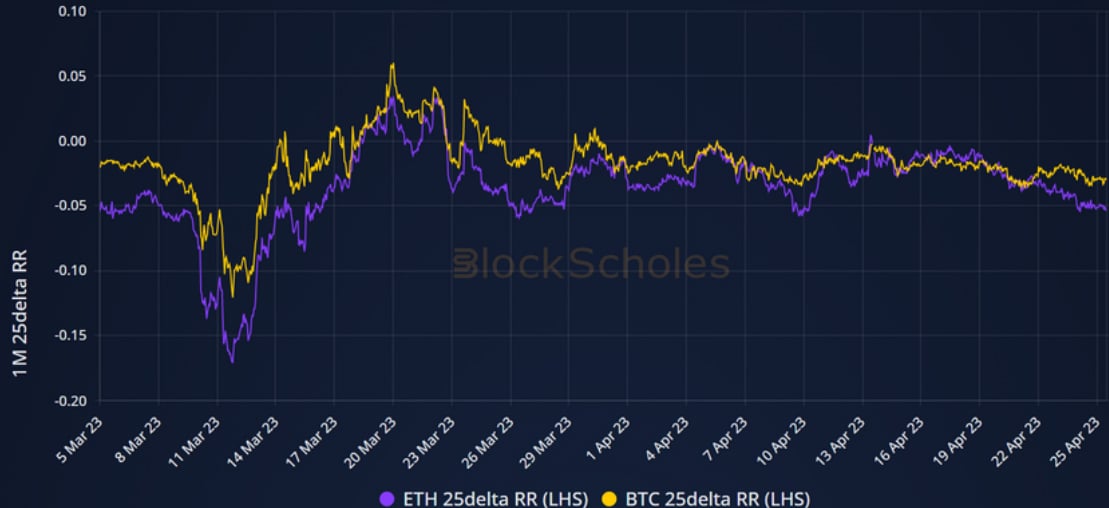
Figure 3 Hourly ETH 1-month, 25-delta risk reversal (dark purple) and ETH (pale purple) annualised 1-month future-implied yields to spot over the last month. Source: Block Scholes
- The fall in future-implied yields to spot over this period is reflected in the skew of ETH’s volatility smile towards OTM puts, but not in the skew of BTC’s smile.
- Measured by the 1-month, 25-delta risk reversal of both volatility surface, ETH’s smile is assigning a 5 vol point premium to OTM puts, compared to BTC’s 3 point difference.
- This suggests a return to the slightly more negative sentiment assigned to ETH that we have commented on throughout this year.
AUTHOR(S)
