
BTC’s volatility market appears to stick to the track it has beaten out over the last few months: one of extended periods of low volatility, punctuated by sparse, sharp spikes. This is a world away from the consistent, high volatility regime seen most recently last summer for which crypto-assets have become notorious. Such a market generally proves difficult to anticipate, with binary, all-or-nothing spot action likely to catch traders out.
Implied Volatility trending lower again
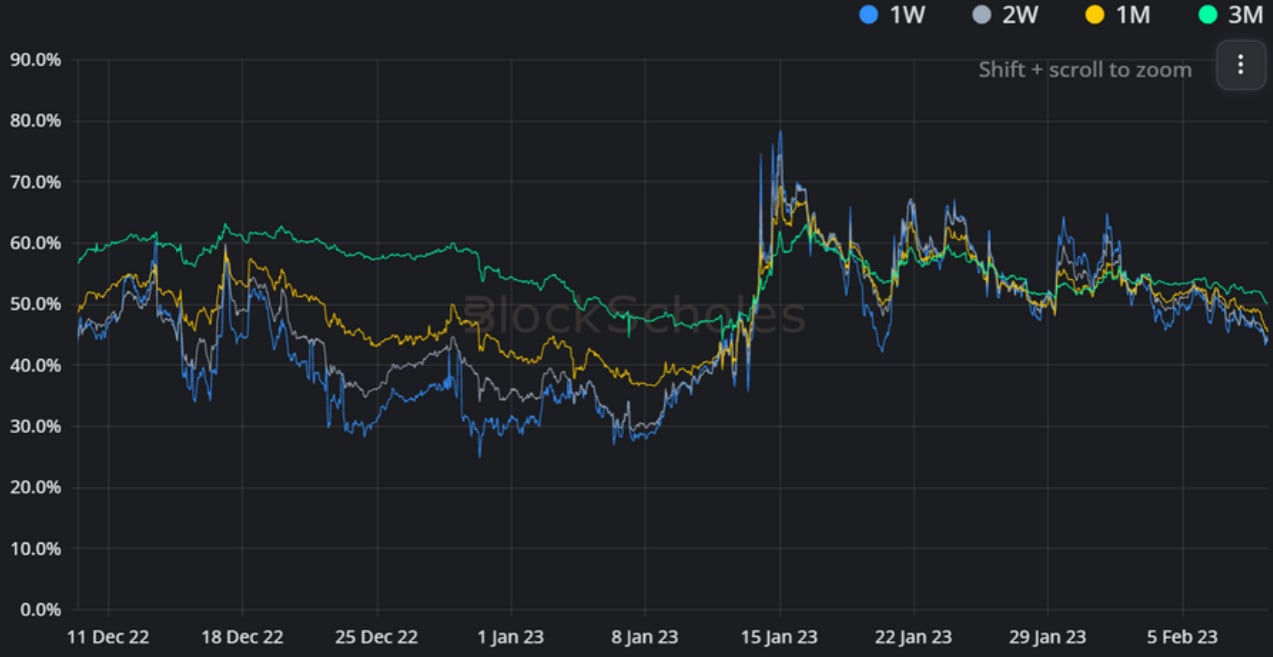
Figure 1 Hourly BTC at-the-money implied volatility since the 11th January 2023 at several constant tenors. Source: Block Scholes
- BTC’s at-the-money implied volatility is trending lower at all tenors once again.
- This follows the strong price action in January that spiked volatility several times.
- However, both BTC and ETH’s derivatives markets are still pricing implied volatility above the alltime low levels they recorded in late December and early January.
Vol Smile is lower, flatter and skewing towards Puts
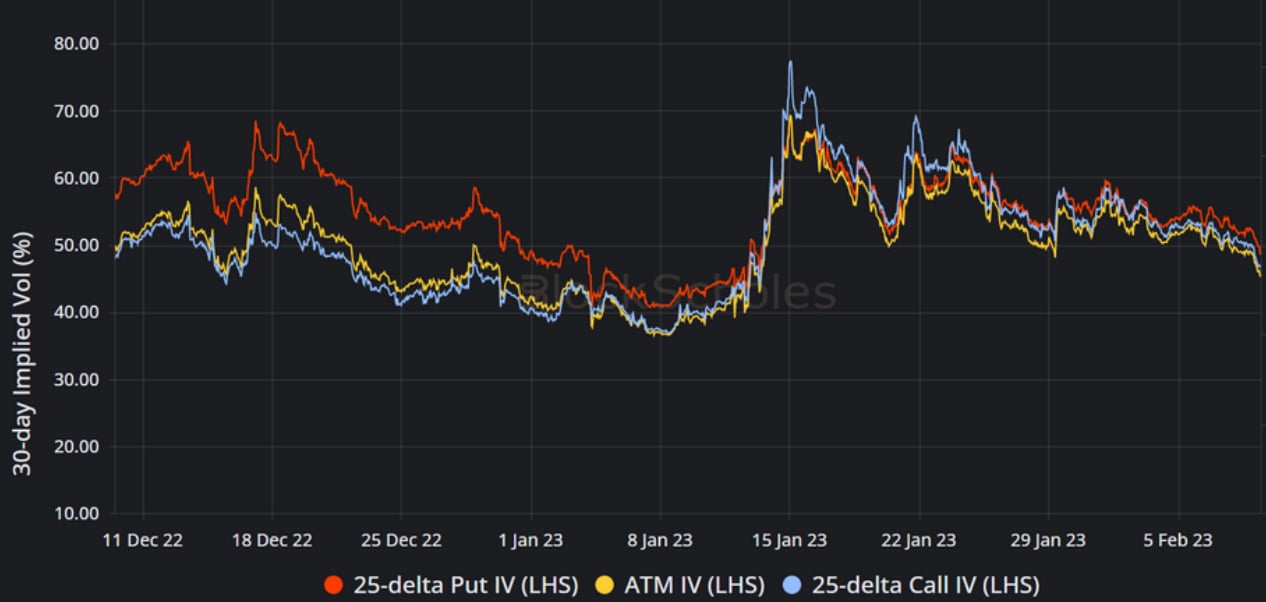
Figure 2 Hourly BTC implied volatility of a 25-delta put (red), 25-delta call (blue), and ATM option (yellow) since the 13th December 2022. Source: Block Scholes
- Following January’s strong price moves, BTC’s vol smile has dropped lower, become more flat and less skewed towards either OTM puts or calls than it was in mid December.
- The flatness of the smile is reflected by the convergence of the implied vols of OTM puts (red) and OTM calls (blue) towards the ATM implied vol level (yellow), compared to their wider spread in December.
- The lower skew towards OTM puts or calls is reflected in the relative levels of OTM puts (red) and OTM calls (blue), with the popular 25-delta “risk reversal” representing the difference between these two levels.
- Additionally, this chart highlights the extreme lows reached by OTM calls during December, falling below even the implied volatility of options struck ATM.
Current Volatility Smile
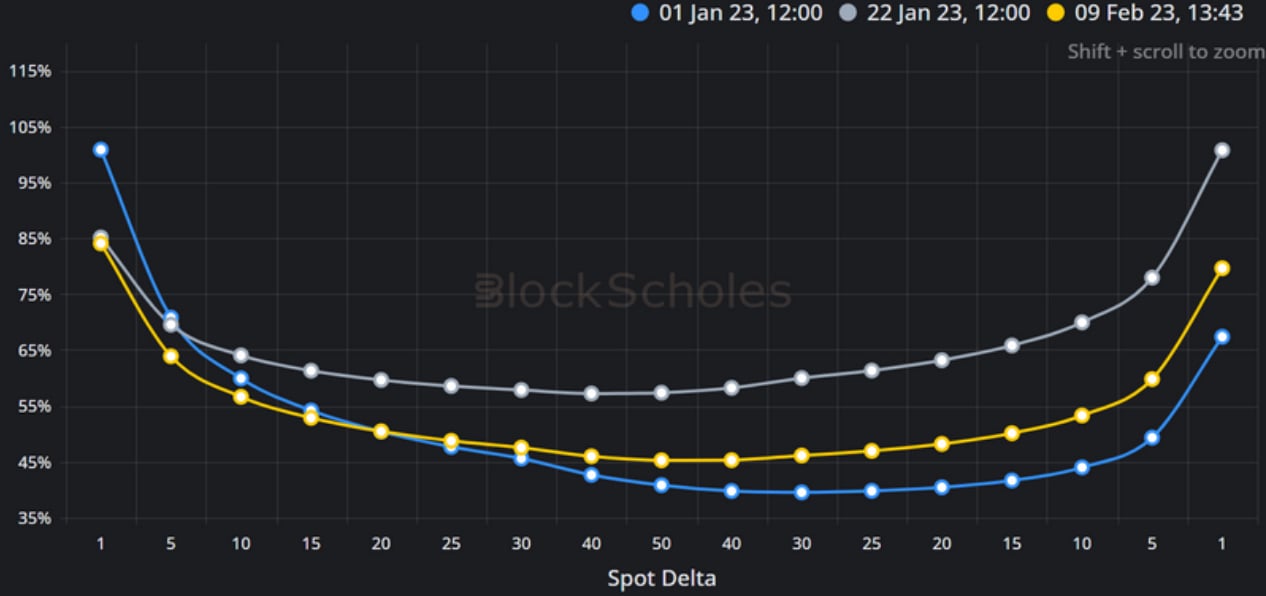
Figure 3 BTC’s 30-day volatility smile on the 1st Jan 23 (blue), 22nd Jan 23 (grey), and today, 9th Feb 23 (yellow). Source: Block Scholes
- These three vol smiles highlight the evolution of the options market during January, and contextualise today’s values.
- Implied volatility is trending down again as realised volatility remains muted.
- A continuation of the current volatility regime could see volatility sharply increase, before tapering off over a period of several weeks or months.
- The return to a neutral-to-bearish skew is notable, given that recent increases in volatility have been focused on the upside, rather than a richness in OTM puts.
AUTHOR(S)
Trading with a competitive edge. Providing robust quantitative modelling and pricing engines across crypto derivatives and risk metrics.