Whilst implied volatility levels remain anchored close to the continued low realised volatility, BTCʼs options markets continue to price for higher volatility expectations than ETHʼs. This leaves a trend that we have observed since September last year at the most extreme levels we have ever observed, despite both spot prices moving with very similar levels of choppiness over the last 90 days. Despite the differences in outright vol level, the smiles of both majors trade with similar levels of skew towards OTM puts having both pushed closer to neutral over the last week, expressing no obvious directional view ahead of tomorrowʼs FOMC meeting.
Major Team Structures

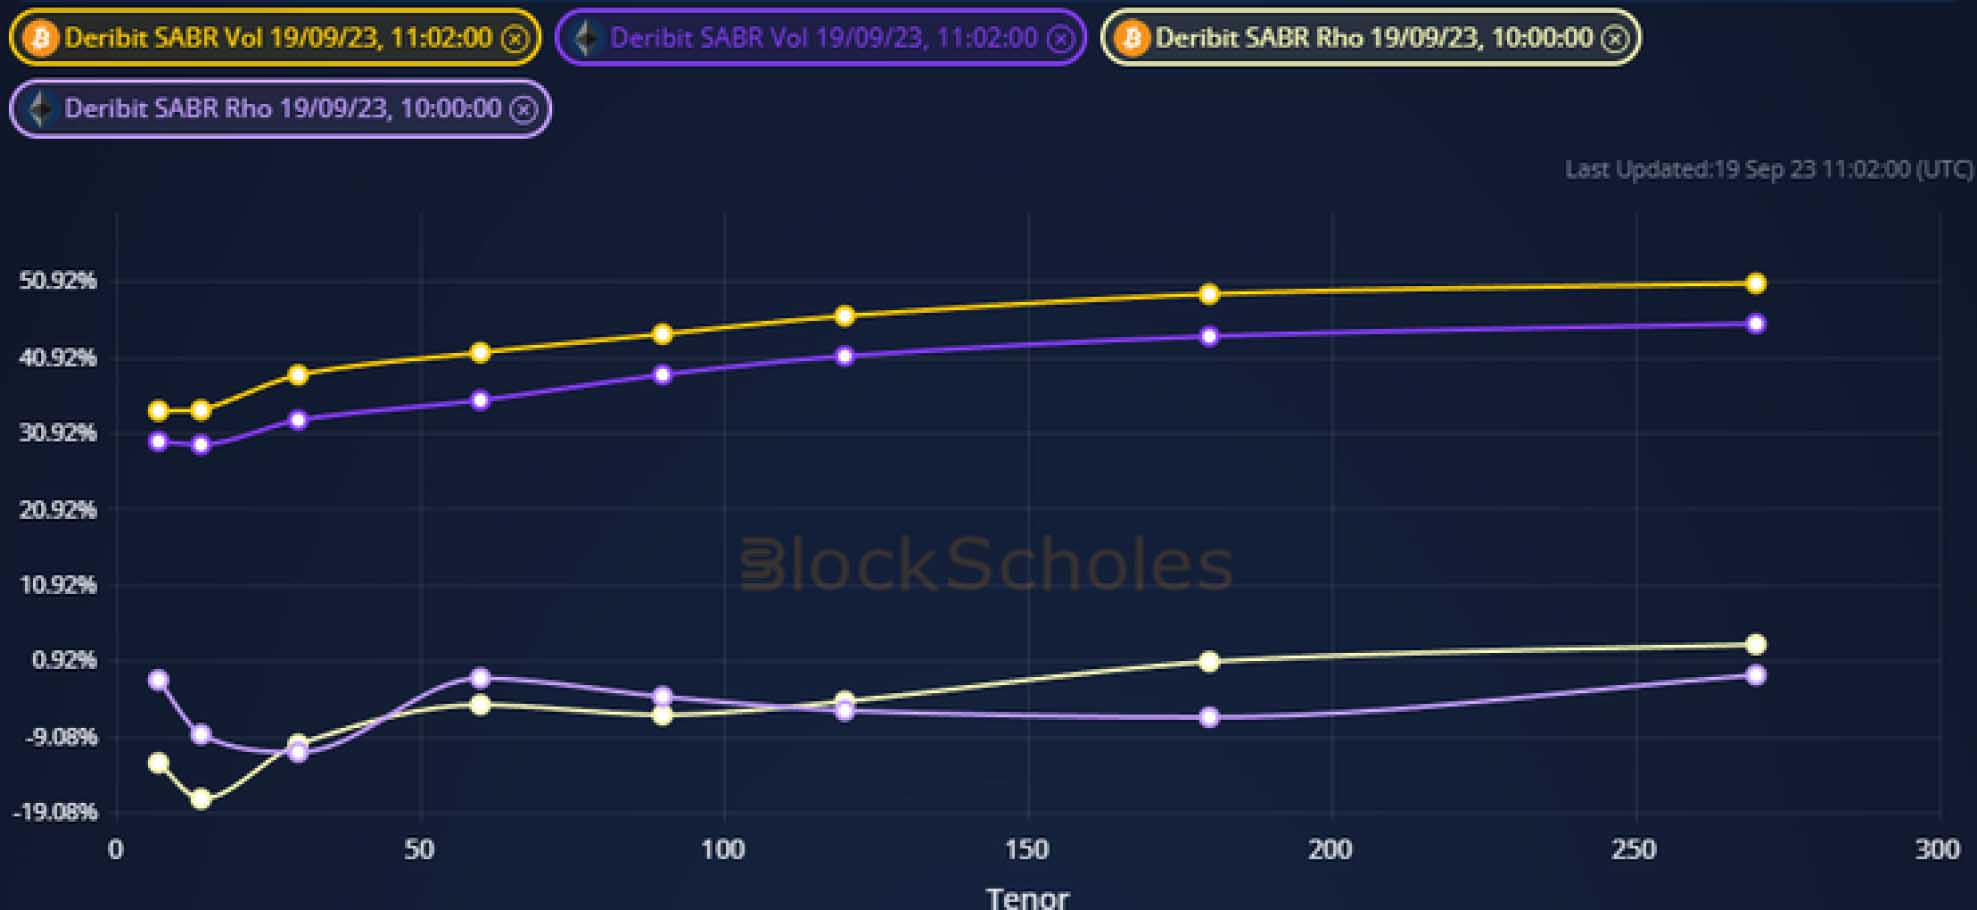
Figure 1 Term structures of at-the-money implied volatility (darker colours, top) and SABR Rho (lighter colours, bottom) for BTC (yellow) and ETH (purple) options at a 11:02 UTC 2023-09-19 snapshot. Source: Block Scholes
- ETH volatility remains 5-6 points below BTC’s at all tenors across the term structure.
- This is in contrast to their relative realised volatility levels, which over the previous 90-days have been at fairly close to each other at 35% and 36% for BTC and ETH respectively.
- We see broadly similar levels of a slight skew towards OTM puts for both assets.
Ratio of Implied Volatility

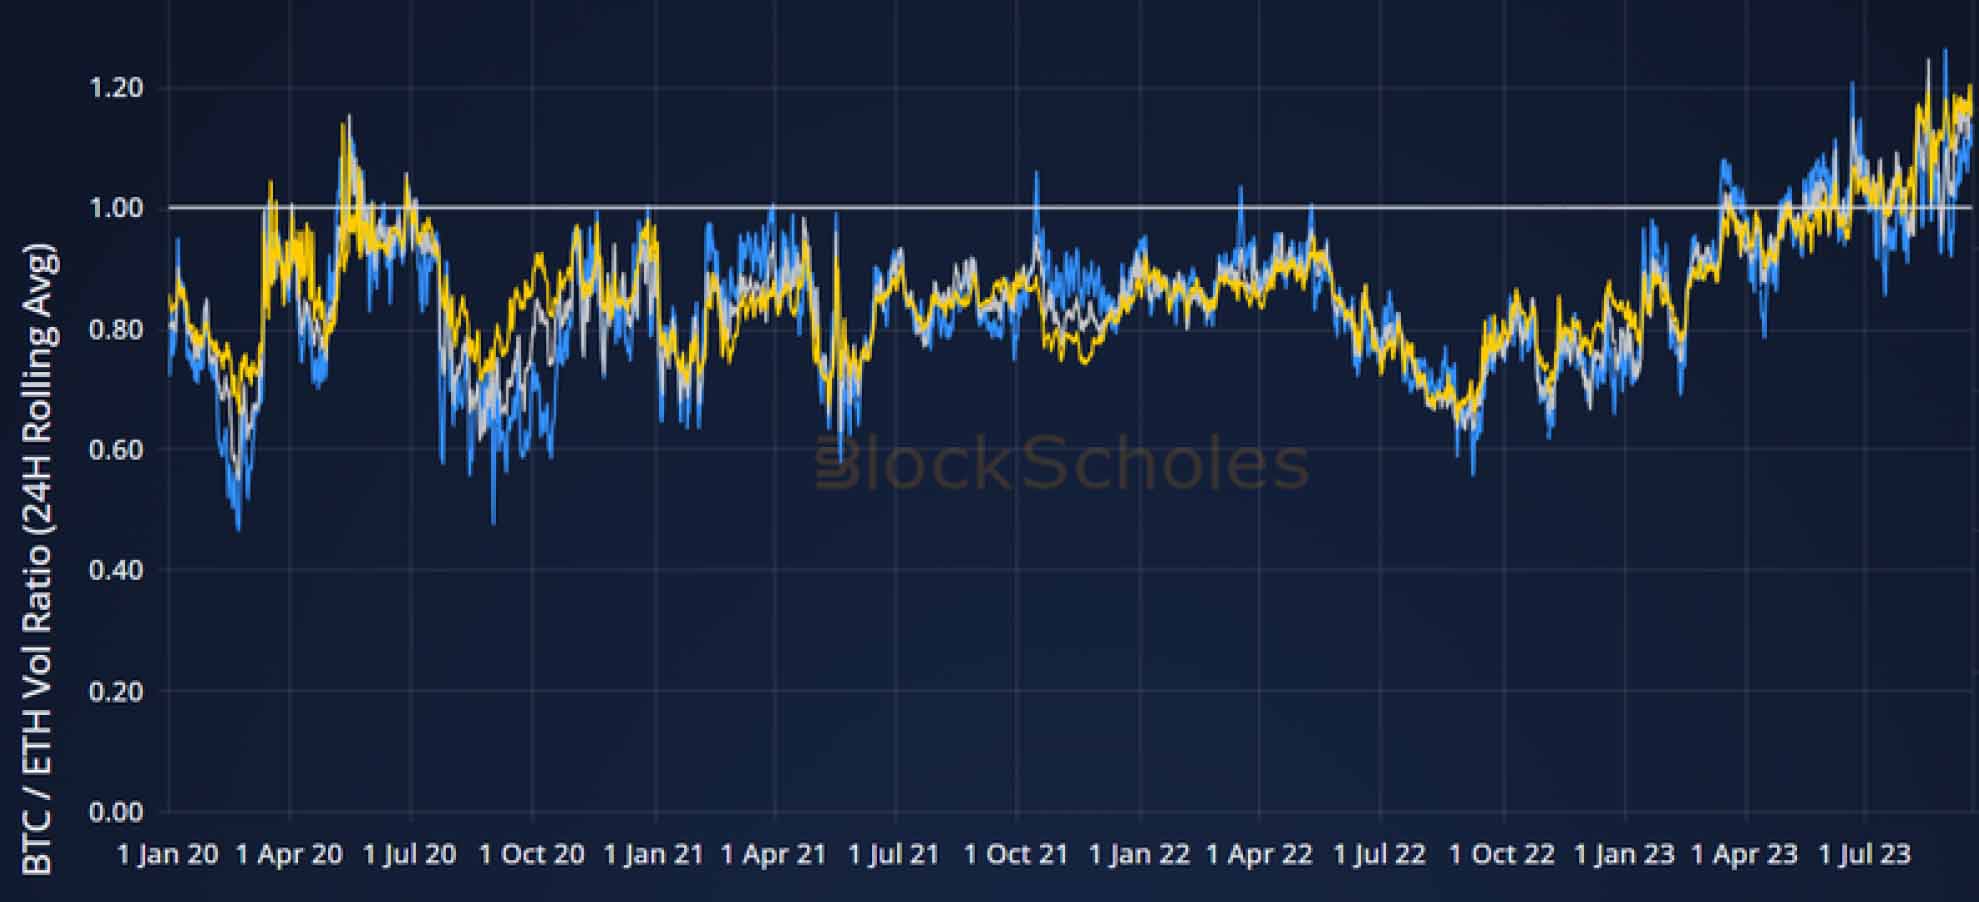
Figure 2 Rolling 24H average Ratio of BTC ATM implied volatility to ETH’s at a 1 week (blue), 1 month (grey), and 3 month (yellow) constant tenor since 1st Jan 2022. Source: Block Scholes
- The gap between the volatility of the two majors is at the largest we have observed.
- Since September last year, we have seen ETH volatility at all tenors trend down relative to equivalent the implied vol of equivalent options written on BTC.
- The trend passed the parity level earlier this year and now forecasts significantly lower volatility in ETH’s spot price.
Neutral Risk Reversals

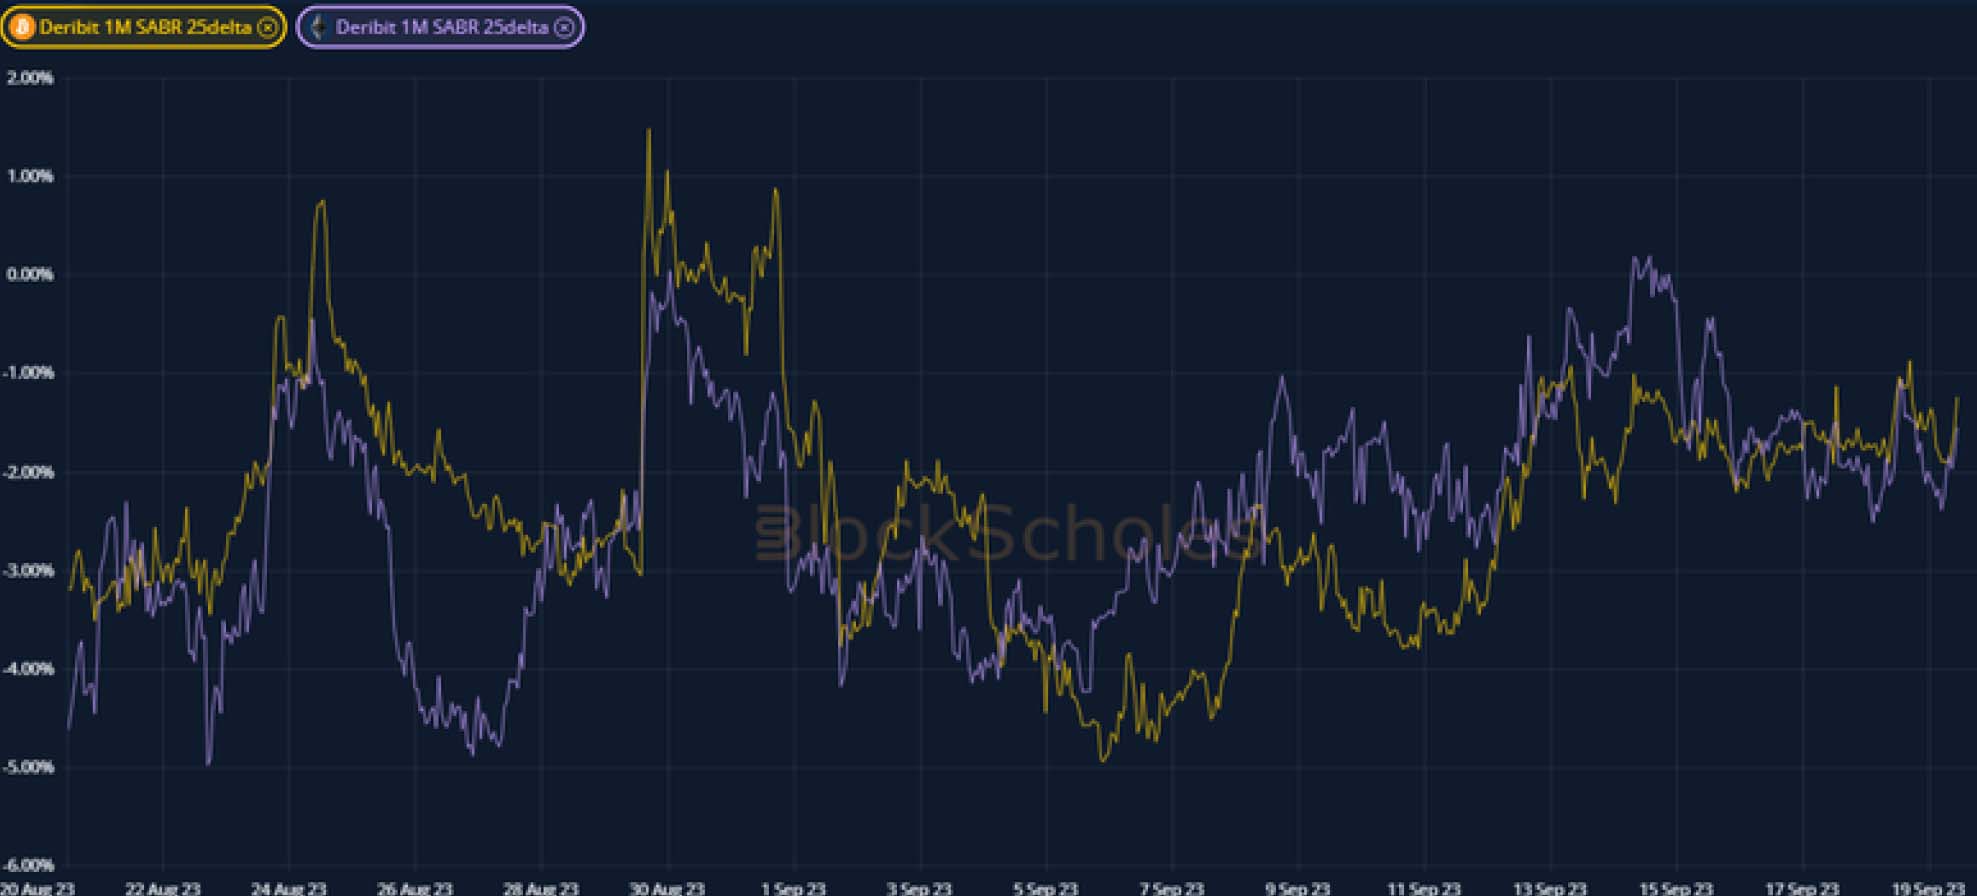
Figure 3 Hourly 25-delta risk reversal at a 1-month tenor for BTC (yellow) and ETH (purple) over the last 30 days. Source: Block Scholes
- Both assets now price for a similar skew towards OTM puts after ETHʼs briefly traded more neutral than BTCʼs.
- A moderate recovery trend from a sharp skew towards OTM puts has stablised in the last week, with both majors now expressing only a slight tilt towards downside protection.
- This contrasts against the distinct difference in outright vol levels – directional sentiment appears similarly priced, but traders expect BTC to move with much higher volatility.
- Both assets have increased their correlation to equities in recent weeks and it is likely that they will react similarly to the slew of economic headlines due this week.
- But a low, neutral vol smile suggests that crypto-asset derivative markets are not adjusting positioning ahead of FOMC meetings in the same way that they did 12 months ago.
AUTHOR(S)
