The term structures of both the ATM level and vol smile skew of ETH and BTC options show drastically different expectations for volatility over the next few months. ETH options have regained their implied volatility premium over BTC’s, whilst their skew towards puts suggests a desire to hedge risks to the downside in the short term. This dislocation may reflect traders’ positioning for Ethereum’s long awaited unlock of ETH on the Beacon chain is set for the 12th April, now just 8 days away.
ETH Volatility Term Structure is inverting

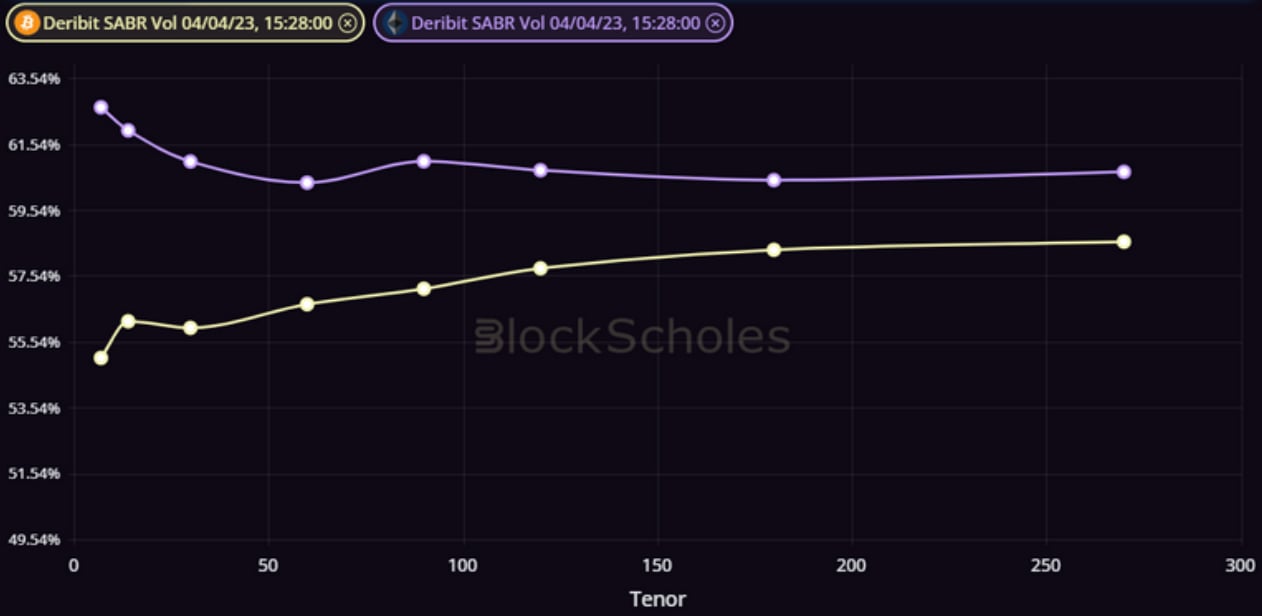
Figure 1 Term structure of BTC (pale yellow) and ETH (pale purple) at-the-money implied volatility at a 15:28 UTC 4/4/23 snapshot. Source: Block Scholes
- The term structure of at-the-money (ATM) implied volatility of ETH options is higher than BTC’s, with short term implied volatility at a slightly higher than the overall tight range
- BTC’s options market is pricing for a similarly flat term structure of volatility expectations, with short term volatility priced slightly lower than at longer tenors.
Term Structure of Skew

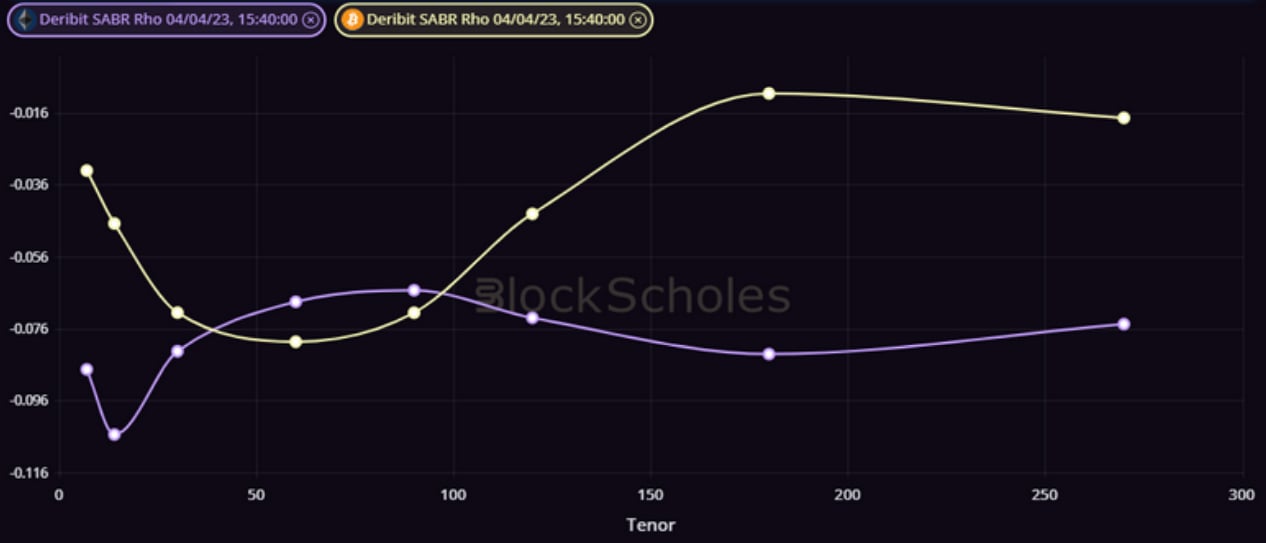
Figure 2 Term structure of BTC (pale yellow) and ETH (pale purple) SABR rho parameter at a 15:40 UTC 4/4/23 snapshot. Source: Block Scholes
The SABR Rho parameter corresponds to the correlation between the underlying asset and its implied volatility parameter in the SABR calibration used to model the volatility smile. It also controls the skew of that calibration towards OTM puts or calls. Positive values indicate a premium of OTM calls relative to puts, whilst a negative value indicates the market’s preference for OTM puts.
- The term structures of the skew of the two assets present an even more unusual divergence.
- The volatility smiles of both assets are skewed towards OTM puts, as shown by the negative skew values across the tenor domain for both plots.
- However, the pricing of BTC options reflect a stronger skew towards those puts than ETH’s do at a 2M and 3M tenor, whilst ETH options hold a higher preference for downside protection at all other points on the term structure.
The 2 week Smile Skew

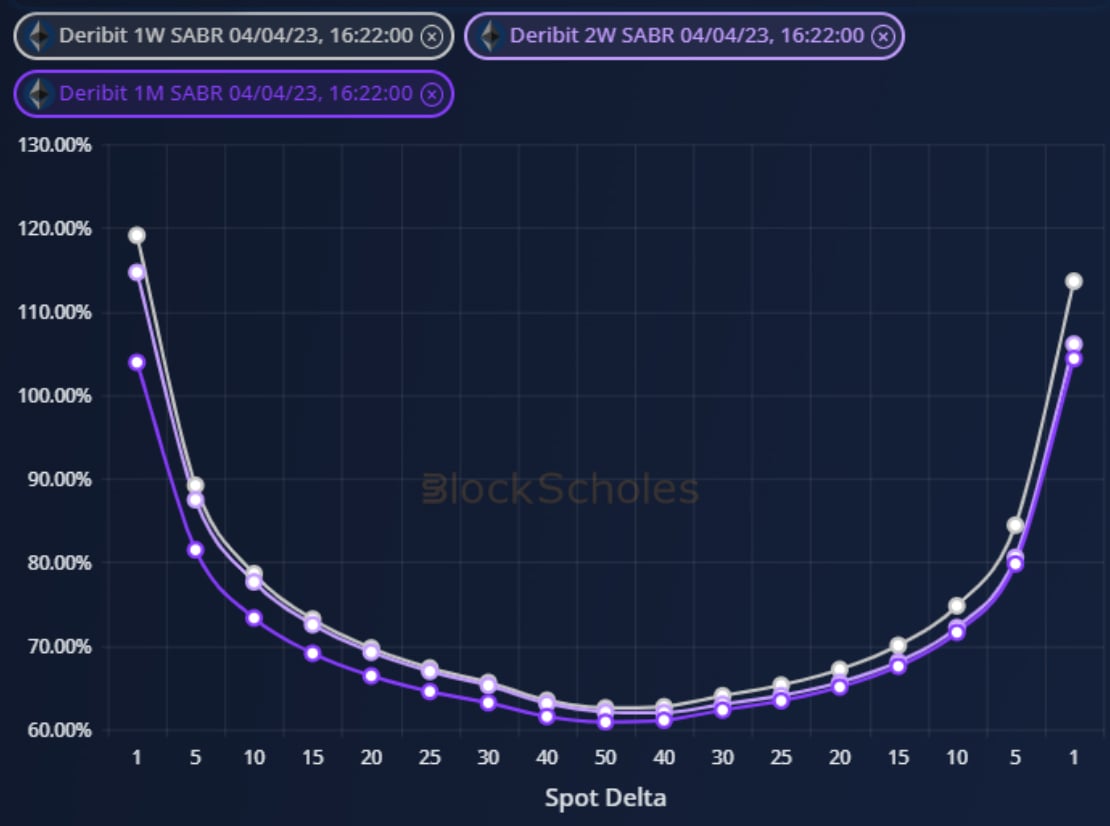
Figure 3 ETH’s volatility smile at a 1 week (grey), 2 week (pale purple) and a 1 month (dark purple) tenor for the 16:22 UTC 4/4/23 snapshot. Source: Block Scholes
- The oscillating skew of ETH options through the term structure leaves the two-week tenor volatility smile skewed much further towards OTM puts.
- OTM calls at a 2 week tenor are priced at a similarly low implied volatility level to those at a 1 week tenor, whilst 2 week dated puts are trading near to the higher levels of the 1 month vol smile.
AUTHOR(S)
