
A long and arduous year for crypto-assets is reflected by the extreme pricing in derivatives markets.
All three parameters that generate today’s SABR volatility smile are at (or near to) their most extreme levels. This means that crypto-asset derivatives markets are implying the lowest ATM volatility, assigning the most premia to OTM puts and calls, and are continuing to express an extreme preference for protection against downside volatility.
ATM Volatility
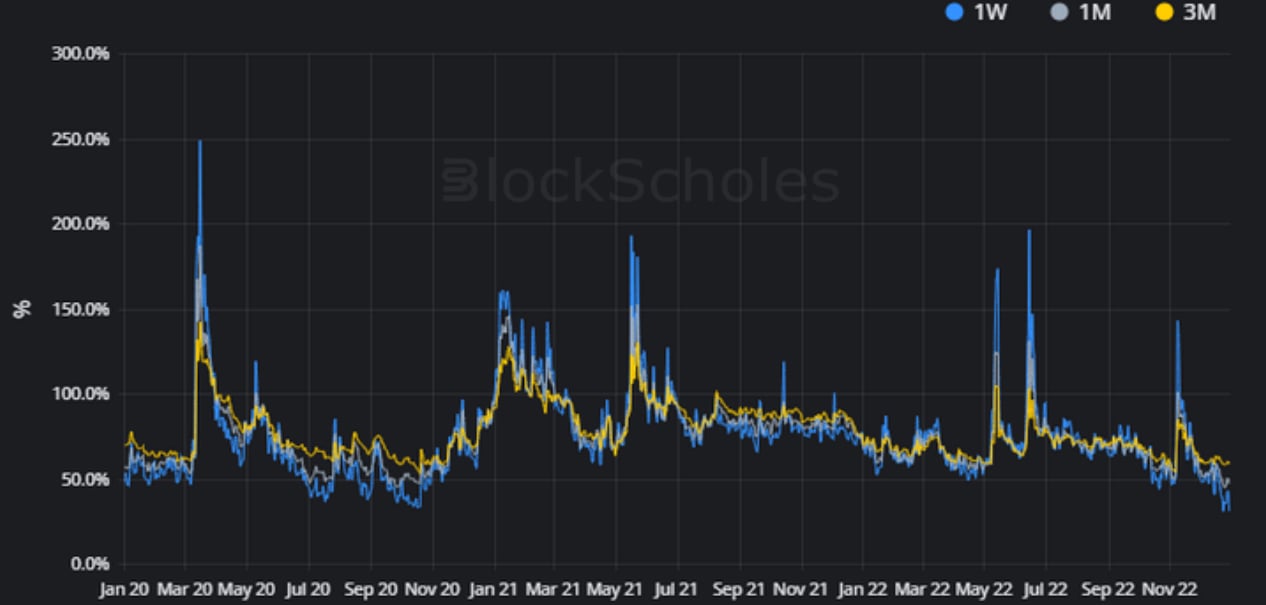
Figure 1 Daily SABR calibrated ATM implied volatility at 1W (blue), 1M (grey), and 3M (yellow) tenors from 1st Jan 2020. Source: Block Scholes
- Following the collapse of FTX, ATM volatility has resumed the downwards drift it has experienced since the beginning of the year.
- It is now trading near to its lowest levels ever recorded, at just 55% for a 3M tenor option and a shockingly low 28% for a 1W tenor option.
- Levels as low as these were last seen before the UST crash in May 2022, November 2020, and before the COVID-19 crash in March 2020.
Volatility of Volatility
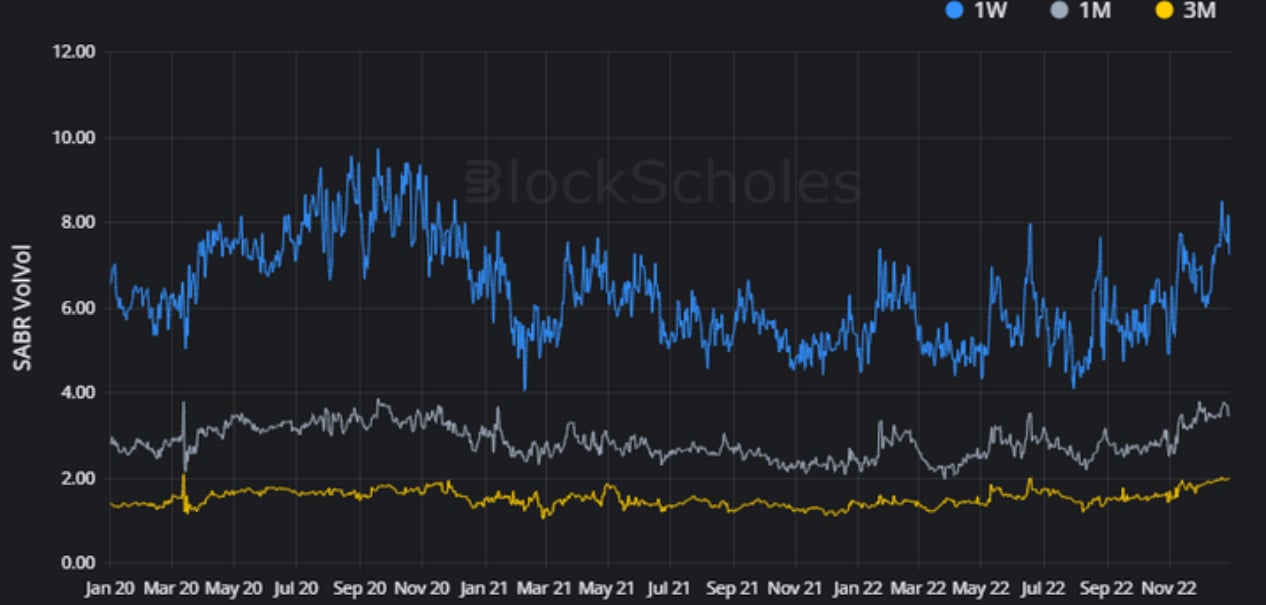
Figure 2 Daily SABR calibrated volatility of volatility at 1W (blue), 1M (grey), and 3M (yellow) tenors from 1st Jan 2020. Source: Block Scholes
The SABR Vol of Vol parameter corresponds to the volatility of volatility used to model the volatility smile. The higher the volatility of volatility, the steeper the smile and the more expensive deep OTM puts and calls are when compared to options struck ATM.
- The low volatility implied by options struck at-the-money is contrasted with a volatility of volatility that is near its highest levels at all tenors shorter than 6M.
- This means that derivatives traders are still assigning a rich premium to OTM puts and calls, compared to options struck ATM.
- This behaviour is justified given that the previous periods of low ATM volatility seen in 2022 were followed by sharp swings downwards in spot price.
- This extreme value reflects that the fear of further contagion is still the dominant narrative driving price action in crypto-assets.
RHO
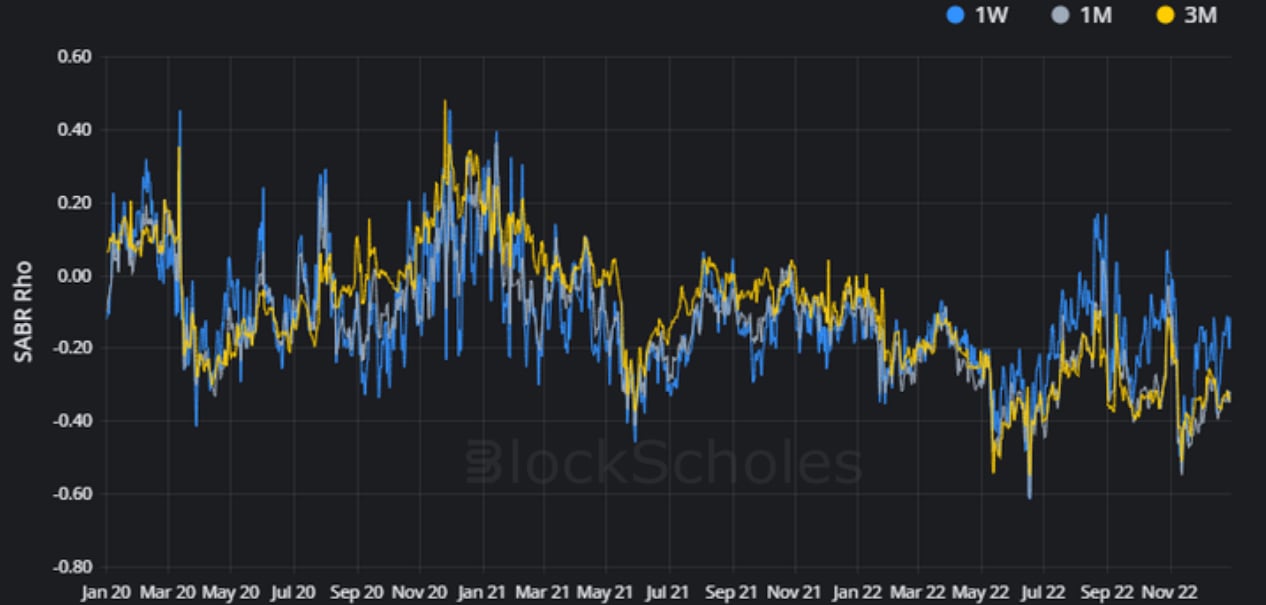
Figure 3 Daily SABR calibrated rho at 1W (blue), 1M (grey), and 3M (yellow) tenors from 1st Jan 2020. Source: Block Scholes
- That fear has also resulted in the volatility smile leaning heavily towards OTM puts, as it has since the UST crash in May.
- As commented on in previous weekly reports, 1W tenors have been consistently pricing for a more neutral volatility smile since that date.
- This may be because traders are looking for longer-term insurance against sharp selloffs, which have proved difficult to anticipate in the latter half of the year.
AUTHOR(S)
Trading with a competitive edge. Providing robust quantitative modelling and pricing engines across crypto derivatives and risk metrics.