

Throughout my career in oil trading, I’d always fear that the market is waiting for me to be off on holiday before some catastrophe occurs. But it’s never happened, and I’ve wasted cautious hedges. Anyway, it remains important, tail events don’t become less likely the longer it doesn’t happen (or do they?!).
BTC hit new highs around $123k on 14th July 2025 following a breakout through the last and very recent ATH of $112k, and here we are again nibbling at this new high. The positive news flow highlighted in @nathanieljcox ‘s previous commentary continues to add fuel to the momentum up, particularly looking over a short-term horizon (looks to have started around 5th August).
Some short liquidations are playing a part in an attempted breakout, but volatility and skew remain somewhere sunny and chilled (see current levels below, and Charts 1 and 2). This supports the view of a patient market looking for the next impetus, with eyes watching for macro catalysts and aware of the potential for unexpected news flow.
Recall the events in the last two Augusts: the Bank of Japan’s surprise rate hike at the end of July 2024, roiling global markets over August, and the sudden fall on 17th August 2023, around the time of China-related market stresses from its property market and shadow banking sectors.
Chart 1 – Bitcoin Volatility
Volatility and Skew:
28-day RV = 30.9%, near to October 2023 lows
30-day IV = 33.7%, near to October 2023 lows
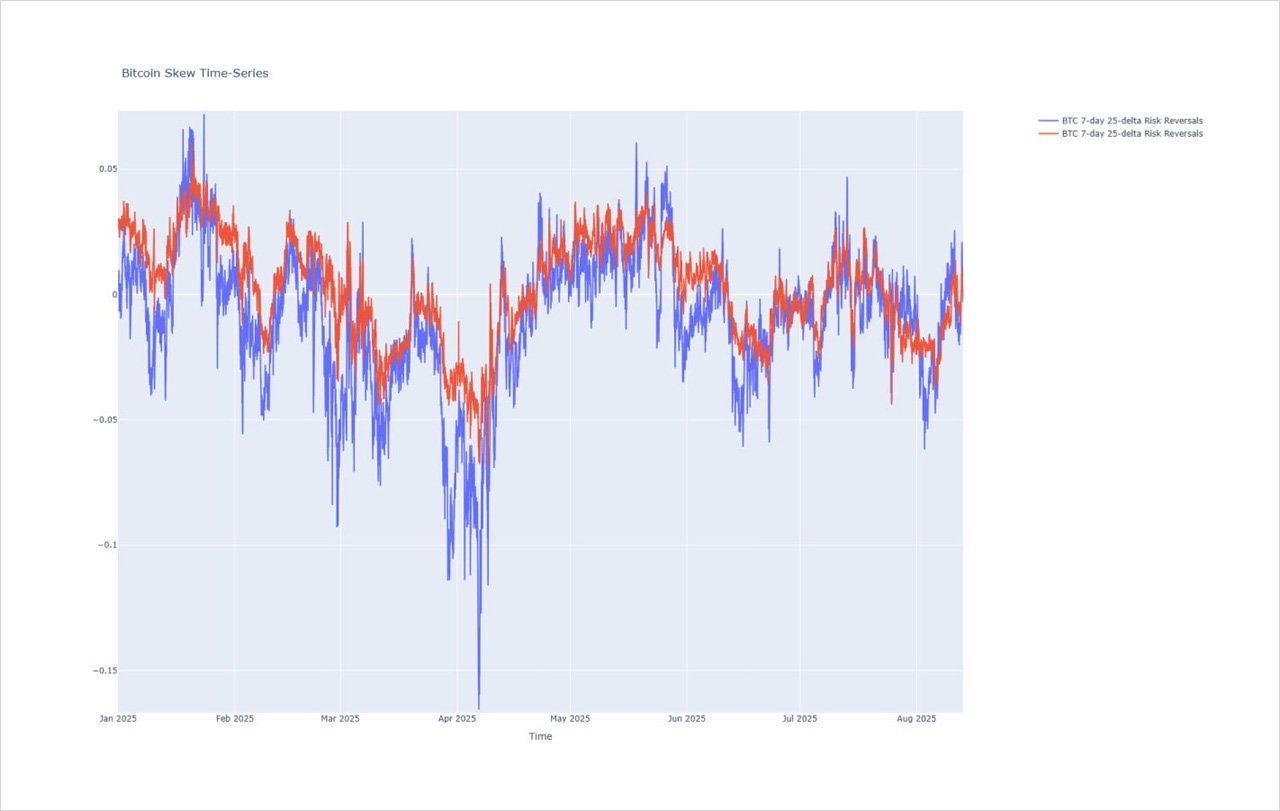
7-day 25-delta Risk Reversals = +1.1%
30-day 25-delta Risk Reversals = +0.6%…
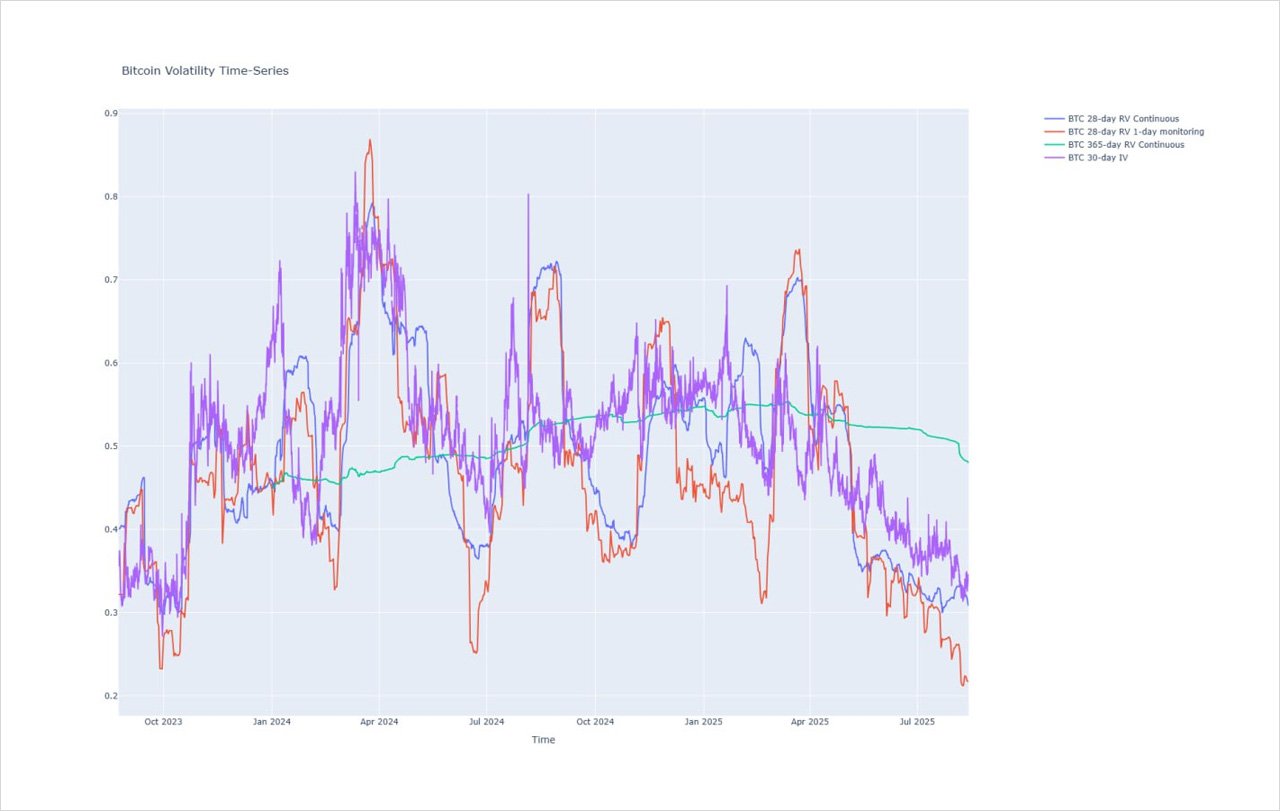
There is a lot of interesting stuff going on in options, and the first observation is on volatility risk premium. Nearby implied volatility is historically low, and on first glance, it isn’t far off what one can capture via realisable vol (see Chart 1, particularly 30-day IV and 28-day RV Continuous), i.e., it’s fairly priced on a continuous hedging basis with 2.8% of vol points compensation for jump risk.
Now, if you can rehedge once a day (or less), the analysis suggests you could be earning 12% vol points of vega for your skill and bravery (see Chart 1, 28-day RV Continuous vs 1-day monitoring)!
Chart 2 – Bitcoin Skew
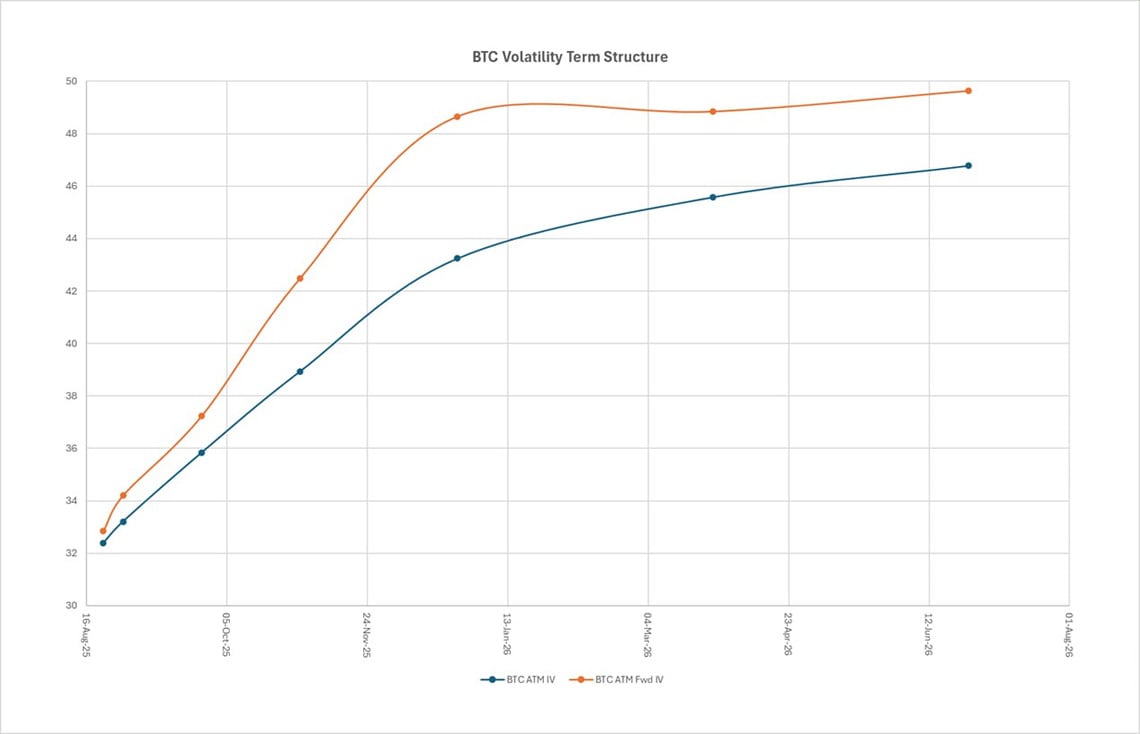
My second observation is on the longer end. Looking towards the end of the year (which seems so far away in time and season), Dec2025 ATM implied volatility looks very cheap at 43.1% on a first look.
But that’s the average expected volatility from now to then, and the Oct to Dec forward implied volatility is 48.6% which represents options traders’ view of where structural volatility lies.
Chart 3 – Bitcoin Vol Term Structure
Judging from the whole forward implied volatility curve, volatility traders return from holidays by the end of September, unless they are called back early for the next unexpected event. This one is already back and ready for action.
Disclaimer
This article reflects the personal views of its author, not Deribit or its affiliates. Deribit has neither reviewed nor endorsed its content.
Deribit does not offer investment advice or endorsements. The information herein is informational and shouldn’t be seen as financial advice. Always do your own research and consult professionals before investing.
Financial investments carry risks, including capital loss. Neither Deribit nor the article’s author assumes liability for decisions based on this content.
THANKS TO
Conrad Carvalho, Head of Trading – Two Prime