

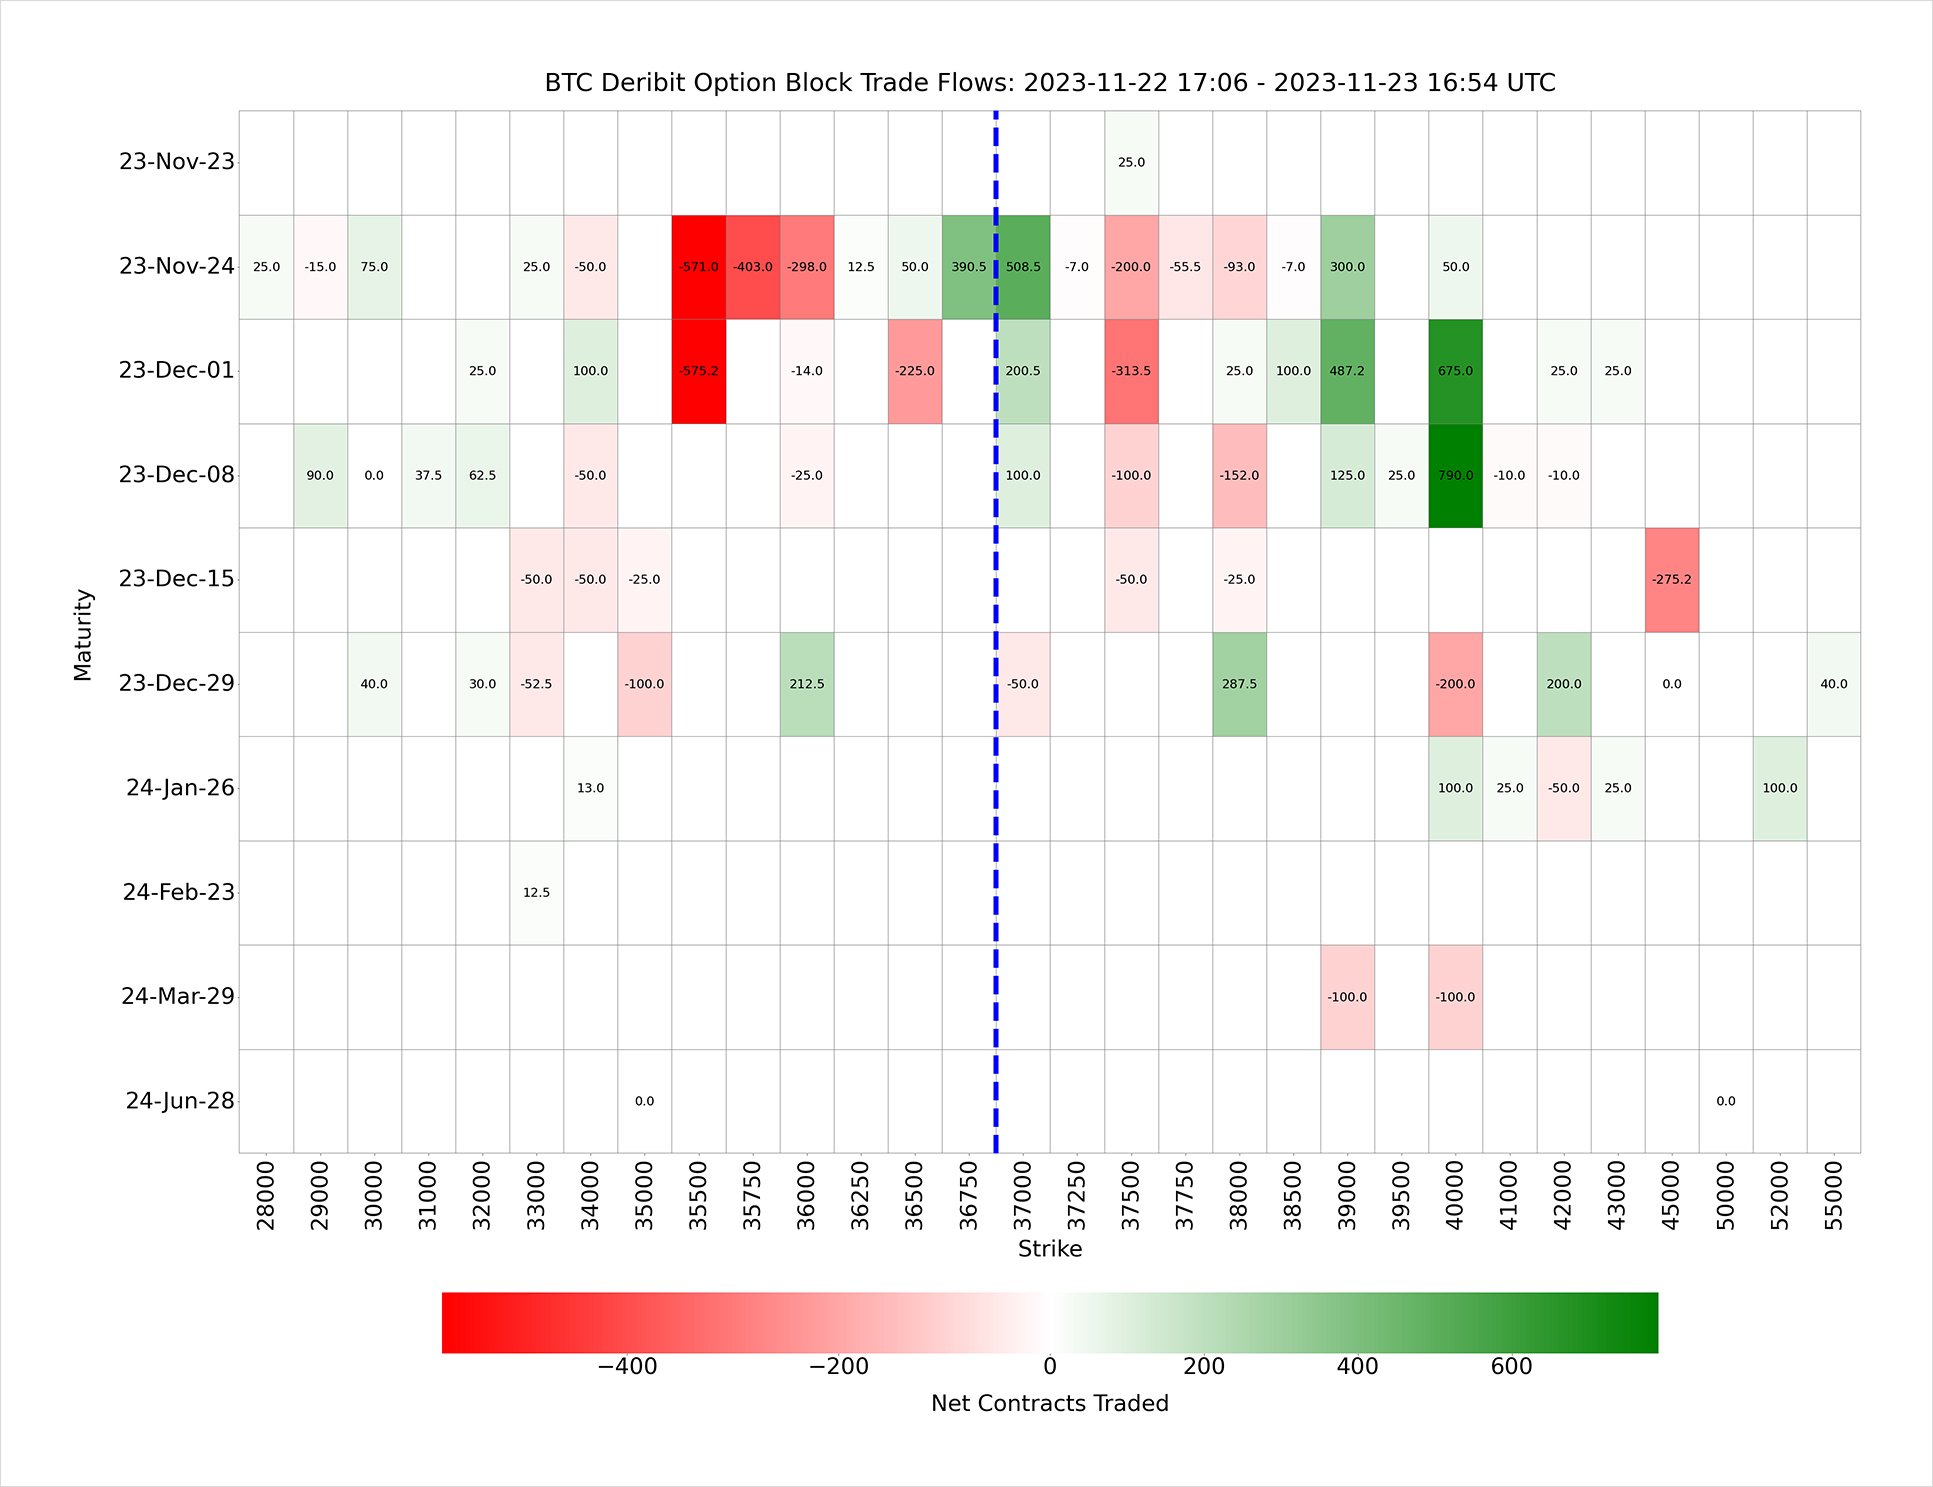
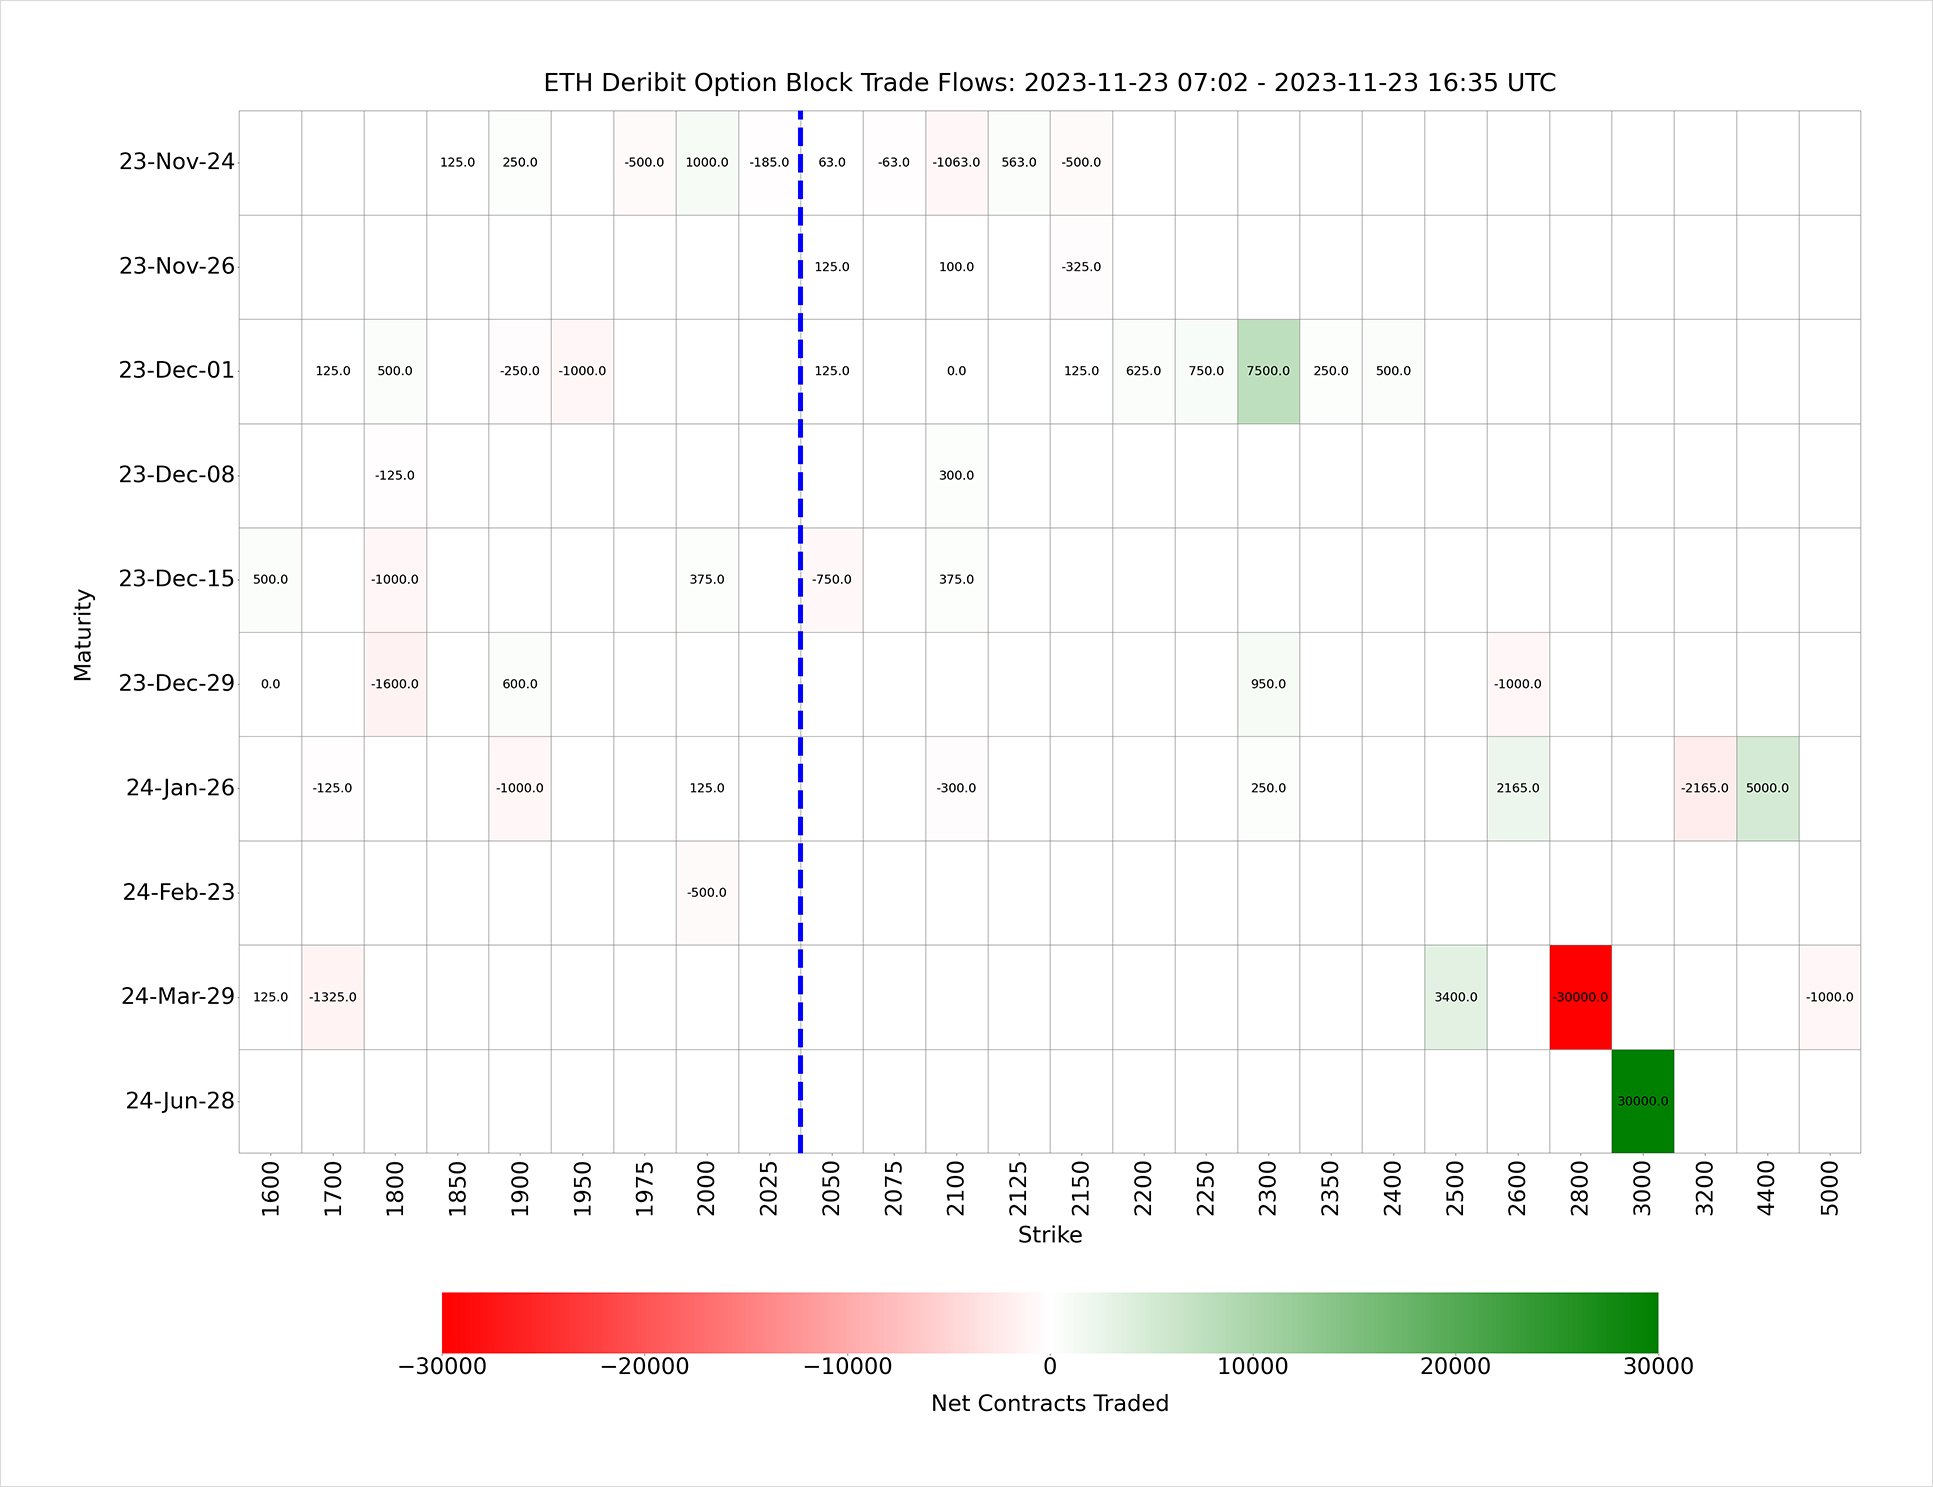
This Python script visualizes the flow of block option trades on Deribit for BTC or ETH using a heatmap. It fetches historical trade data, processes it, and generates a heatmap to analyze trade flows based on maturity and strike prices.
Usage
1. Initialization: Create an instance of the HeatMap class:
• asset: The cryptocurrency asset, either ‘BTC’ or ‘ETH’.
• lookback_hours: The number of hours to look back for trades.
2. Generating the Heatmap:
This method fetches the data, cleans it, and plots the heatmap. The heatmap shows option trade flows with maturity dates on the y-axis and strike prices on the x-axis. The blue vertical line represents the strike closest to the current price of the asset. Lastly, the script saves a heatmap image visualizing the trade flows during the specified lookback period.
Examples
Example 1: Bitcoin 24-Hour Trade Flow
Generates and saves a heatmap for Bitcoin option block trades over the past 24 hours.
Example 2: Ethereum 48-Hour Trade Flow
Generates and saves a heatmap for Ethereum option block trades over the past 12 hours.
Dependencies
To use the HeatMap class, ensure you have the following Python libraries installed. You can install all required dependencies via pip with this command:
AUTHOR(S)
Crypto derivatives quant trader + researcher. Views are my own and not investment advice. Learn more about Samneet on Twitter/X.