
Welcome to this overview of some free python code that uses historical price data to calculate and display historical volatility.
The GitHub repository can be found here.
The program was designed using daily historical pricing data downloaded from yahoo finance. This can be found here for example.
The daily price data is downloaded as a csv, and the sample data provided is for bitcoin (BTCUSD). If you would like to try other assets you will just need to edit the name of your csv file, or edit the line of code that reads in the csv data.
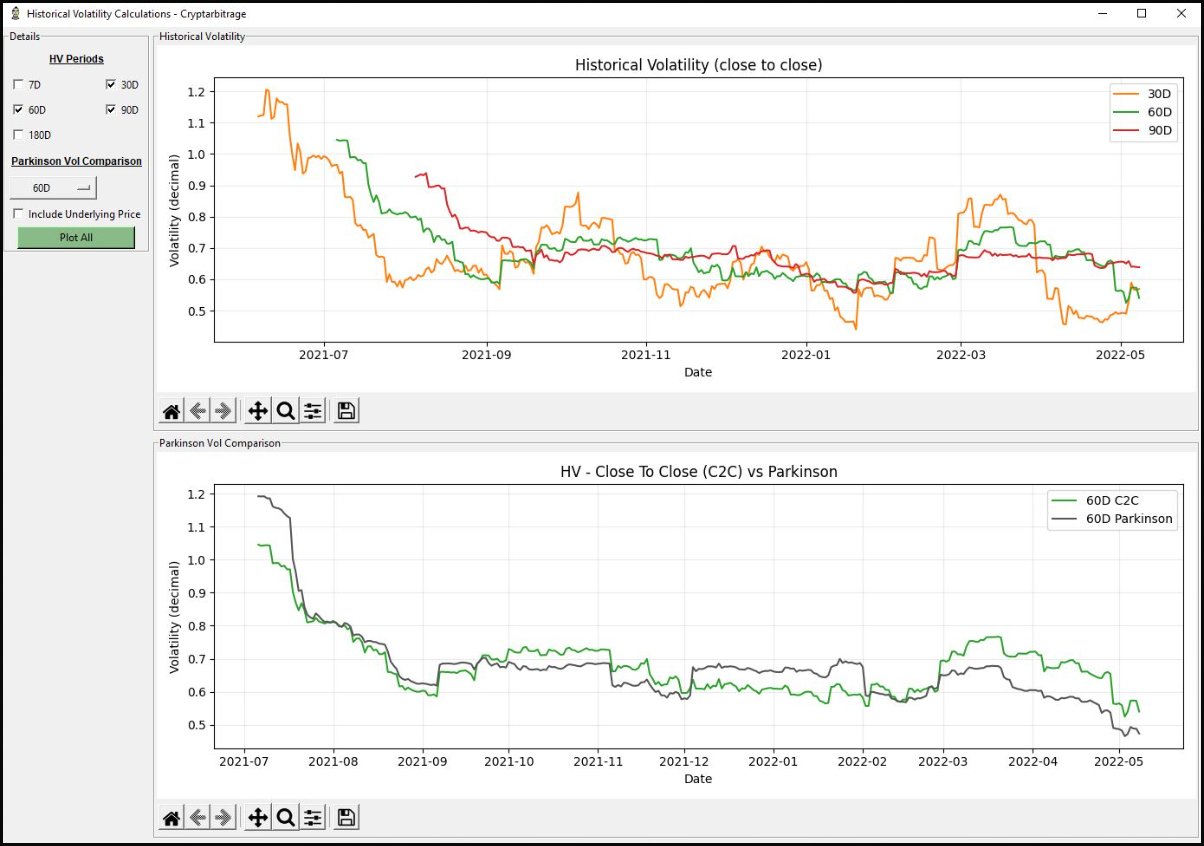
The first chart shows the historical volatility, calculated over various periods, using the close to close method.
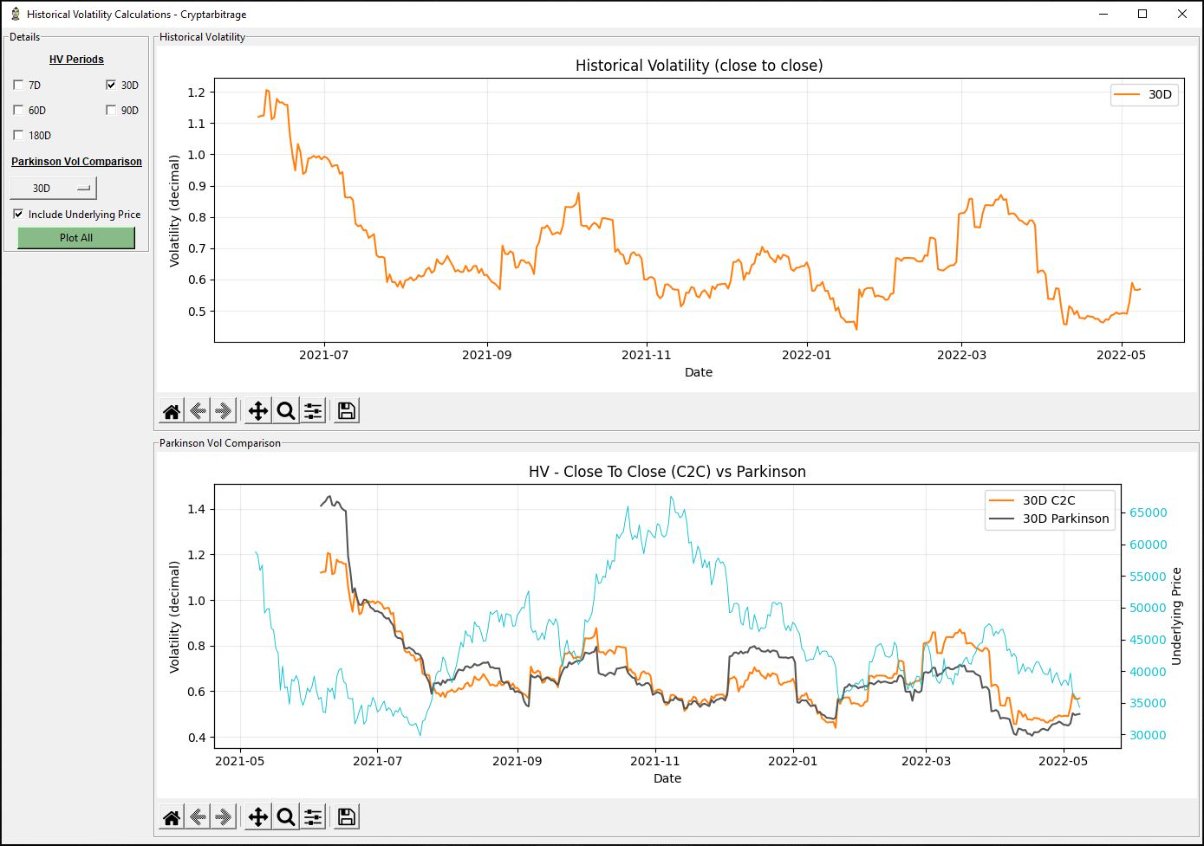
The second chart compares the volatility using the close to close and Parkinson calculation methods. It does this for a single selected period. It is also possible to overlay the underlying price on this chart as well.
As the name suggests, the close to close method uses the closing price each day to determine how far the price has moved since the previous close, and calculates the volatility based on this move.
The Parkinson method uses the high and low of each day to calculate the volatility. As such it uses more data points for calculation (the highs and lows of each day, rather than just the closes).
There is no single ‘correct’ measure of volatility, so it can be useful to use more than one method to give a fuller picture of volatility.
The program can be used as is, but is still relatively simple, and so may be more useful to edit and build into your own software. To use the software as is though, the user first selects each of the time periods they would like to view the close to close volatility for. Then they select which time period they would like to compare to the Parkinson volatility, and whether they would also like to see the underlying price. Clicking ‘Plot All’ will then update the charts to display with the chosen settings.
Python UI libraries
Tkinter is used for the GUI, and Matplotlib is used to plot the charts. Both are very commonly used libraries in Python, so there is plenty of information available online if you want to edit things.
Using the code
This code is free for all to use and edit as they wish. I hope each program is useful as it is, but they are also meant to be building blocks with which you can build your own more personalised applications.