

It has been a volatile year even by cryptocurrency markets’ standards. As coronavirus fears brought down traditional markets in March, Bitcoin followed along, putting claims of Bitcoin being a safe haven under scrutiny. Quickly thereafter, though, Bitcoin rebounded as the narrative of digital scarcity took over as Bitcoin approached its third halving. Since then, Bitcoin and most cryptocurrencies have been trading range-bound for over a month.
Despite price action staying relatively stable, interesting patterns are emerging in on-chain and market activity. Analyzing IntoTheBlock data we are able to create a holistic overview of the current state of Bitcoin, attaining a better understanding of its fundamentals based on network activity, ownership patterns, correlations with broader markets, order book data, and derivatives markets.
Number of Bitcoin Holders Rebounds
Leveraging Bitcoin’s transparent nature, we are able to extract valuable information unique to the nature of a digital asset. One particularly relevant data point is the number of addresses that own Bitcoin. While the number of addresses does not necessarily equal the number of users, it is a helpful proxy to track the number of participants in the network.
Using Total Addresses indicator, we can see that the number of addresses with a balance of BTC peaked just below 30.5 million addresses on May 1st. Since then, the number of Bitcoin holders decreased by 370k hitting a local low on June 13 as seen on the image below:
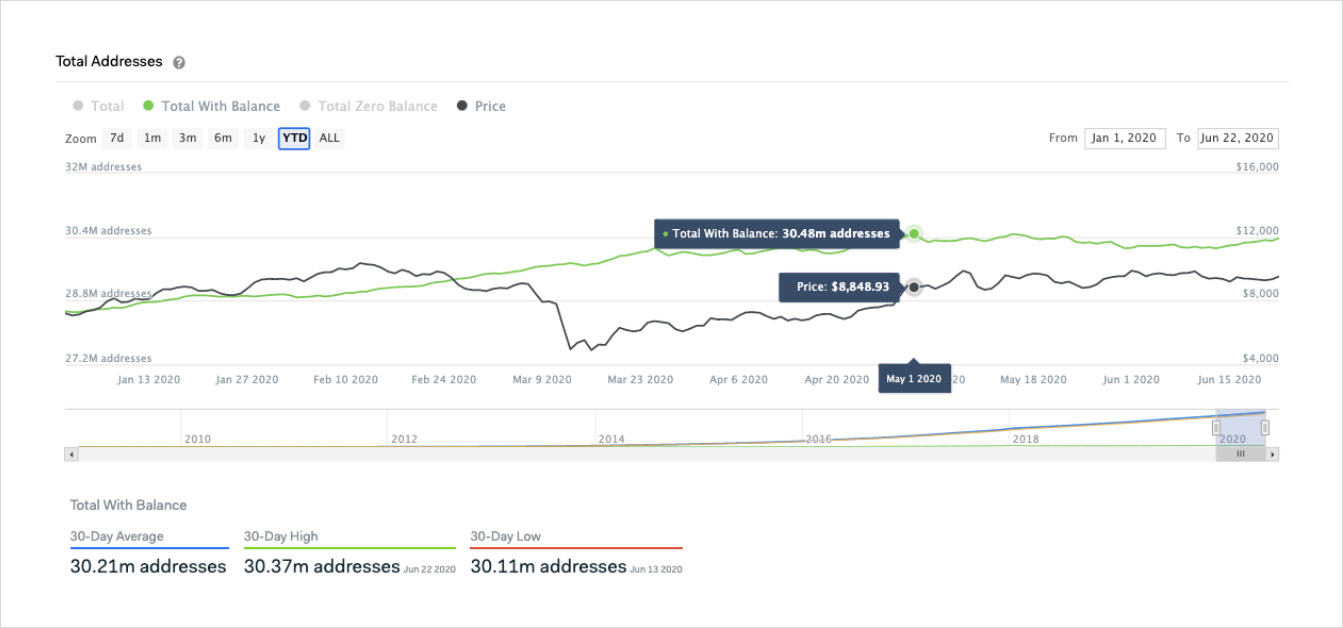
Throughout the second half of June, this trend has reversed, with total addresses with a balance reaching a monthly high on June 22nd, the most recent day with data as of the time of writing.
While the number of addresses holding Bitcoin is not necessarily a predictor of price, it does provide a sense of the number of actors holding and transacting the cryptocurrency. Historically it has also loosely followed price action, with a prior peak recorded in January 2018. Moreover, being used mainly as a medium of exchange or potential store of value, Bitcoin derives fundamental value from users actually owning and using the asset. Hence, the rebounding number of holders can be interpreted as a positive development in network activity for Bitcoin.
Bitcoin Hodlers Approach a Major Milestone
Expanding on the idea of Bitcoin accruing value from the number of addresses that hold it, its potential as a store of value also depends on how its holders use it. Since an essential characteristic of a store of value is to preserve its value without depreciating, if in aggregate Bitcoin holders were constantly selling — generating down-side price pressure — it would be unable to sustain its purchasing power and store of value status.
On the other hand, users that have a long-term investment horizon support Bitcoin’s proposition as a store of value. Hodlers, which IntoTheBlock defines as addresses with a holding period of over a year, provide this base for Bitcoin as a store of value.
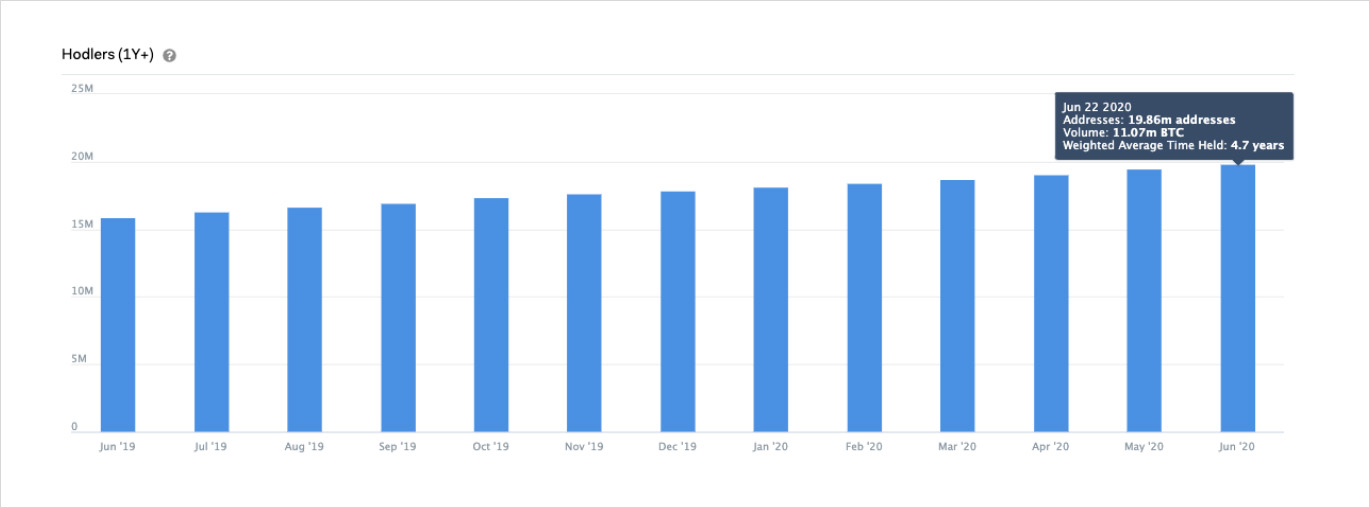
As can be seen in the image above, the number of addresses ‘hodling’ Bitcoin has been on a consistent up-trend throughout the year despite the aforementioned volatility. Currently, this number is approaching 20 million, or roughly two-thirds of all addresses with a balance. Similarly, approximately 60% of the circulating supply of Bitcoin is held by these addresses with an average time held of 4.7 years.
This constant growth in long-term investors contributes to the narrative of Bitcoin as a store of value since hodlers have proven to not sell their tokens regardless of price action and volatility. Therefore, the growing community of hodlers adds to the strengthening fundamentals demonstrated by on-chain data.
Bitcoin’s Correlation with Traditional Markets Raises Concerns
Along with the narrative of Bitcoin as a store of value, several Bitcoin enthusiasts have claimed that it can also be a safe haven. One of the defining traits of a safe haven asset is that it is expected to retain or increase in value during market downturns. In order to achieve this feat, a safe haven asset would have to be uncorrelated or negatively correlated with broader markets. So how has Bitcoin performed during turbulent times this year?
During the stock market sell-off in February and March, Bitcoin — and the majority of cryptocurrencies — crashed even further. Specifically, on March 12, when the S&P 500 dropped nearly 10%, Bitcoin dropped the third-highest amount within a 24-hour period, over 35%, in what is now dubbed Black Thursday in the crypto space. As a result of this drop, Bitcoin exhibited a strong positive correlation with major stock indices, and its potential as a safe haven asset came under scrutiny.
While this correlation decreased in the following months, it has been on an uptrend since late May. In part, fear of the second wave of coronavirus infections halting the reopening of the economy has appeared to have an effect on Bitcoin’s and stock indices’ prices. On June 19, the 30-day correlation coefficient of Bitcoin and the S&P 500 reached 0.72, implying a very strong positive relationship between the two. Since then the correlation coefficient between Bitcoin and major stock indices has eased as shown in the chart below:
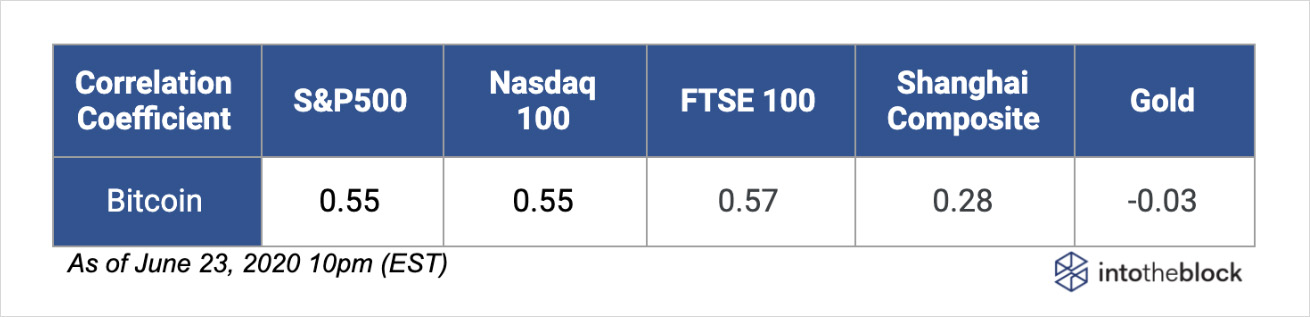
Despite the decrease in recent days, the correlation between Bitcoin and global stock indices remains quite high, while exhibiting almost no relationship with the price of gold. This creates further doubts about Bitcoin’s proposition as a safe haven and raises concerns about a potential crash like the one seen in March dragging Bitcoin along.
Furthermore, the recent high correlations with traditional markets alongside the higher variation in price swings raise the possibility of Bitcoin being a different asset category. Particularly, it seems to be behaving as a high sentiment beta, a term introduced by renowned researchers Malcolm Baker and Jeffrey Wurgler in their paper Investor Sentiment in the Stock Market. One of the key points highlighted in the paper introduces the concept of high sentiment betas as “stocks of low capitalization, younger, unprofitable, high-volatility, non-dividend paying, growth companies… (that) are likely to be disproportionately sensitive to broad waves of investor sentiment.” (Baker, Wurgler 2007).
While this argument seems to apply to Bitcoin under the current market conditions, it does not mean that it will define it long-term. Recall that correlation does not imply causation and that despite Bitcoin dropping in tandem with stock markets earlier this year, there is no guarantee that history will repeat itself. Therefore, even though the data currently points to Bitcoin following traditional markets as a high sentiment beta, it is still possible that it will grow into a safe haven as the market matures.
Spot and Derivatives Markets Signal Bullish Trading Activity
Speaking about markets, in addition to on-chain activity, spot and derivatives market data are also a key to comprehend Bitcoin. Recently, the team at IntoTheBlock spotted insightful trends in the order book indicator, Trades per Side.
The Trades per Side metric displays an aggregate of the taker side of transactions in major spot exchanges minute by minute. Recall that market-makers supply liquidity to an order book by setting limit orders, while takers remove liquidity by executing market orders at the bid or ask prices. Since market-takers pay higher fees and are able to execute trades near-instantaneously, the aggregate taker positioning shows a sense of urgency in either direction. Additionally, high dominance of buyers or sellers as takers tends to coincide with large price movements in the respective direction.
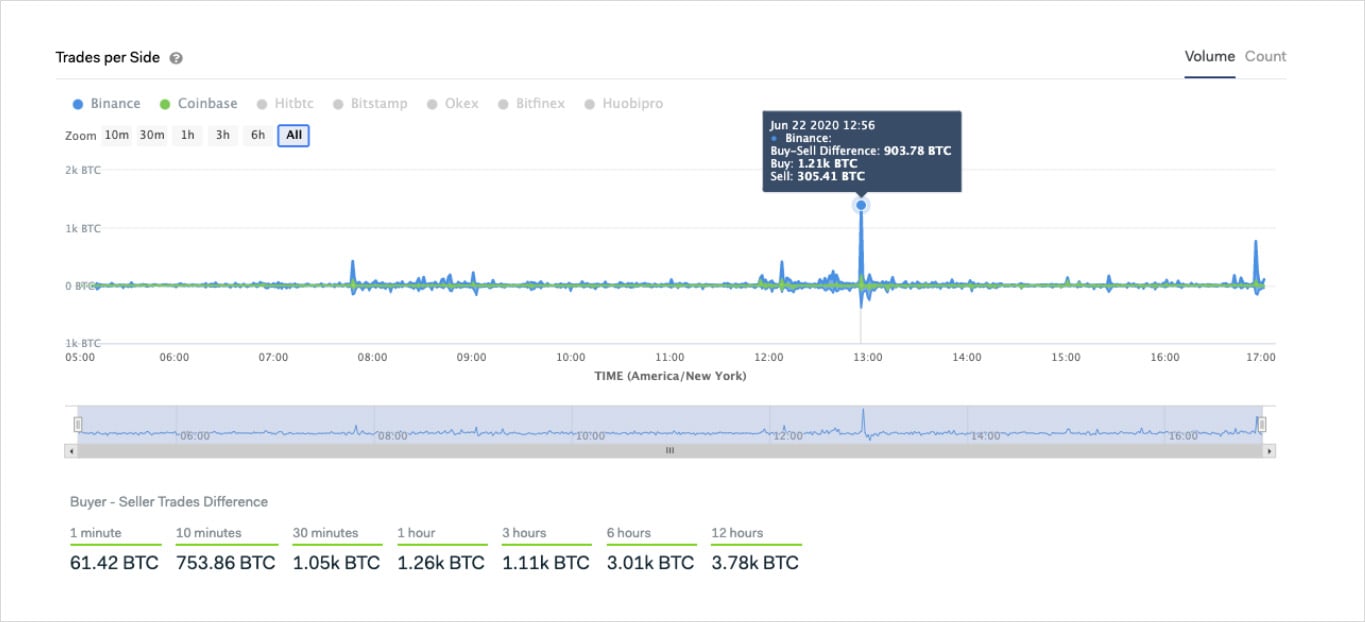
Recently, on June 22 at 12:56 pm EST, IntoTheBlock’s Trades per Side indicator signaled a high amount of buyers crossed the spread. As displayed on the image above, the difference in volume between taker-buyers and taker-sellers was over 900 bitcoin ($8.64M) in just one minute on Binance. Following this spike, Bitcoin proceeded to increase by 2.3% within 4 hours.
While order book indicators signaled a short-term bullish trend, derivatives markets reached a level that had not been achieved in nearly 6 months. The total dollar value of outstanding positions on Bitcoin perpetual swaps reached $2 billion for the first time since February, as shown in the Open Interest indicator below:
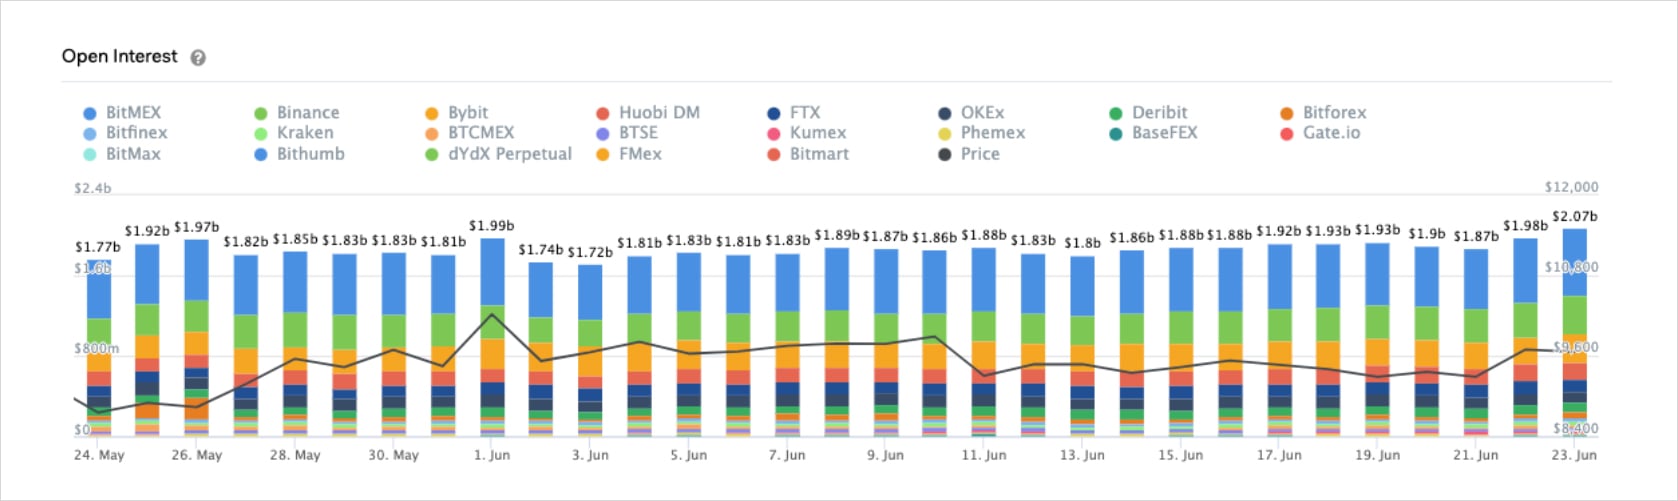
Having reached a 7-day low on June 21, Bitcoin’s Open Interest on crypto derivatives exchanges managed to increase over 10% within two days. In general, an increase in price followed by an increase in open interest is interpreted as a bullish signal pointing to more bullish positions opening, confirming an upward trend.
By analyzing key indicators of Bitcoin’s network activity, ownership patterns, relationship with stock indices, order book data, and derivatives metrics, we are able to create a comprehensive overview of Bitcoin’s current state. While on-chain patterns and spot and derivatives exchanges signal positive developments for Bitcoin, an increasing correlation with traditional markets raises concerns in the event of a potential sell-off. Ultimately, Bitcoin’s ever-changing narratives show strengthening fundamentals despite its potential as a safe haven being put under scrutiny.
To learn more about BTC analytics, go to Deribit Market Data or visit IntoTheBlock’s, which tracks crypto-native indicators along with the most pertinent order book, derivatives, and social metrics.
AUTHOR(S)
We are a data science company applying cutting-edge research in AI to deliver actionable intelligence for the crypto market.