Article by Sacha Ghebali, Kaiko
Throughout 2020, many narratives emerged surrounding the relationship between cryptocurrencies and major asset classes. This article presents an overview of market correlations and volatilities from the beginning of the year for major cryptocurrencies (BTC and ETH) and traditional asset classes (equities, FX, and precious metals) with the aim of better understanding market movements and risk management.
In finance, risk is often defined by a measure of volatility, which gives an indication of the general magnitude of price movements over time. The more risk, the more volatile and the higher the odds that you will win/lose larger amounts of money. In the realm of modern finance, investors should be compensated for risks that cannot be diversified: the more risk they take on, the greater the returns they should expect. However, in times of crises, this relationship tends to reverse and investors can be faced with large risks yet lackluster returns.
Aside from the volatility of a single asset itself, another cornerstone of the risk puzzle (core to asset allocation) is how assets move with respect to each other, or in other words how they correlate. Without getting into random matrices and other arcane mathematical concepts, the estimation of those correlations do present challenges that are made even more acute in these highly non stationary times.
Thus, estimating the volatility and correlation between cryptocurrencies and other asset classes has often led to confusion and contrasting interpretations. Multiple methodologies exist, all have merits and limitations but interpretations remain difficult. As Noelle Acheson, Head of Research at CoinDesk, accurately described in September(1):
What do you know, it looks like BTC’s correlation with TSLA is increasing! BTC is now more correlated to TSLA than to the S&P 500. That must mean that bitcoin is now being seen as a tech stock. No wait, it’s being seen as a proxy for market hype. No wait, I mean it’s being seen as a moon shot. […] short-term correlations can tell a good story, but they’re not that meaningful.
This article presents calculations based on what is called an exponential moving average in order to paint a more robust picture of what happened in 2020 when it comes to volatility and correlations. The main advantage of this method is that it places more weight on recent events than on older ones, thus preventing irregularities from the distant past to have a disproportionate impact on the current value. The results shown in this article use the methodology of RiskMetrics Group with a decay factor of 0.94.(2)
The asset classes represented in this analysis are a) crypto assets BTC and ETH, b) equities (S&P 500), c) FX markets, and d) precious metals (gold).
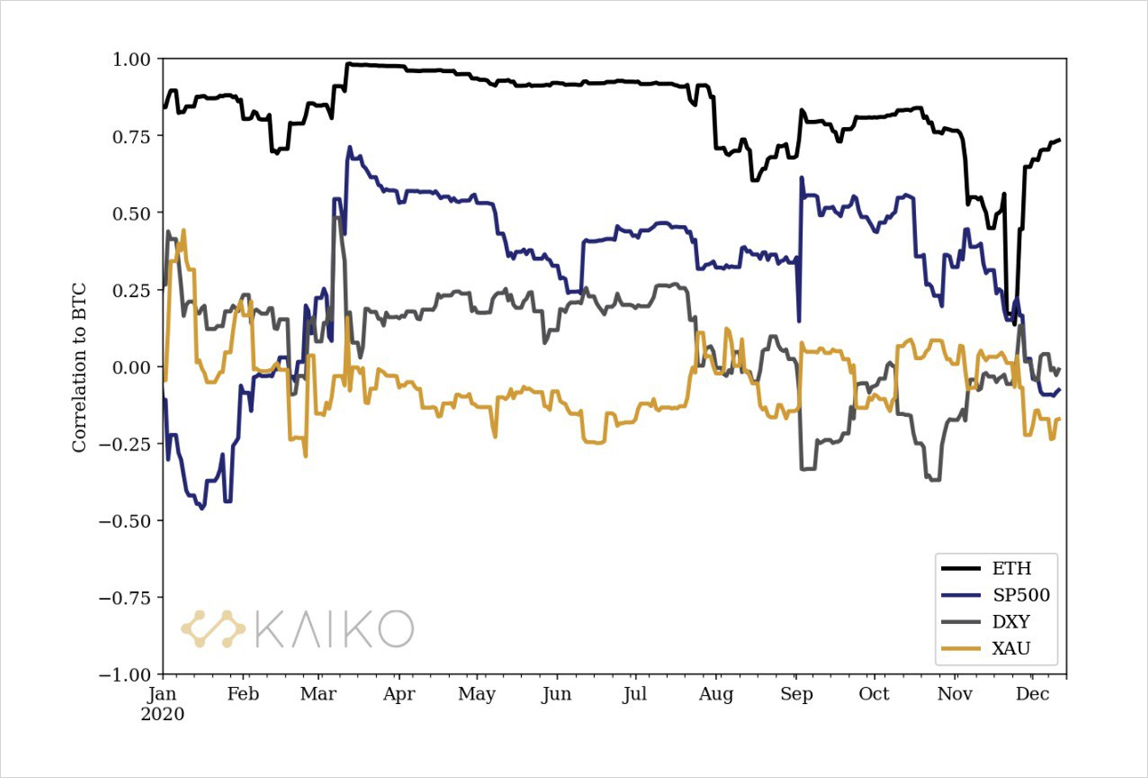
Without further suspense, let’s look at how the correlations between those assets have evolved since January 2020. Figure 1 shows the correlation of ETH, the S&P 500, DXY, and gold prices (XAU) relative to Bitcoin. A correlation of 1 means that the asset moves perfectly in sync with the price of BTC whilst a correlation of -1 means the opposite. Note that the famous narrative of “safe-haven” for BTC would imply low or negative correlation with the market which has not always been the case historically.

Figure 1: Correlations between BTC and other assets
On March 12th, in the wake of the market crash that propagated as a consequence of the COVID-19 pandemic, a sudden jump in correlations occurred. Whilst it reversed for the DXY (U.S. Dollar Index) shortly after, large correlations between the S&P 500 and BTC subsisted for an extended period. Only recently has the correlation began to wane as BTC is taking a rapid ascent to unprecedented prices as more and more investors are announcing large allocations to the digital asset.
Historically, ETH has been highly correlated with BTC this year especially over the months of March to August. Starting from the summer, the correlation between the two assets have fluctuated very likely as a response to the DeFi boom and the intense activity and uncertainty associated with the transition to Ethereum 2.0. In the weeks before the launch of the Beacon Chain on December 1st, the correlation between ETH and BTC reached its lowest point at 0.14 on November 24th.
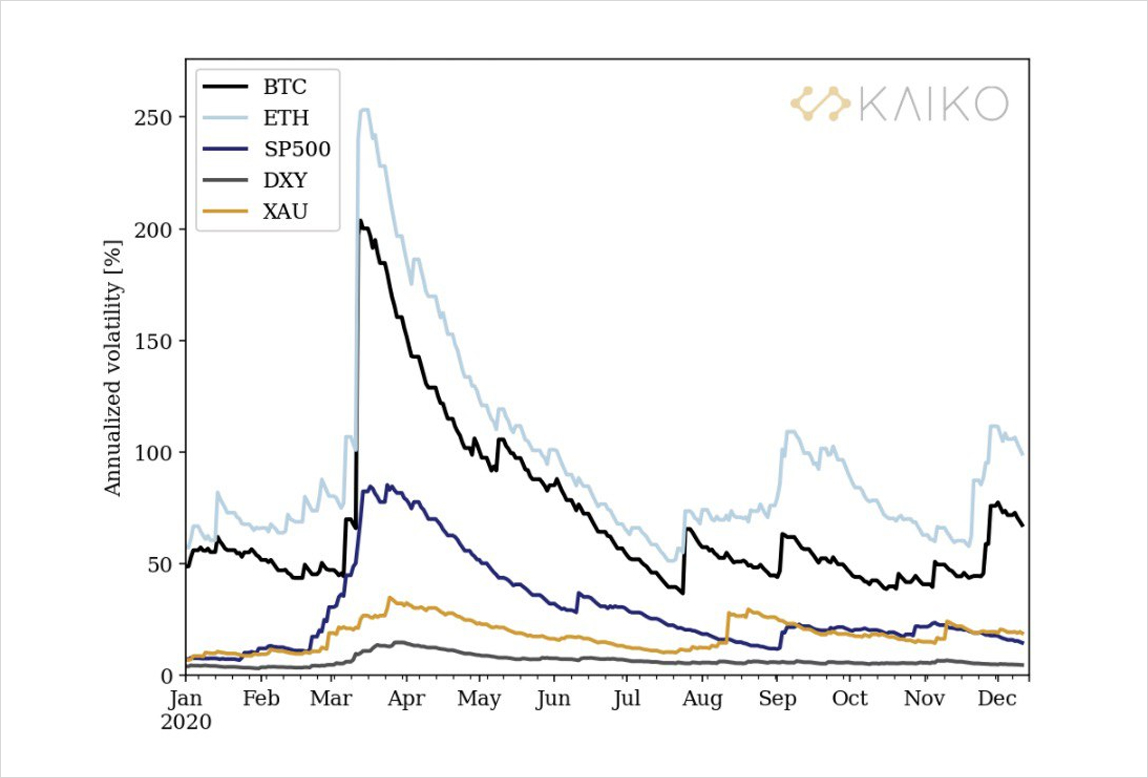
Next, the historical volatility of the same assets are compared on Figure 2. It shows that although the volatility has come down since the market crash in March, the volatility of the S&P 500 remains above January and February levels.

Figure 2: Volatility of major crypto-assets (BTC/USD and ETH/USD exchange rates), market returns (S&P 500), U.S. Dollar Index (DXY), and gold (XAU).
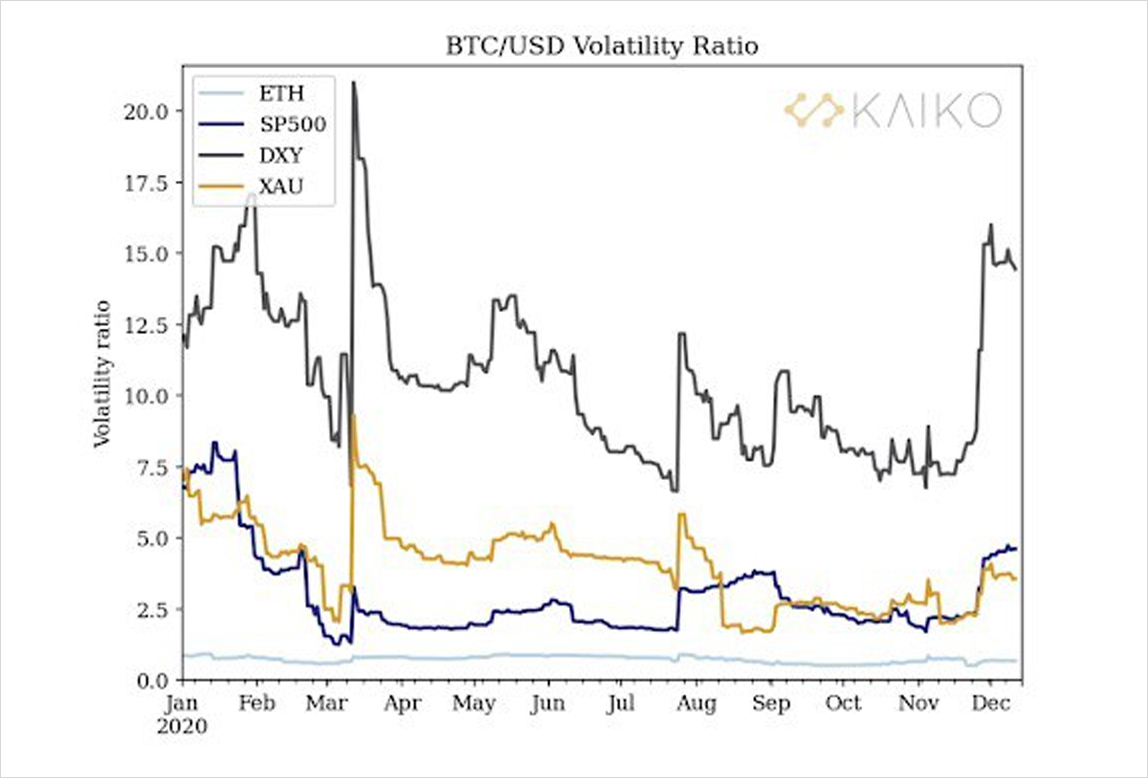
By way of comparison of the volatility to that of BTC, Figure 3 shows the ratio of the historical volatility of BTC relative to each asset. For example, a value of 2 for this ratio means that the volatility of BTC is twice that of the corresponding asset. As the uncertainty was crawling in before the March crash, bitcoin became less volatile relative to traditional asset classes, however the March 12th “Crypto Black Thursday” showed weaker resilience and was followed by a spike in volatility as a consequence of the liquidation spiral that drove bitcoin prices to abysmal levels.

Figure 3: Volatility ratio relative to Bitcoin. For example, a volatility ratio of 2 means that the volatility of Bitcoin is greater by a factor of 2.
Conclusion
The correlations between major asset classes and BTC followed distinct regimes over 2020. Notably, its correlation to equities markets (S&P 500) increased to relatively high levels for a sustained period of time while correlations to gold (XAU) have remained low throughout the year.
The ratio between the volatility of BTC and that of the S&P 500 was historically low this year with both being almost on par from beginning of March to mid-March. A new surge in the volatility of crypto markets started in November as a consequence of the current bull run.
From the March crash until the start of the DeFi summer explosion, BTC and ETH were highly correlated, this behavior however changed with a brief strong decoupling occurring as the first stages of the transition to Ethereum 2.0 were approaching. Following this relationship will be of interest especially as the volumes on ETH markets increase as more investments flow into the digital assets space and institutional derivatives product see the light of day (CME announced ETH futures for February 2021(3)).
Closing 2020 on an immensely bullish outlook for Bitcoin and crypto finance, the correlations between major crypto currencies and equities markets have entered low-to-negative territory as more and more institutional capital is entering into the space as a means of diversification and hedge against economic uncertainty.
(1) “Bitcoin Correlations” by Coindesk
(2) RiskMetrics Group (2007), “The RiskMetrics 2006 methodology”
(3) CME Group link
AUTHOR(S)
