

In early December last year, we evaluated a budding bitcoin derivatives market by inspecting some of its key metrics.
We found that the relationship between BTC’s implied volatility and realised volatility was consistent with the analogous relationship observed in derivatives markets on traditional assets, but was often slow to react to sharp changes in realised volatility, resulting in prolonged mismatches in vol levels. We also evaluated the put-call skew as an signal of market sentiment, finding it to be a sensitive indicator of negative sentiment as BTC experienced a turbulent decline in price.
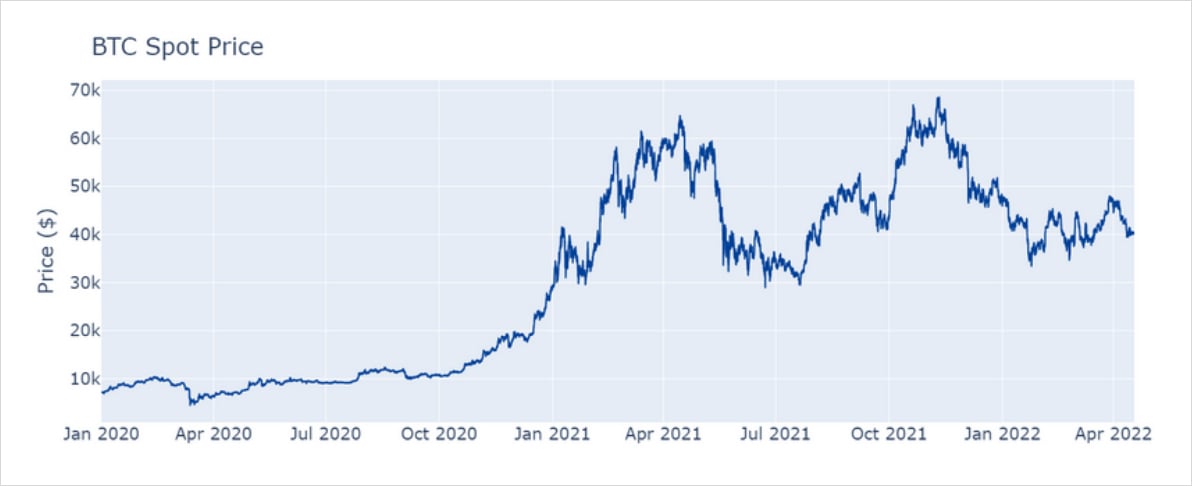
Figure 1.1 BTCUSD spot price since January 2021. Source: BlockScholes
Now, four months later, we will look to see how the market has developed by exploring the current state of these same metrics. The evolution of the volatility smile offers a broad picture of how we have arrived at the current market climate and we will use this tool in an attempt to contextualise the period of consistently low realised volatility that has seen BTC remain within a [$38K, $48K] range for much of 2022.
Volatility
When we evaluated it last at the beginning of December, implied volatility was trending lower on the back of the comedown from an exciting Autumn bullrun, despite some sharp drops in spot price that caused significant jumps in realised volatility.
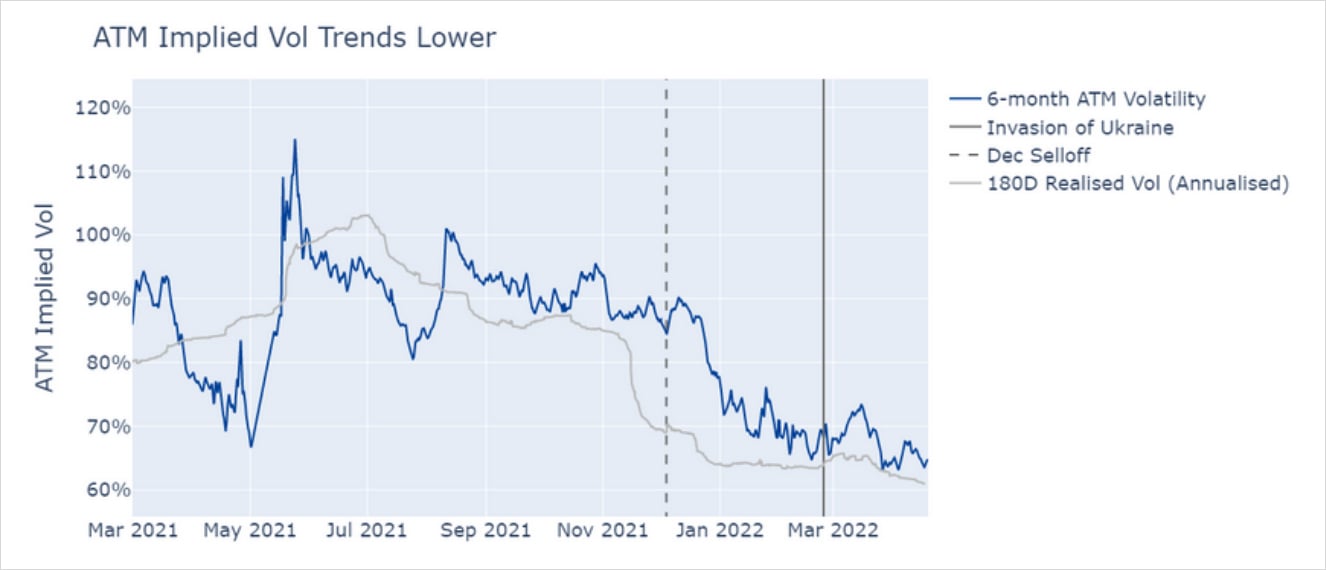
Figure 2.1 At-the-money implied volatility of 6-month tenor BTC option (blue) and 180D realised volatility (grey). Source: BlockScholes
In the four months since, it has trended even lower still. As spot price has remained steadily range-bound since the beginning of 2022, implied vol has oscillated close to year-long lows of 70%. However, throughout this period implied vol has been slow to follow periods of low realised vol. As the latter continues a downwards trend that began at the end of March, implied vol may be about to drop even further to account for the recent period of relative calmness in the spot market.
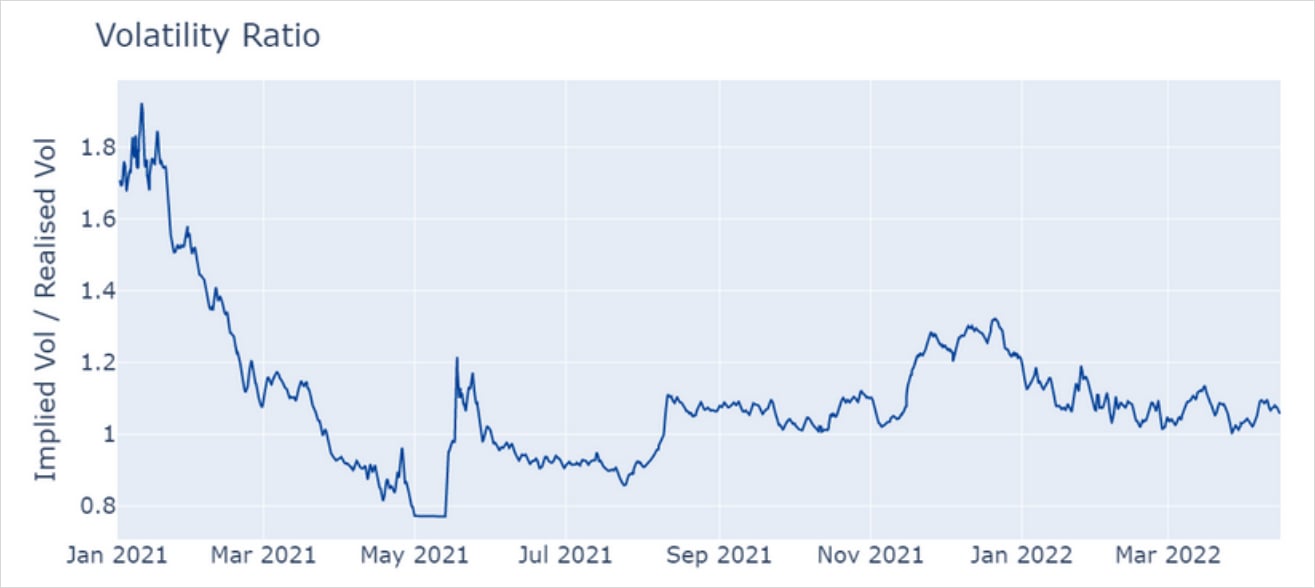
Figure 2.2 Implied volatility divided by realised volatility. Source BlockScholes
In December, we also noted that a sharp jump in realised vol, resulting from a spot selloff on the 5th, did not inspire a prolonged response from implied vol, despite the latter remaining elevated. This mismatch between spot market volatility and implied vols continued towards the end of 2021, where a sudden reduction in implied vol eventually returned the volatility ratio (a measure of at-the-money implied vol as a multiple of realised vol) to near 1. This discrepancy has now all but disappeared as implied volatility has fallen further still to meet the consistently low levels of realised vol. Whilst implied vol remains reactive to spot market swings (as seen in the jump in both at the beginning of March) its movements are driven by a multitude of factors and cannot be explained by realised volatility alone.
It is possible that its prominent role in the war in Ukraine played some part in BTC’s relatively higher volatility during March, and that its recent cooling is simply a return to its regular, pre-war levels. Certainly, spot price traded near the upper bound of its current range (at $45K) after the announcement of the first sanctions on Russian individuals. However, whilst it did coincide with a noticeable pickup in implied vol, this volatility is dwarfed by that seen 6 to 8 months ago. These events did not inspire a return to the levels of volatility that we have come to expect from this asset.
Put to Call ratio
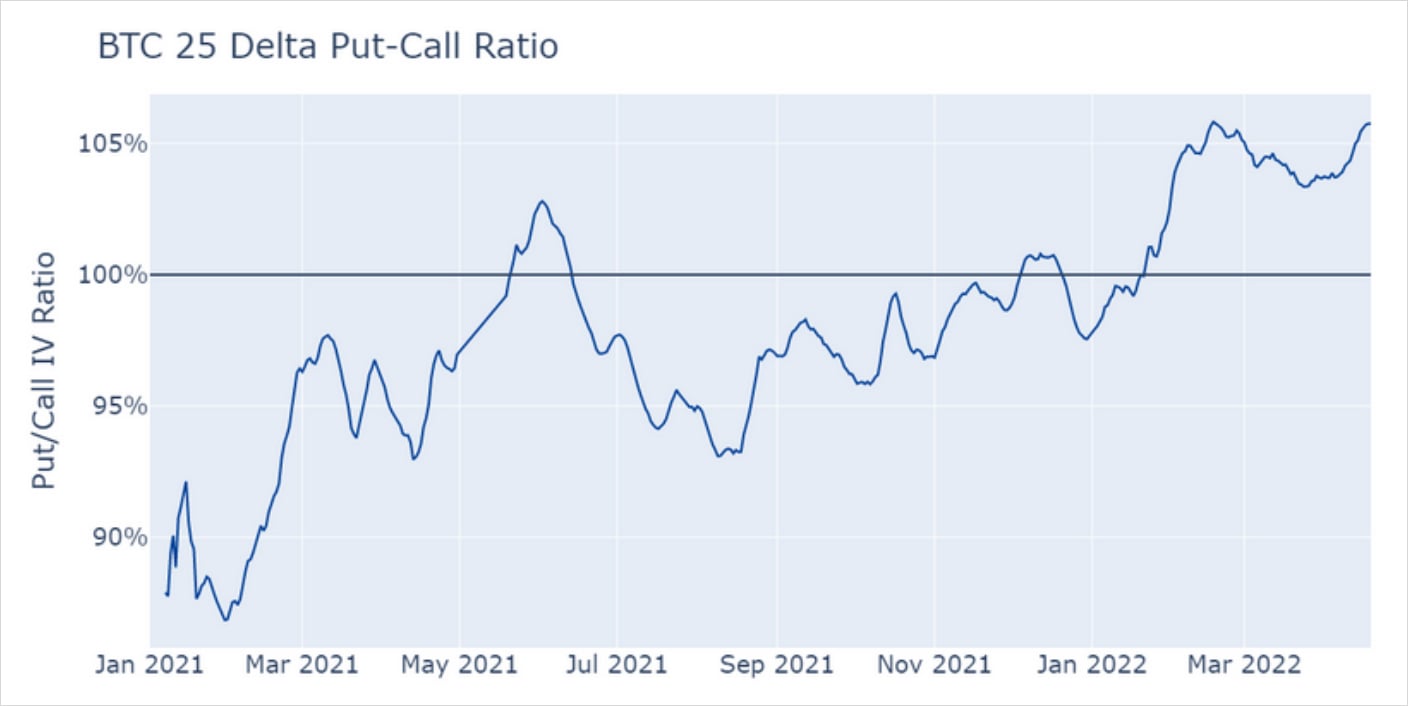
Figure 3.1 Implied volatility of 25 delta puts divided by the implied volatility of 25 delta calls, both with a tenor of 6 months Source: BlockScholes
The put-call ratio is a measure of the demand for puts relative to calls at strikes at similar deltas on either side of the at-the-money. Recall that it is calculated as the implied volatility of a 25D put option divided by the implied volatility of a 25D call option. Therefore a ratio above 100% implies higher demand for puts, and a ratio below 100% implies higher demand for calls.
In December, this measure peaked tentatively above 100% for the first time since the capitulation of mining activity last summer, following the sharp spot selloff on the 4th and 5th Dec. The sensitivity of the PC ratio to this selloff was in contrast to that of implied vol, which did not increase significantly above its local bounds. This appears to signal a refocusing of volatility to the downside, rather than the symmetric oscillations seen at the top of the run to an all-time high.
Today the ratio remains firmly above 100%, with puts trading at more than a 5% premium to calls with strikes at a similar distance away from the ATM. This is understandable given the current drawdown from November’s ATH but, considering the current flatness of the yield curve and very low realised volatility, seems to be assigning incredible richness to out-the-money puts whilst at-themoney implied vol continues to plunge.
Realised vol’s drift lower could be explained by large players in the market looking to sell a relatively rich implied volatility – going short BTC options. This would leave dealers long the option/gamma (which is the sensitivity of their positions delta to changes in the underlying price). To hedge this, traders must continuously rebalance a portfolio consisting of both the underlying and their put/call options by buying spot when BTC drops in price and selling when BTC increases in price and so applying a mean-reverting pressure.
This may be the case given the influx of sophisticated trading shops to the market and the cooling retail interest due to lack of price activity, and would certainly explain the stagnant price action that we are seeing in the spot market. In regular market conditions, speculative spot trading volumes are large enough to outweigh the derivatives dealers activities, but this has reportedly fallen to all time lows.
This may explain why calls have cheapened, but something seems to be supporting the puts, resulting in the ratio reaching all-time highs (as shown by Figure 3.2). This still leaves an open question as to what exactly is providing that support.
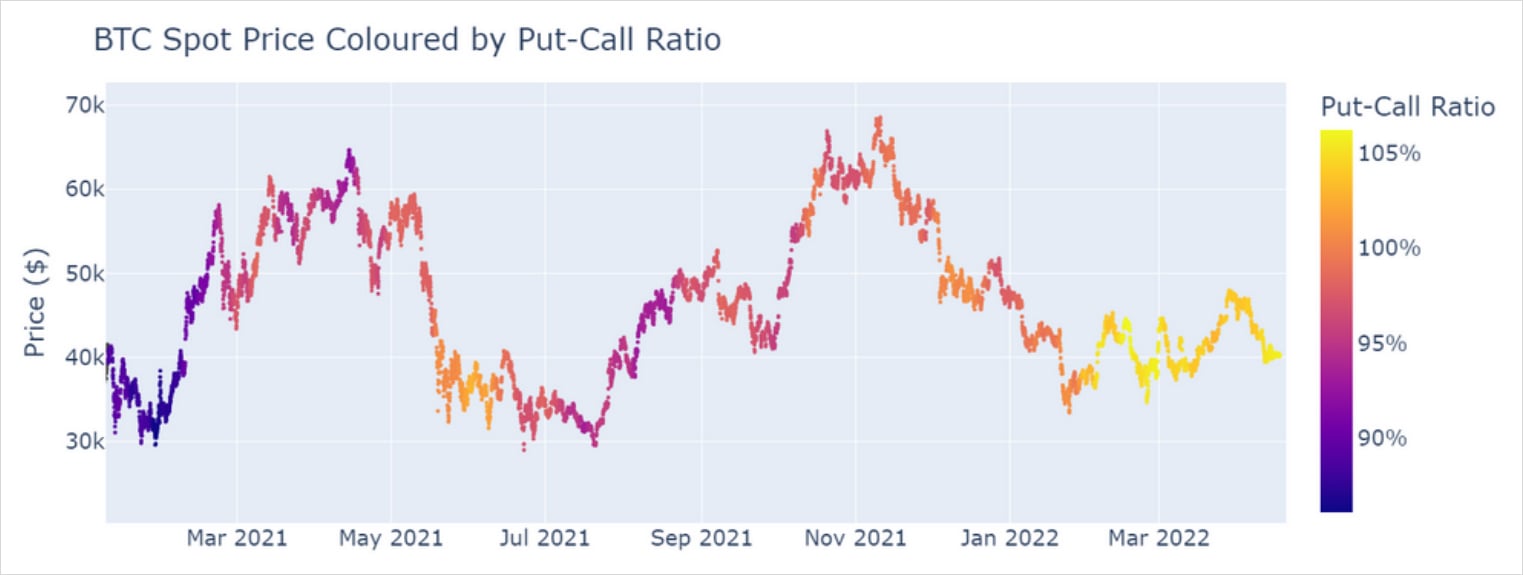
Figure 3.2 BTCUSD spot price coloured by concurrent at-the-money implied volatility of 6-month tenor options. Source: BlockScholes
This relative richness in puts is happening as implied vol drifts to its all-time lows. The drop in implied volatility suggests that the market is becoming more confident that the BTC price will remain somewhat stable, whilst at the same time growing much more nervous about a potential major sell-off. Figure 3.3 illustrates this odd negative correlation between the put-call skew and implied volatility – as the richness in puts grows more steep, implied volatility drops. Even taking this relationship into account, the most recent data point (lime green) highlights the extreme richness of out-the-money puts given the current levels of implied vol.
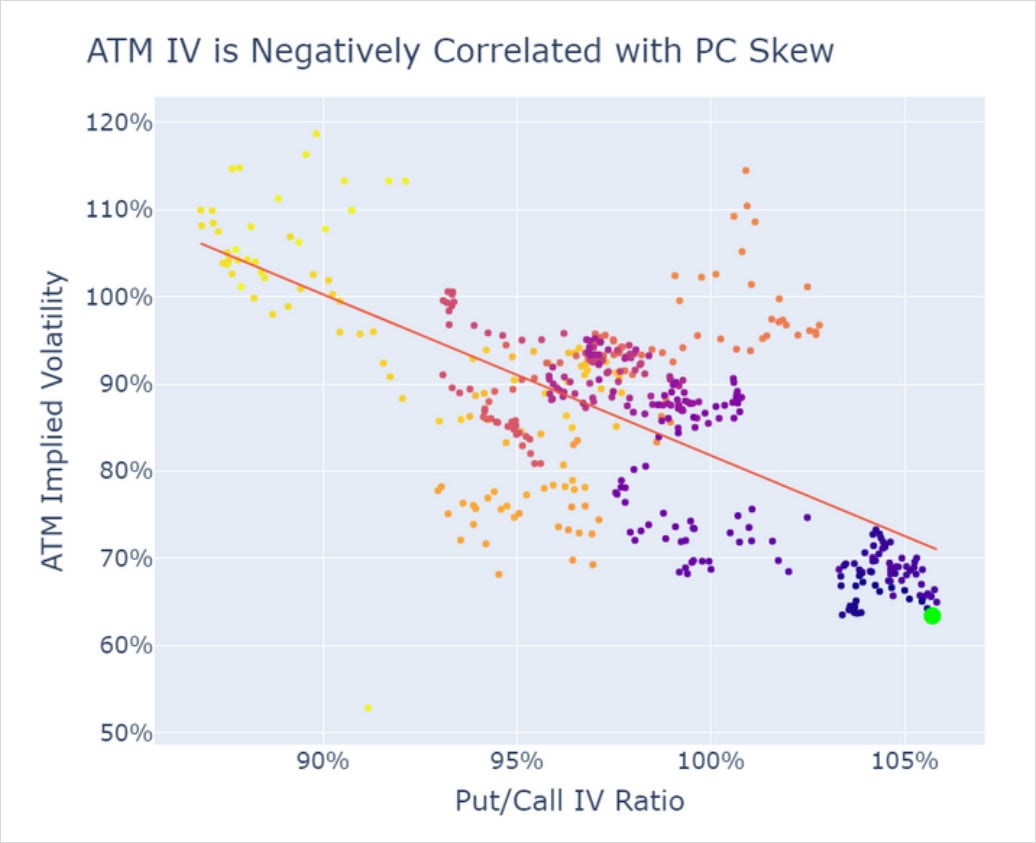
Figure 3.3 Daily ATM implied vol of 6-month tenor options regressed against put-call ratio. Darker colours inidicate more recent data points. Source: BlockScholes
Volatility smile
The harsh skew towards puts can also be observed in the monthly evolution of the volatility smile since September last year.
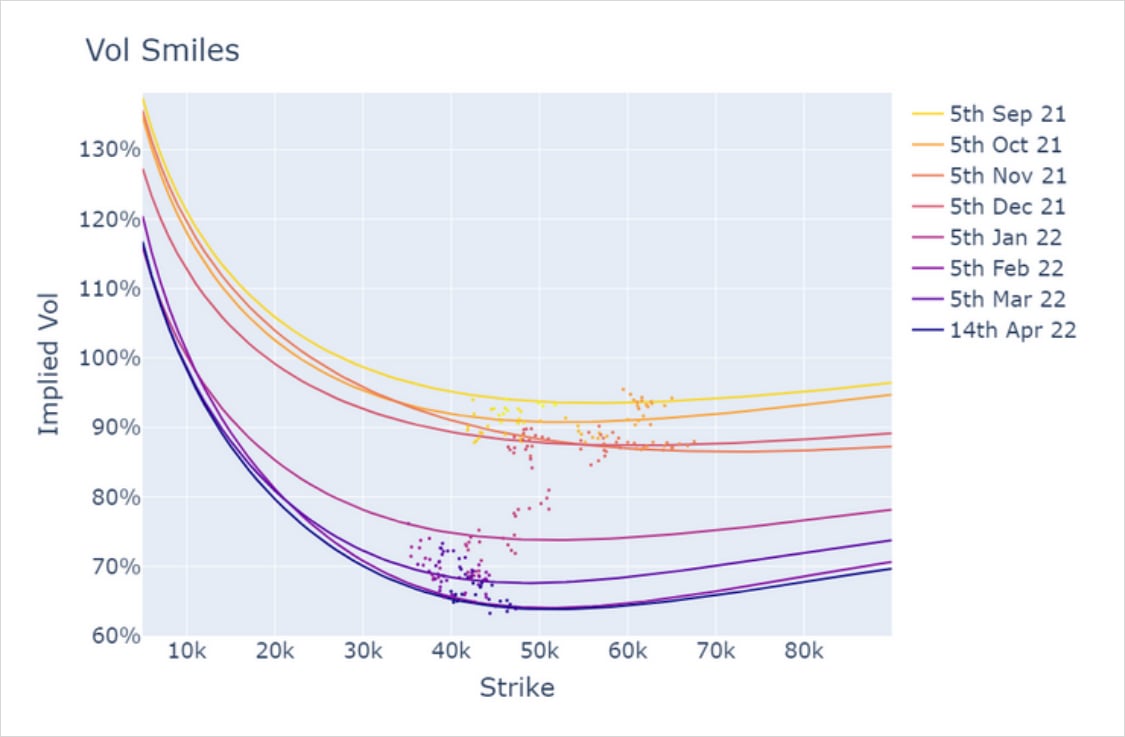
Figure 4.1 Monthly volatility smiles against a scatter plot of the at-themoney implied volatility (y axis) at different BTCUSD spot prices (x axis). Darker colours indicate more recent data points. Source: BlockScholes
The volatility smile has dropped lower across all strikes, with the implied vols of at-the-money and out-the-money calls dropping further than out-the-money puts. It is this behaviour that has caused the smile to smirk further towards lower strikes, rather than an increase in the implied volatility of deep out-the-money puts. The vol smile is also now pricing implied vols lower than it was on previous occasions at similar spot prices. This reflects the fact that we have arrived at today’s spot price gradually, have remained there consistently, and are not simply passing this strike on a parabolic trajectory to a higher or lower price level.
It is possible that the steepness of the smile (at least the high premium assigned to out-the-money puts) may be exaggerated by low trade volumes, especially for strikes lower than $20K. The put-call open interest ratio is currently at 0.53, meaning that there is nearly twice as much value held in open call contracts as there are in puts.
Conclusion
Implied volatility has drifted to its lowest levels since last June which is consistent with the drop in delivered vol that has seen BTC trade within a stable range. However, this is at odds with the reshaping of the volatility smile which is assigning unusual richness to deep outthe-money puts.
This represents an unusual dislocation. Either the market is correct and BTC price will remain stable (in which case the price of these low strike puts is way too expensive), or it is anticipating a large drop in price, in which case the outright level of implied vol (a proxy for uncertainty) is way too low.
AUTHOR(S)
Trading with a competitive edge. Providing robust quantitative modelling and pricing engines across crypto derivatives and risk metrics.