

Bitcoin volatility report brought to you by our partner BlockScholes.
- In a report on BTC’s volatility metrics at the beginning of May, we highlighted an increasing demand for downside protection and a cooling ATM implied volatility.
- Since then, UST’s depegging event and a liquidity crisis have exacerbated BTC’s poor performance compared to equities in an already uncertain macroeconomic environment.
- Both events spiked ATM volatility and have encouraged the huge demand for OTM puts.
- We will look at levels across the volatility surface implied by the options traded on Deribit’s exchange in order to gain insight into option traders’ beliefs about BTC’s price action in the next few months.
The Volatility Surface
It is helpful to begin by evaluating the entire implied volatility surface. This charts the implied volatility of options both across the delta domain (with calls at the top, and puts at the bottom) and from short-dated options (left) to longer-dated options (right). Plotting this chart shows the full picture of the volatility implied by Deribit-traded options at a single snapshot in time.
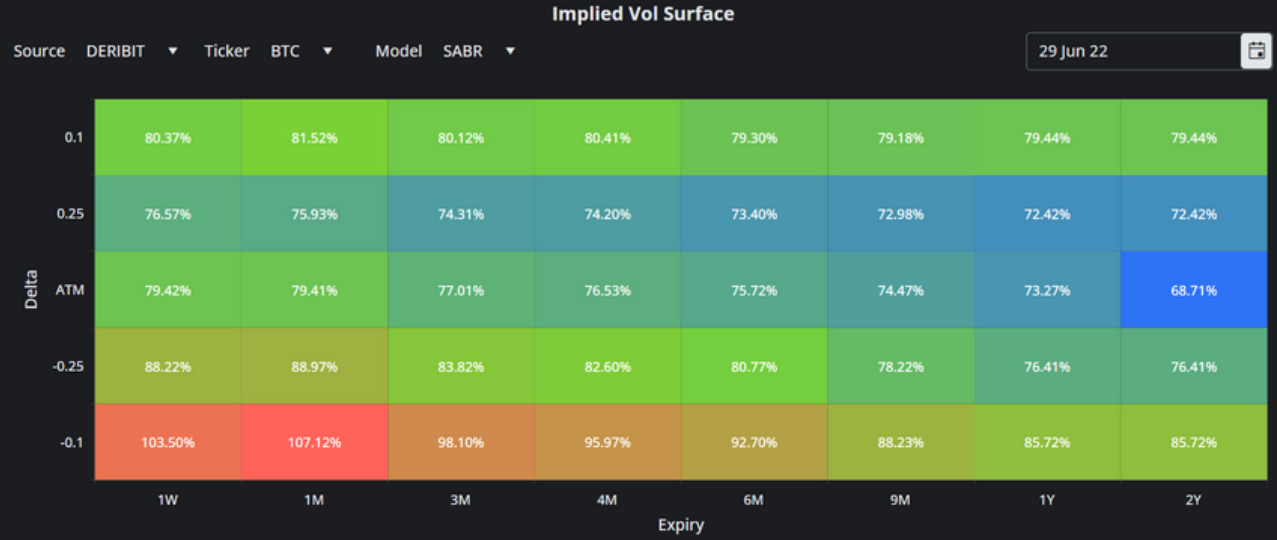
Figure 1 Implied volatility surface snapshot on the 29th June 2022. This shows the implied volatility for options across the tenor (x-axis) and delta (y-axis) domains. Source: BlockScholes
Put-Call skew is higher at longer tenors
The snapshot of the volatility surface on the 29th of June shows that the market is still assigning incredible richness to puts. This is particularly true of short-dated tenors, with the implied volatility of 25-delta put options above 85% at a tenor of one week. The implied vol of puts at that distance from the ATM remains high even for long-dated tenors, implying that the market expects to value downside protection highly for months to come. This plot also shows that the richness in puts is contrasted by a low and flat implied volatility for calls across the tenor domain, as 25-delta calls currently trade at around 72% implied volatility for all tenors up to 2 years.
With OTM put vols remaining high well into the far end of the term structure whilst OTM calls remain flat at 72% across the board, the smile is now skewing further towards puts at longer-dated tenors. That heavy skew is not new, and we have commented on the development of this trend since the beginning of this year. However, the market is now valuing puts at a premium for expiries well into next year.

Figure 2 Term Structure of the rho parameter of the SABR calibration for three dates since April 2022. Source: BlockScholes. Source: BlockScholes
The evolution of the market’s increasing preference for puts is evident from the development of the rho parameter’s term structure since April. Rho, the “R” parameter in the SABR calibration, measures the vol smile’s skew towards out-themoney calls or puts. Positive values indicate a higher relative value assigned to OTM call options, whilst negative values indicate a higher relative value assigned to puts. Figure 2 shows the term structure of this parameter at tenors up to 1Y, for three different snapshots since April 1st.
Whilst pessimistic about the future at all tenors in April (and indicating a preference for downside protection at all tenors), the LUNA crash in May saw the market reaffirm its conviction and skew the full surface further to the left, reflected in this chart by a drop in rho across the term structure.
Sideways price action since the implosion of several lending platforms and hedge funds at the beginning of June has seen rho higher than it was in the immediate aftermath, but still much more negative than April’s levels. The term structure on the 29th of June reflects that the market is pricing for the skew to increase significantly towards the end of the year (between 180D and 365D tenors), despite already trading near its all-time highest levels.
ATM volatility spikes
The increased demand for downside protection we observed throughout 2022 is now being supported by an increase in ATM implied volatility. We had previously commented on ATM vol’s drift lower since the collapse of the bull run in autumn 2021 that appeared to be at odds with the rising levels of the smile’s skew towards puts. Since the dramatic selloffs in spot that caused spikes in outright implied vol, first with the UST depeg event in May and then again with the Celsius crisis in June, ATM vols have since settled in a narrow band between 75% and 80%. This is significantly higher than the levels around 60% observed before the LUNA crash.
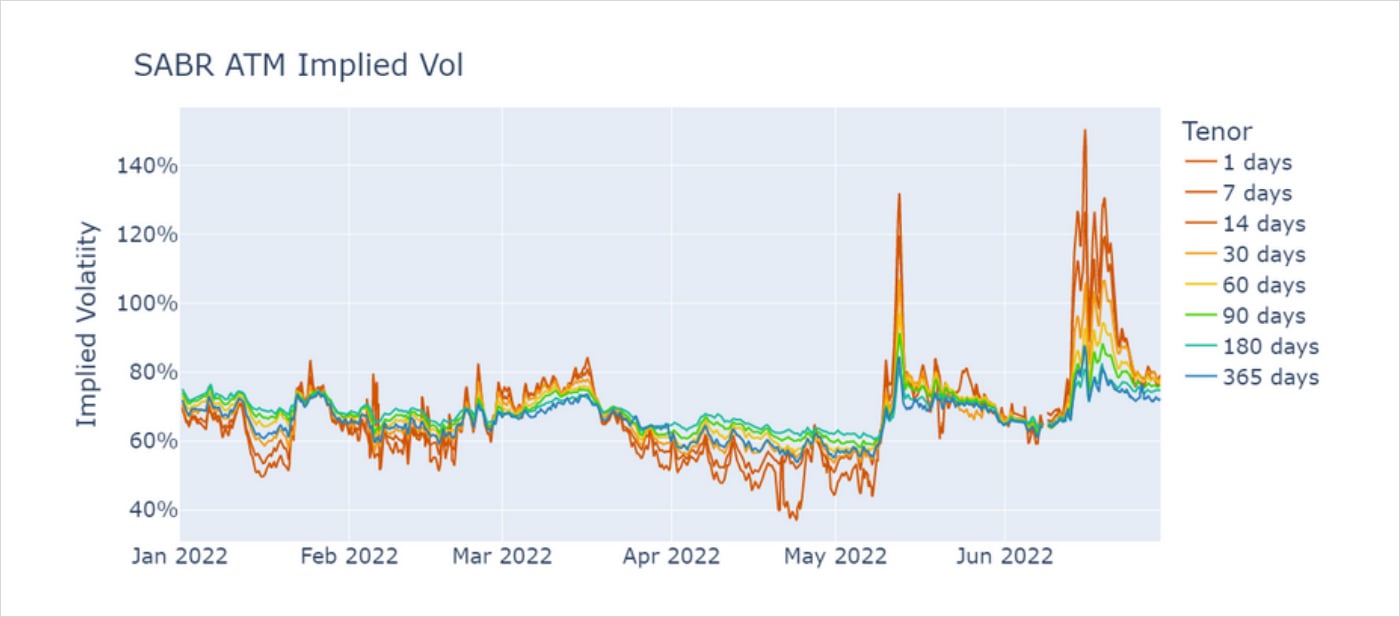
Figure 3 Hourly ATM implied volatility for volatility smiles at various tenors. The spikes in May and June correspond to the LUNA crash and Celsius credit crisis respectively. Source: BlockScholes
However, these spikes have not increased the ATM vol across all tenors equally. We now see an inversion in the term structure of ATM vols as near-term volatility is priced at a premium to longer-dated volatility. This was not the case in April, when the market was pricing short-term volatility below long-term volatility (both annualised). That indicates that the market now expects the high levels of realised volatility to fall in the mid- to long-term, despite the high probability it is assigning to another selloff in that time via its high pricing of puts.

Figure 4 Term structure of BTC’s ATM implied volatility at three snapshots since April 2022. Source: BlockScholes
That belief in the impermanence of realised volatility is somewhat justified by the speed at which short-term realised volatility has fallen from its spikes at the beginning of both May and June. Both months’ selloffs have caused dramatic price action in the short term before returning to the sideways amble that has come to define the periods of calm in this bear market.
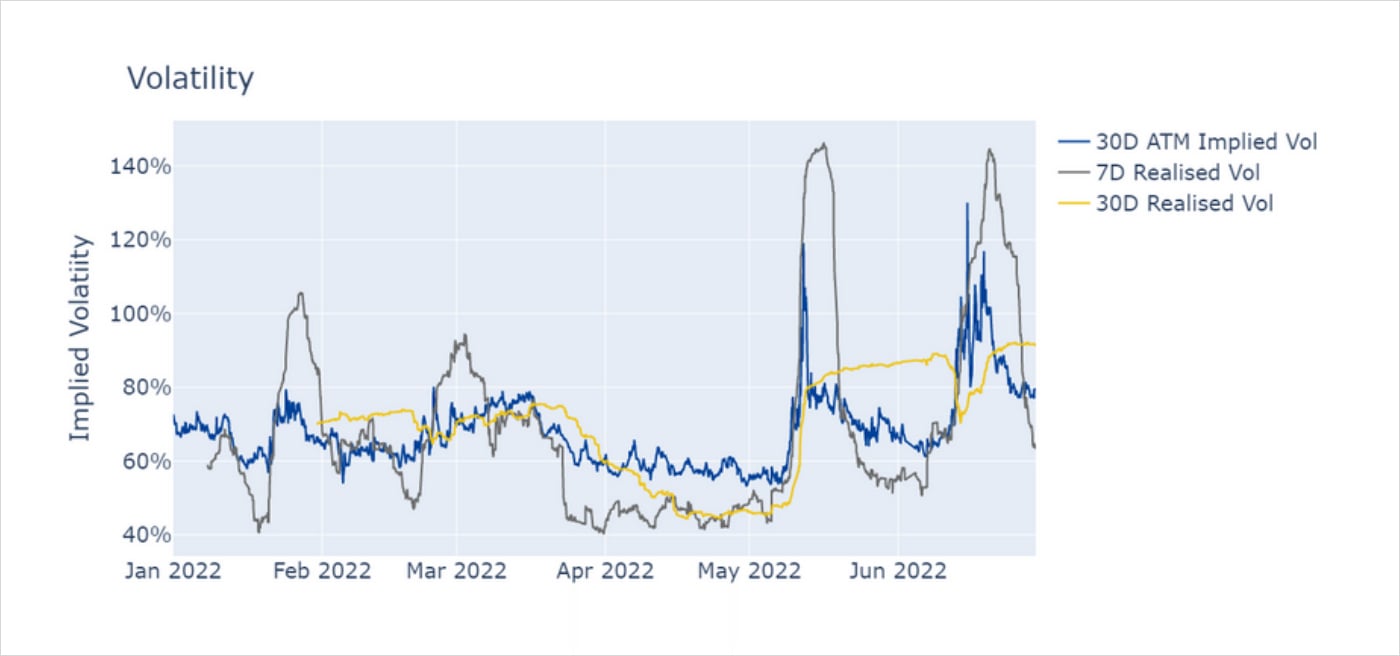
Figure 5 30D ATM Implied volatility (blue) compared to the 7D estimate of realised volatility (grey) and the 30D estimate of realised volatility (yellow). Source: BlockScholes
Figure 6 shows BTC spot’s realised volatility for rolling windows of different sizes alongside the ATM implied vol at a 30-day tenor. From this we can see that the spike in implied vol corresponds to short and sharp changes in spot price, rather than a sustained period of wild price action. The market appears to be struggling to assign a price to protection against extended periods of calm punctuated by swift legs down, a fact reflected by the increase in long-term volatility of volatility.
From the term structure of both metrics, we can see that the market expects the current high put call skew to increase into the future despite pricing ATM volatility highest in the short term. This contradiction is causing the steepness of the vol smile to increase, particularly for smiles at far-dated tenors as the market loses confidence that the current regime of sideways action followed by sharp selloffs will end soon.
We can see this most clearly in the alpha parameter (the “A” in SABR) of longerdated options, which corresponds to the steepness of the wings of the volatility smile and measures the implied volatility of implied volatility.
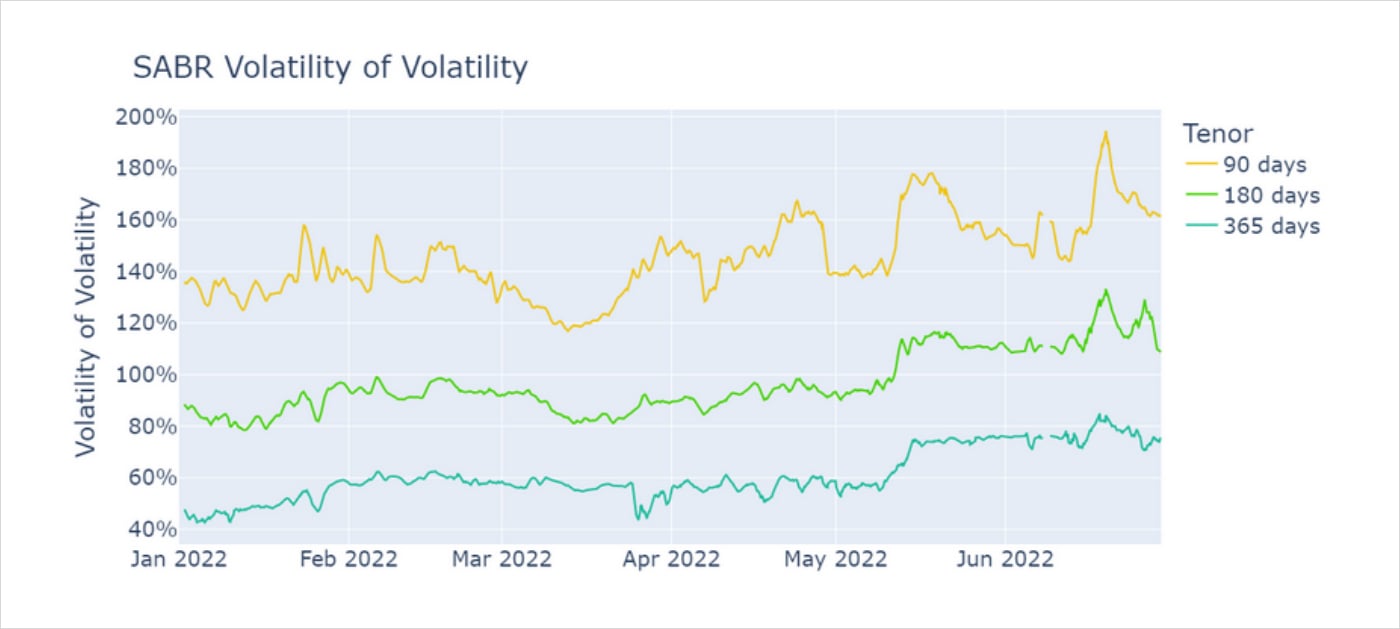
Figure 6 Time series of the SABR volatility of volatility parameter for three constant tenors at 90, 180, and 365 days. Source: BlockScholes
The vol of vol has remained consistently high for short tenors as short-term realised volatility whipsaws between periods of panicked selling and a range-bound spot price. However, that uncertainty has now begun to increase for longer tenors too as the market becomes more concerned about the increasing duration of the current regime. The consequences of this are that the steepness in the wings in the near term has extended into the wings of longer-dated tenors, a fact exacerbated by the inversion of the ATM vol term structure. The inversion in the term structure means that longer-dated ATM vol is now at the lowest across the entire volatility surface.
Conclusion
BTC’s derivatives market is now at its most pessimistic and uncertain in recent memory, as the premium demanded for protection against another downside price move is now near all-time highs. Short-term ATM volatility has spiked and remained above its pre-crash levels, moving more in line with the high PC skew that anticipated two severe spot selloffs. This move takes it above longer-term ATM vols and reflects the fear of a repeat of intermittent, short-lived selloffs seen in recent spot price action.
However, that inversion of ATM’s term structure also means that the ATM vol of long-dated tenors has increased at a slower rate, causing the steepness of the smile to extend to longer-dated options. This is an indication of the increased uncertainty about the behaviour of realised volatility in the months to come.
AUTHOR(S)
Trading with a competitive edge. Providing robust quantitative modelling and pricing engines across crypto derivatives and risk metrics.