
Weekly recap of the crypto derivatives markets by BlockScholes.
Key Insights:
This week’s swift spot market correction brought on the latest flush-out of leveraged long positions in both majors. Futures-implied yields have crashed closer to zero as futures prices collapsed towards spot prices. The consistently large and positive funding rate that we have enjoyed over the last month has (at least for now) moderated closer to zero. BTC’s volatility term structure has become strongly inverted as the 1-week tenor volatility has exploded to 75%. We do not see the same inversion in ETH’s term structure, which remains flat and at elevated levels to BTC’s volatility for tenors longer than 1 week.
Futures Implied Yield, 1-Month Tenor
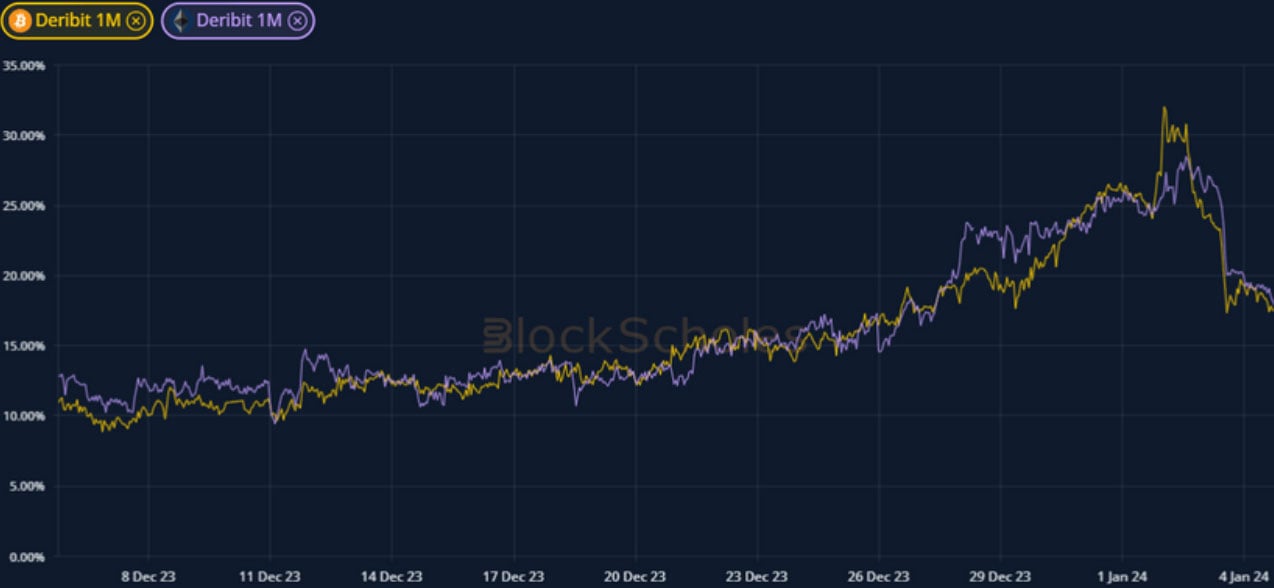
ATM Implied Volatility, 1-Month Tenor
*All data in tables recorded at a 10:00 UTC snapshot unless otherwise stated.
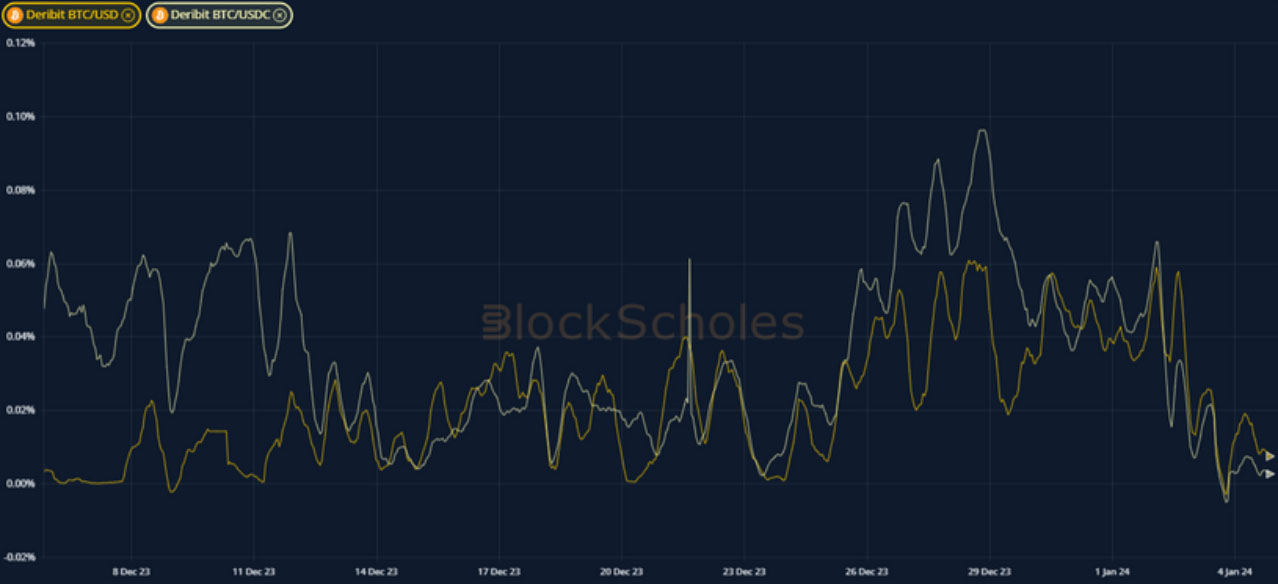
Futures
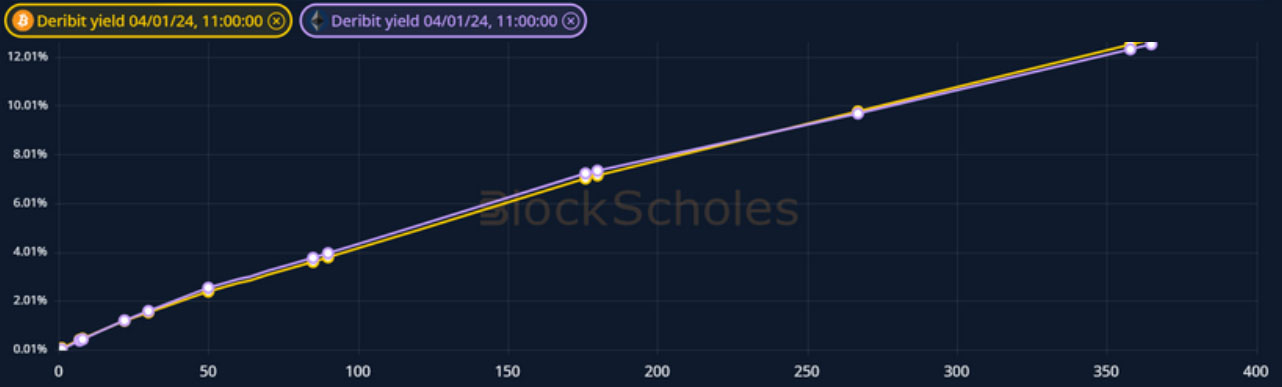
BTC ANNUALISED YIELDS – show the term structure of futures prices collapsing towards spot price as leveraged long positions were liquidated.
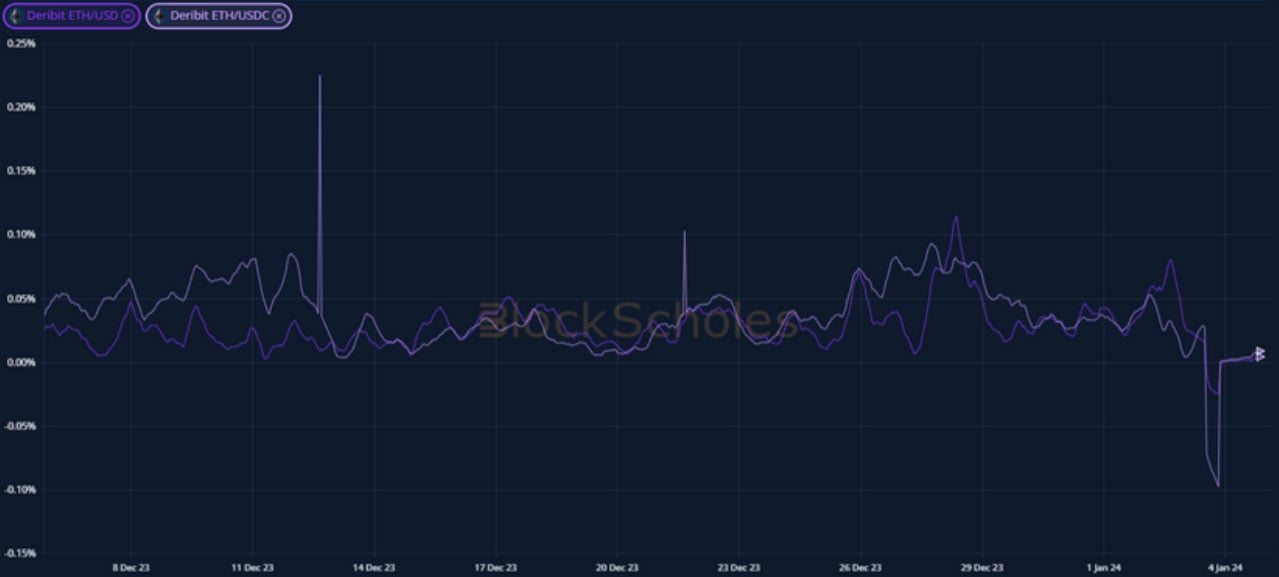
ETH ANNUALISED YIELDS – reports a similar flush out of leverage in futures markets as we see a significant correction in spot prices.
Perpetual Swap Funding Rate
BTC FUNDING RATE – reflects the flush out in leveraged long positions following the spot market selloff.
ETH FUNDING RATE – spiked negatively in the aftermath of the selloff, far below the positive levels sunk to by BTC’s funding rate.
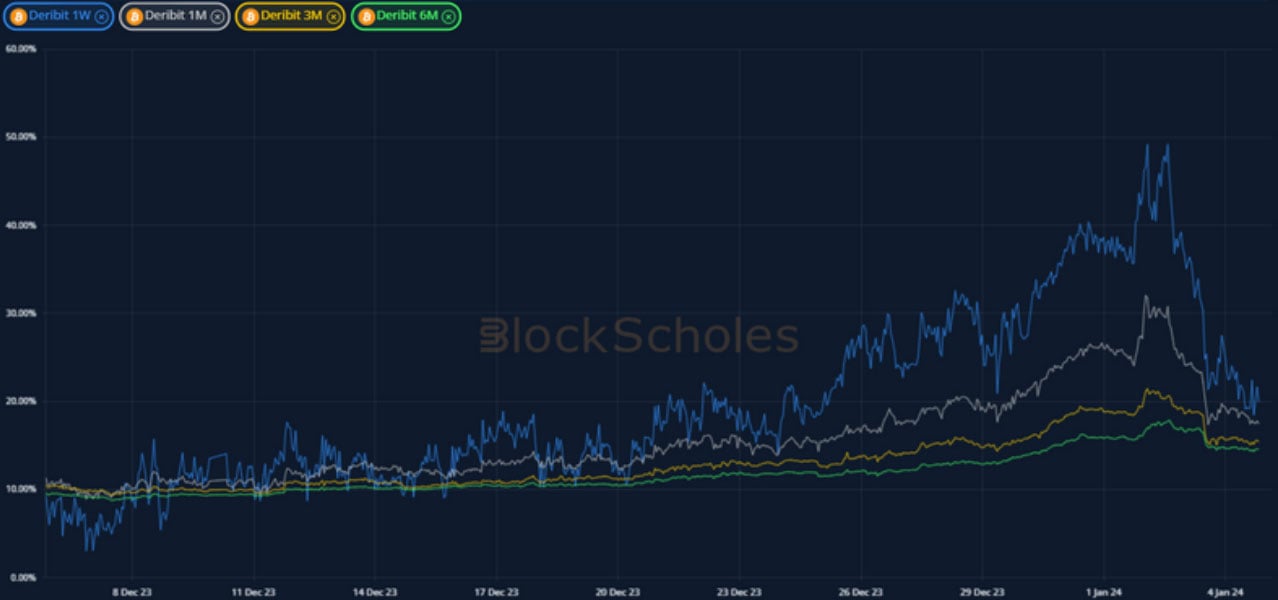
BTC Options
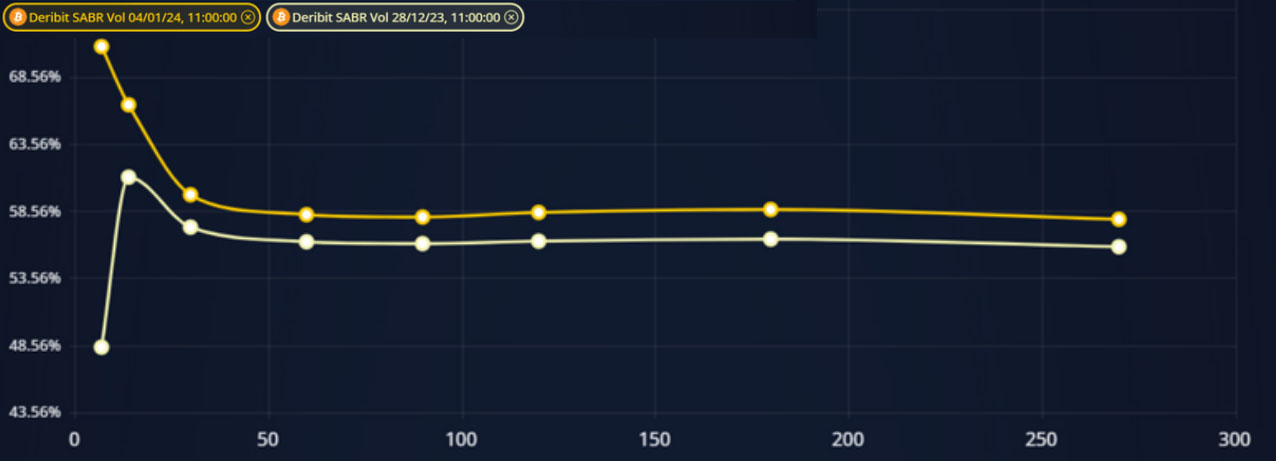
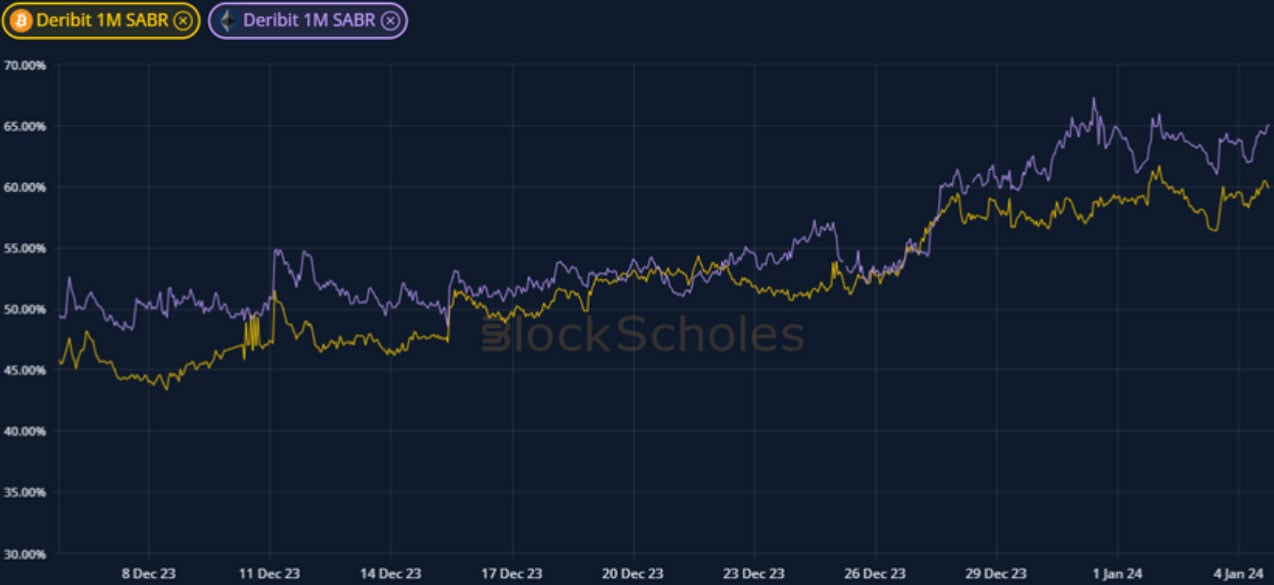
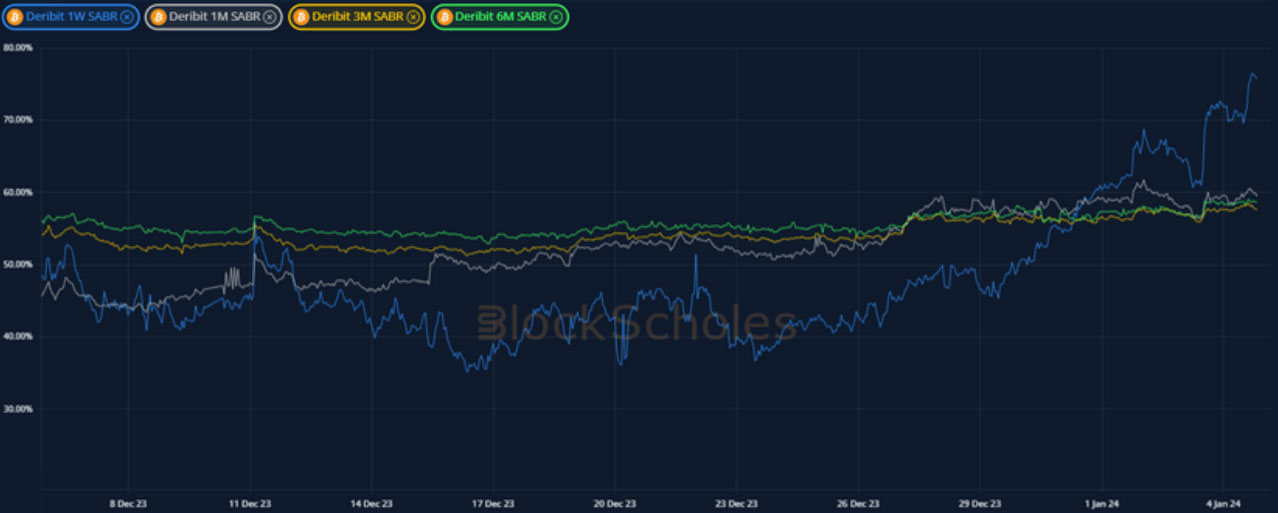
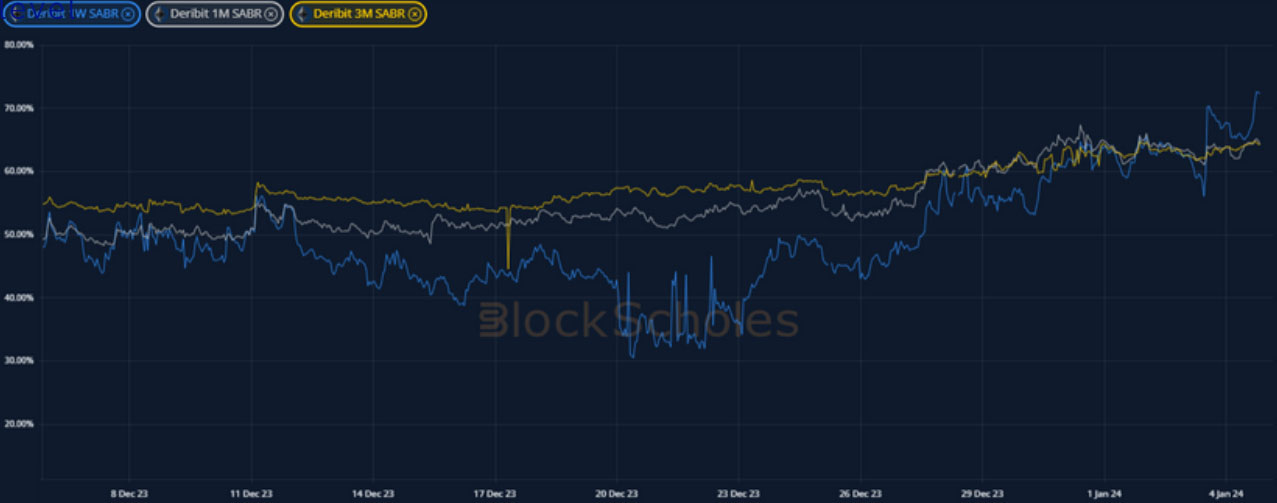
BTC SABR ATM IMPLIED VOLATILITY – has trended to 75% at a 1-week tenor ahead of the anticipated ETF announcement date in the next week.
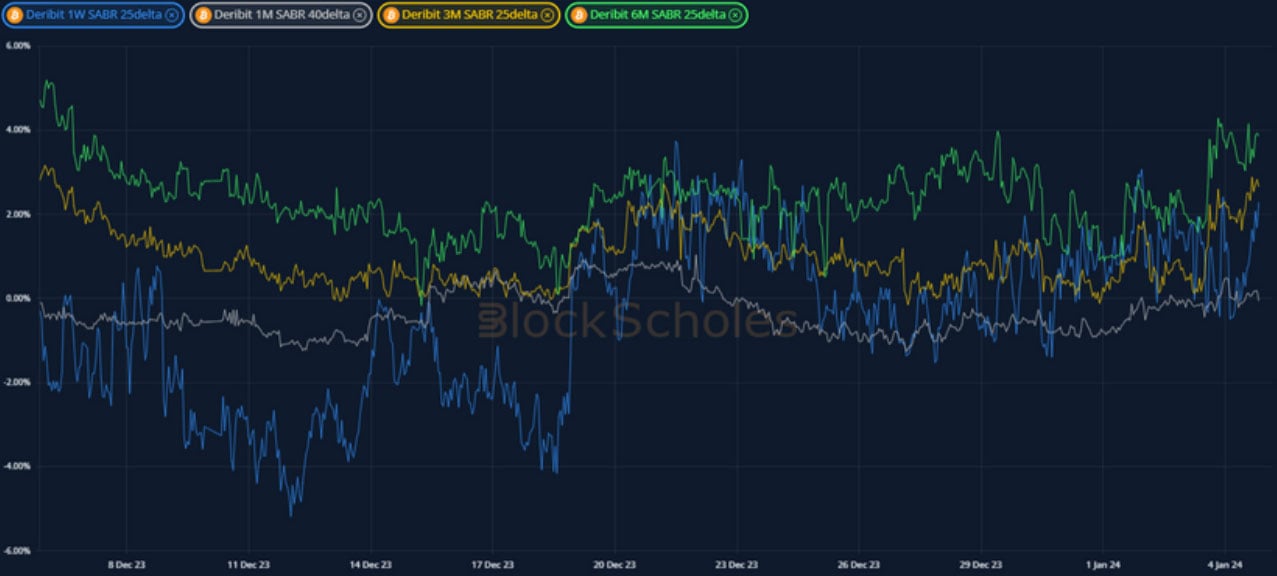
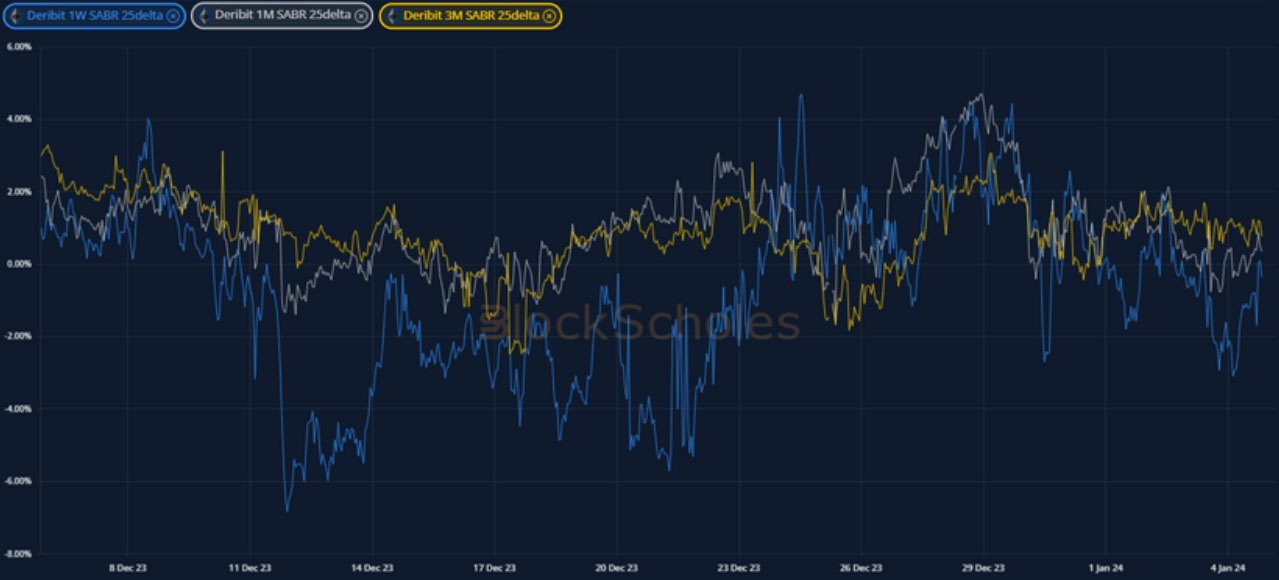
BTC 25-Delta Risk Reversal – despite the selloff in spot prices, vol smile skews remain slightly tilted towards calls across the term structure.
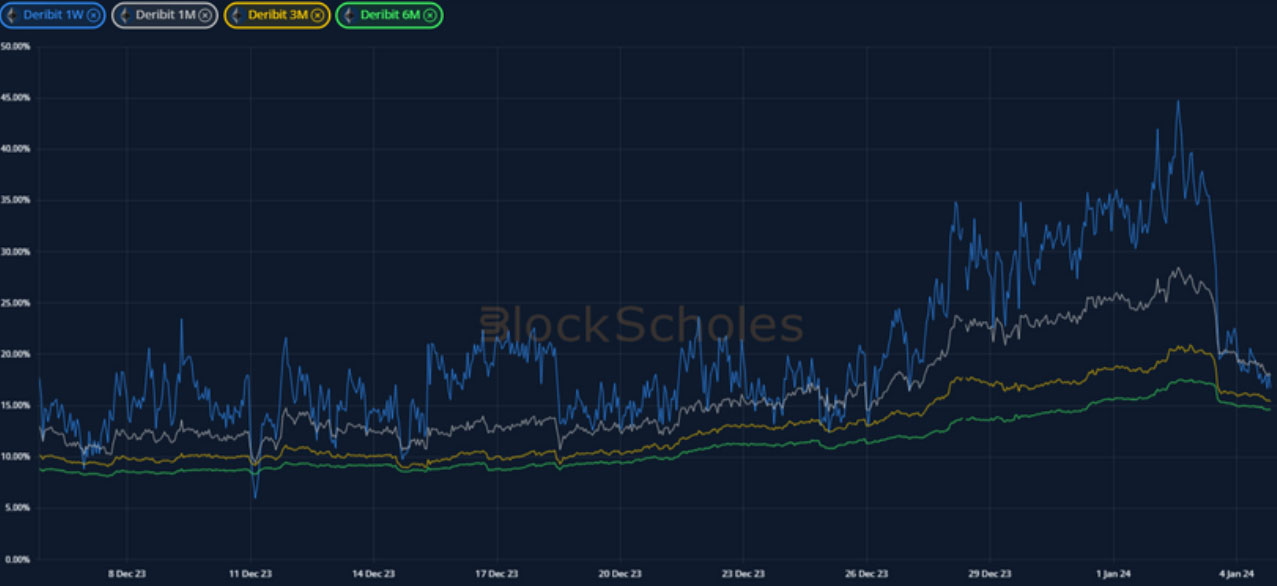
ETH Options
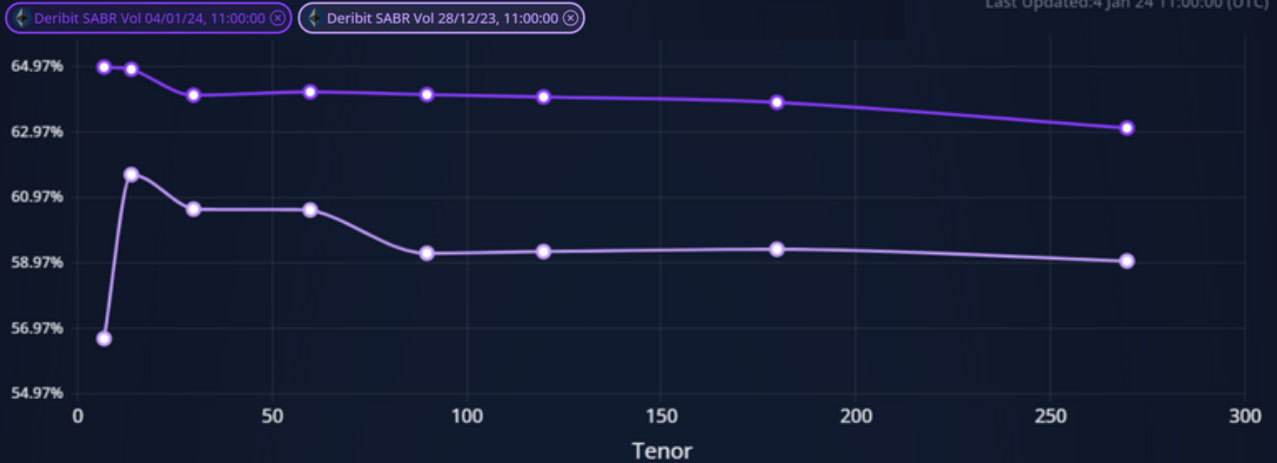
ETH SABR ATM IMPLIED VOLATILITY – does not show the same extreme inversion as BTC’s, as the 1-week tenor has not exploded to the same level.
ETH 25-Delta Risk Reversal – contrasts with that of BTC, reporting a noticeably more pessimistic skew towards OTM puts at short tenors.
Volatility Surface
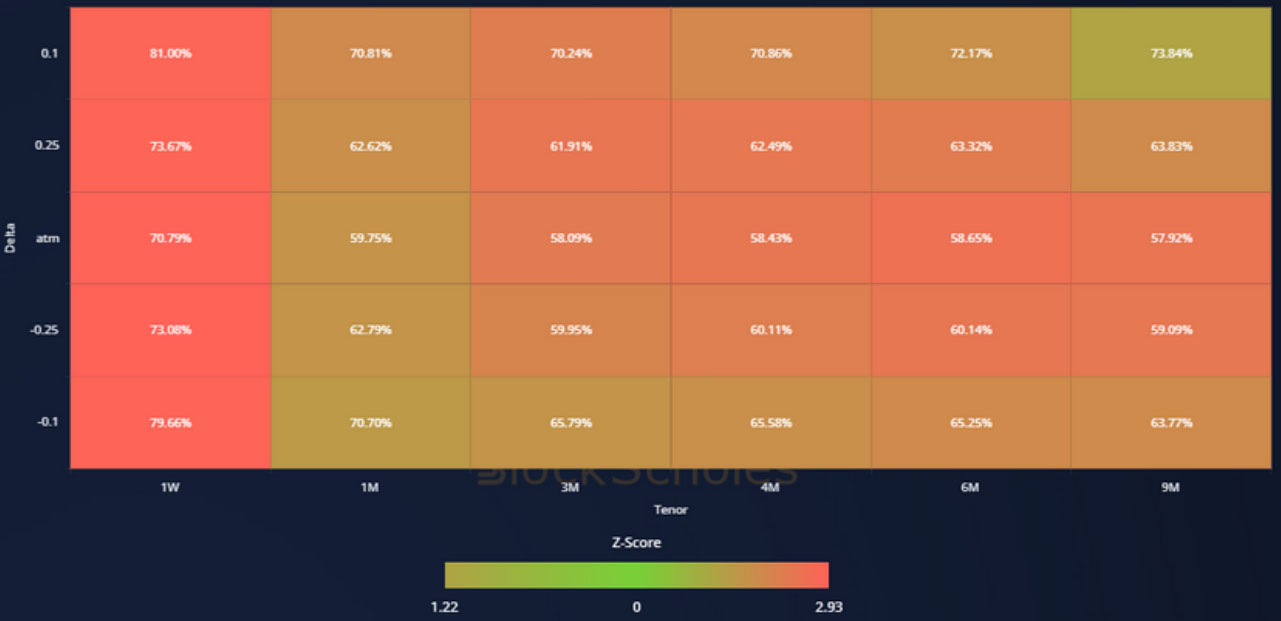
BTC IMPLIED VOL SURFACE – highlights the extreme rally in short-term volatility, even compared to the pickup elsewhere on the surface.
ETH IMPLIED VOL SURFACE – shows the strongest pickup in implied vol across the smile at a 3M tenor, as volatility across the surface picks up.
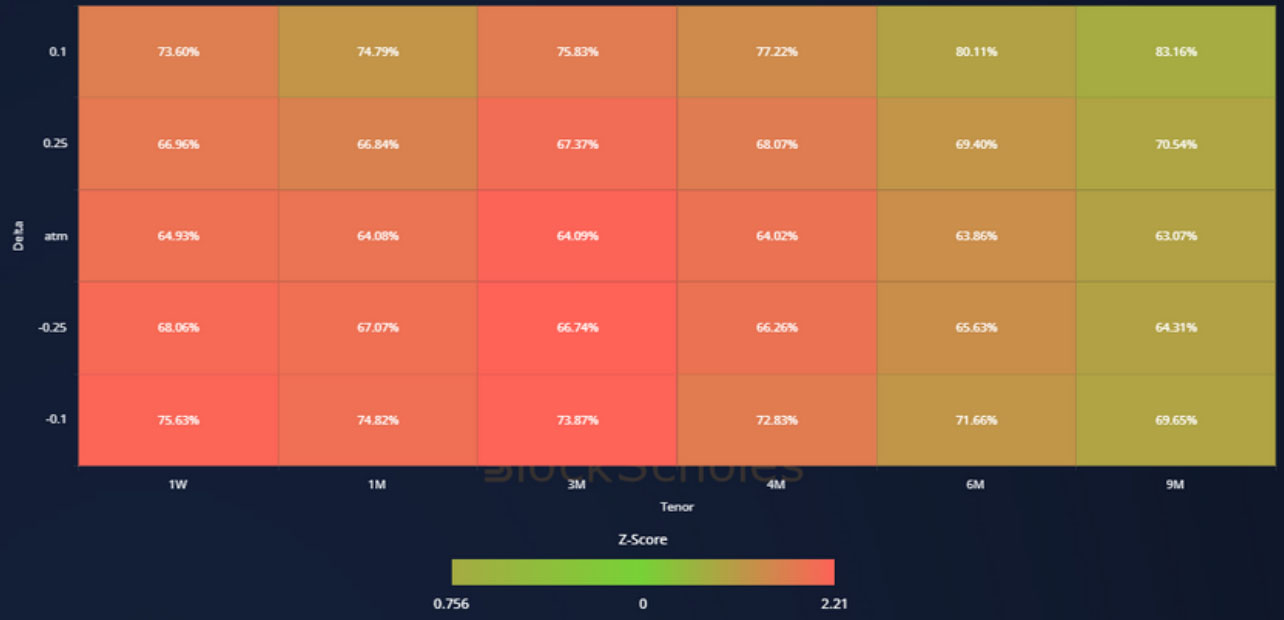
Z-Score calculated with respect to the distribution of implied volatility of an option at a given delta and tenor over the previous 30-days of hourly data, timestamp 10:00 UTC, SABR smile calibration.
Volatility Smiles
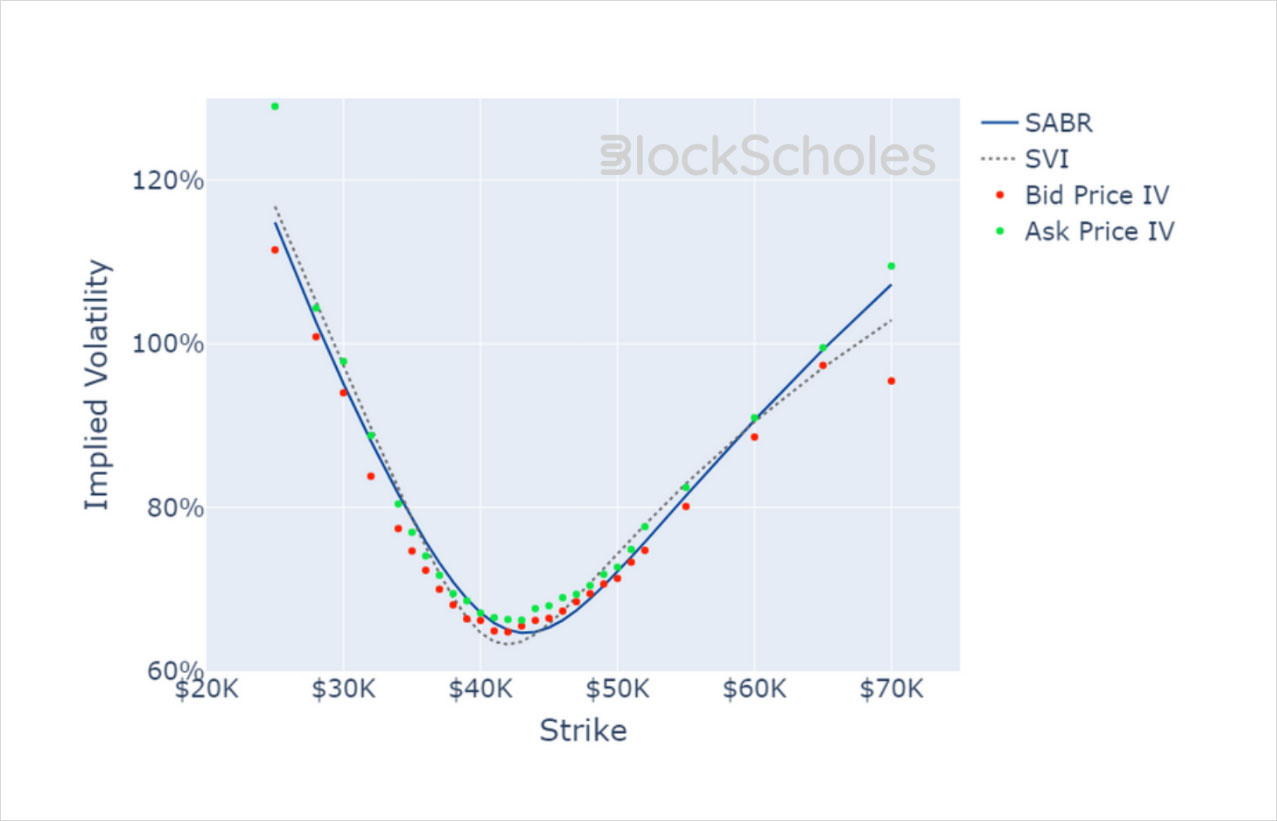
BTC SMILE CALIBRATIONS – 26-Jan-2024 Expiry, 11:00 UTC Snapshot.
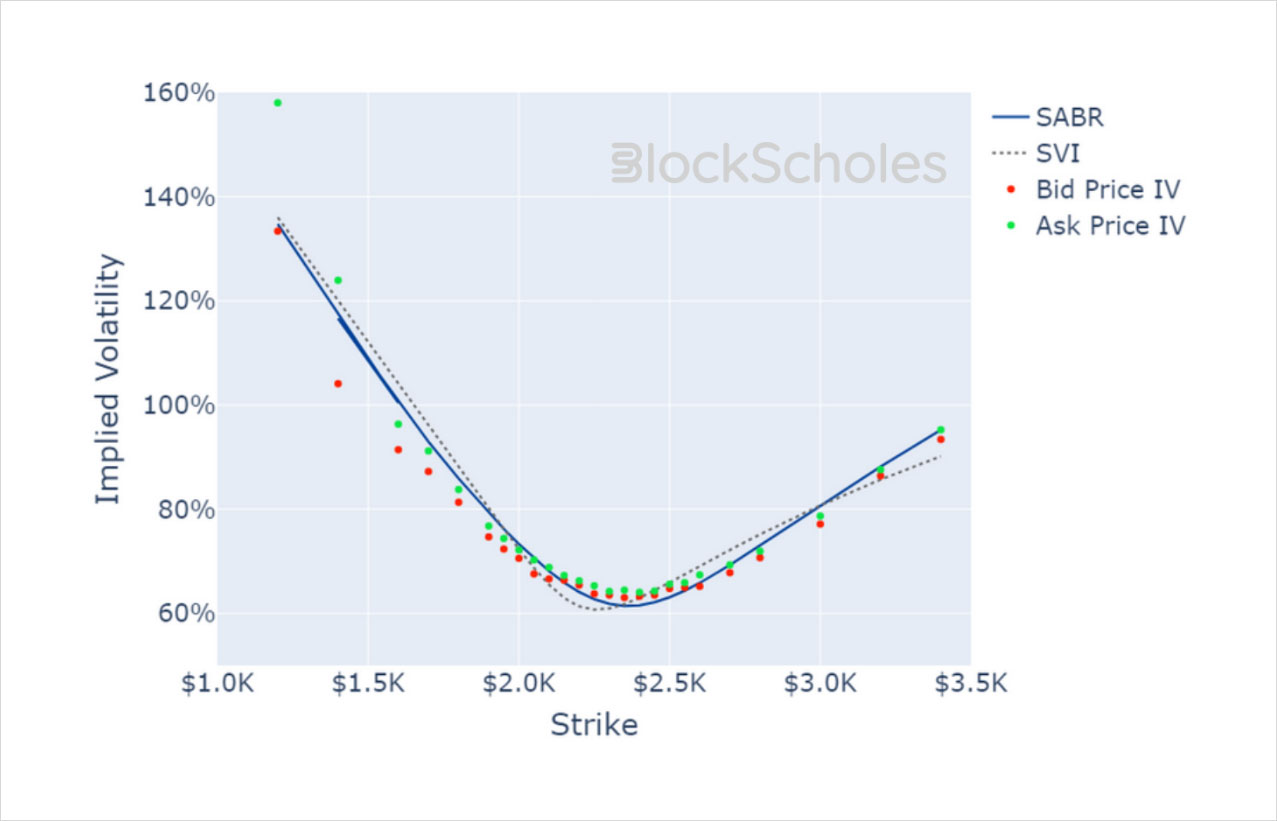
ETH SMILE CALIBRATIONS – 26-Jan-2024 Expiry, 11:00 UTC Snapshot.
Historical SABR Volatility Smiles
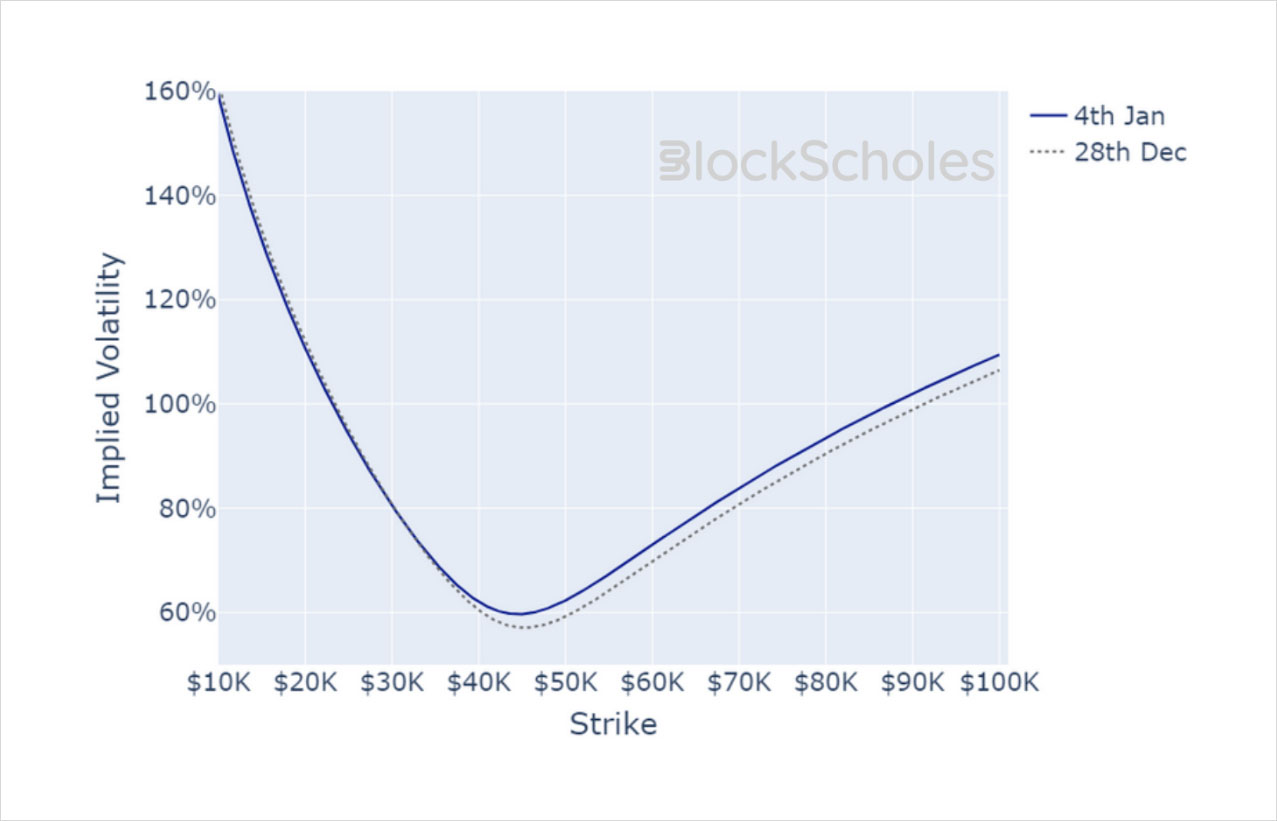
BTC SABR CALIBRATION – 30 Day Tenor, 11:00 UTC Snapshot.
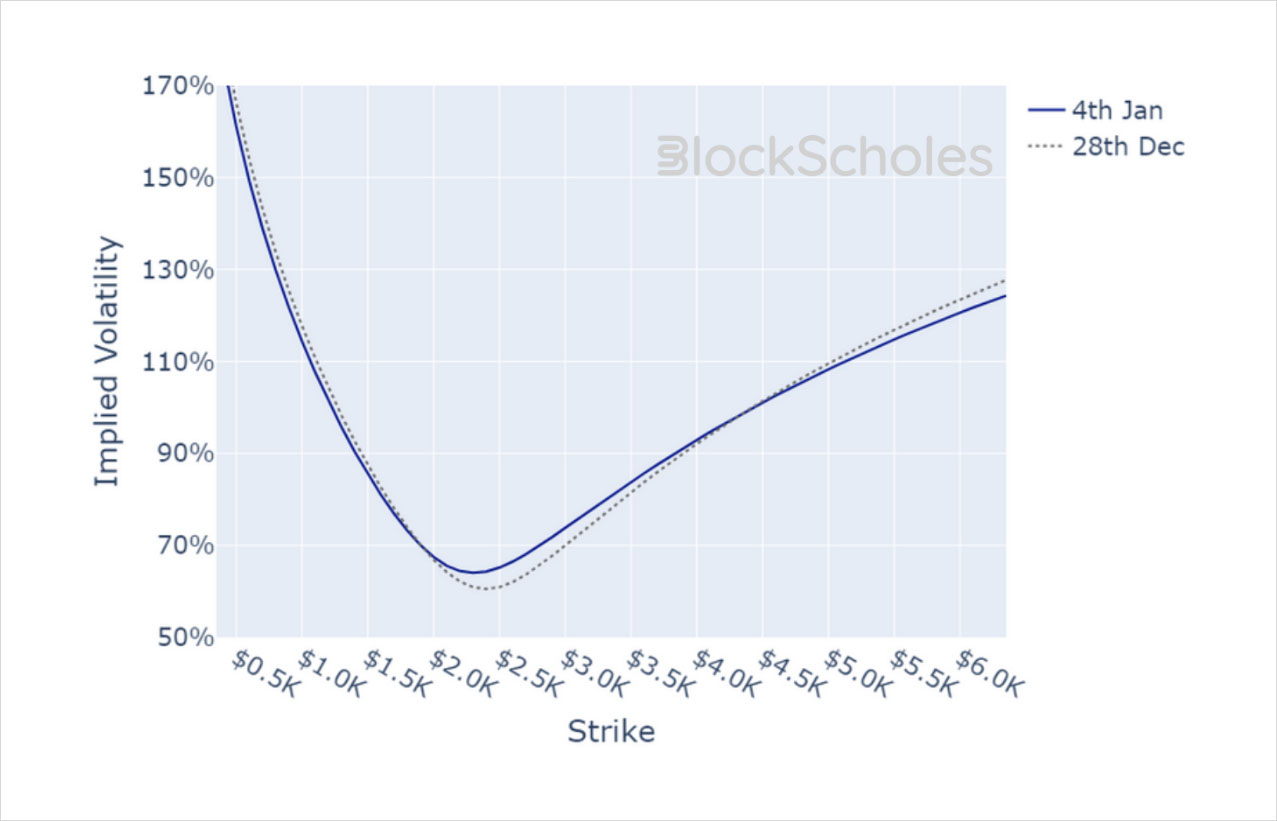
ETH SABR CALIBRATION – 30 Day Tenor, 11:00 UTC Snapshot.
AUTHOR(S)
Trading with a competitive edge. Providing robust quantitative modelling and pricing engines across crypto derivatives and risk metrics.