
Weekly recap of the crypto derivatives markets by BlockScholes.
Key Insights:
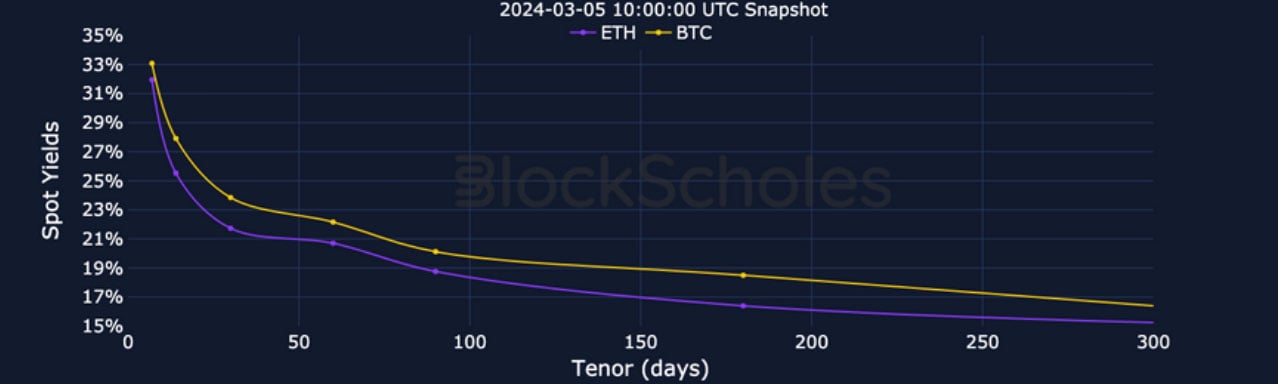
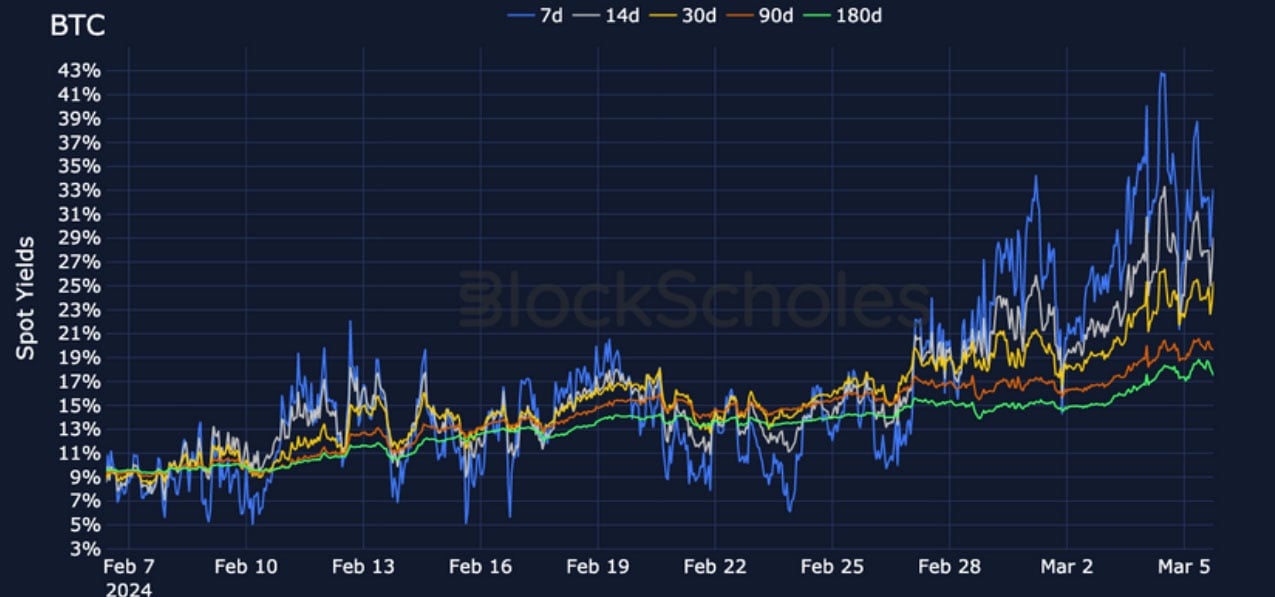
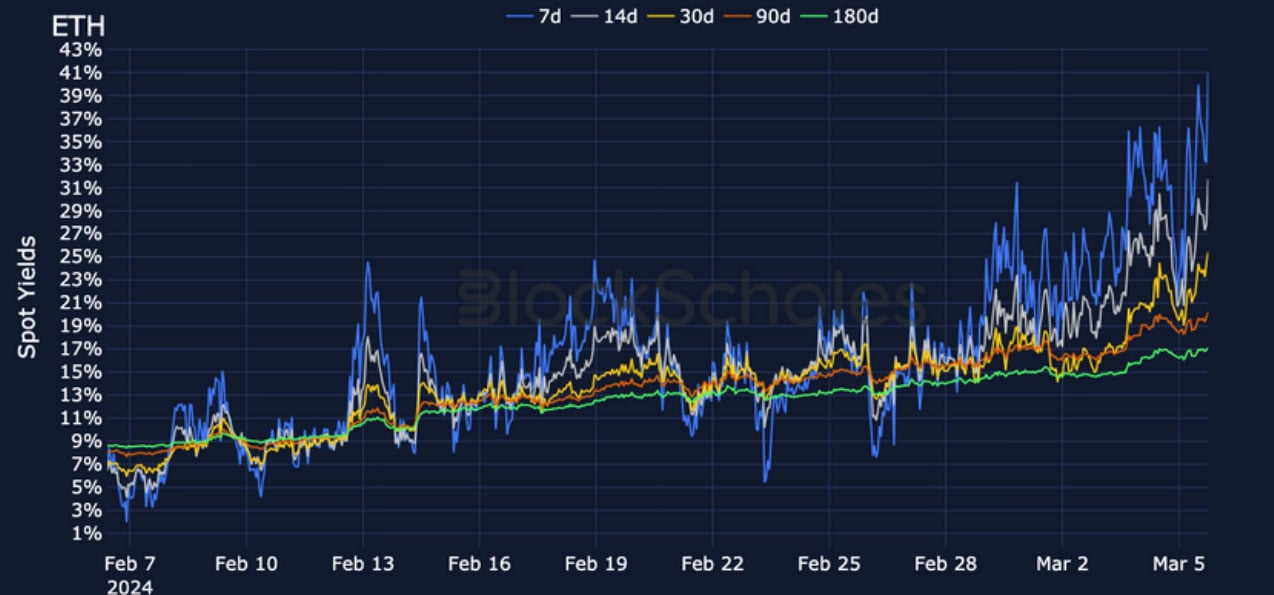
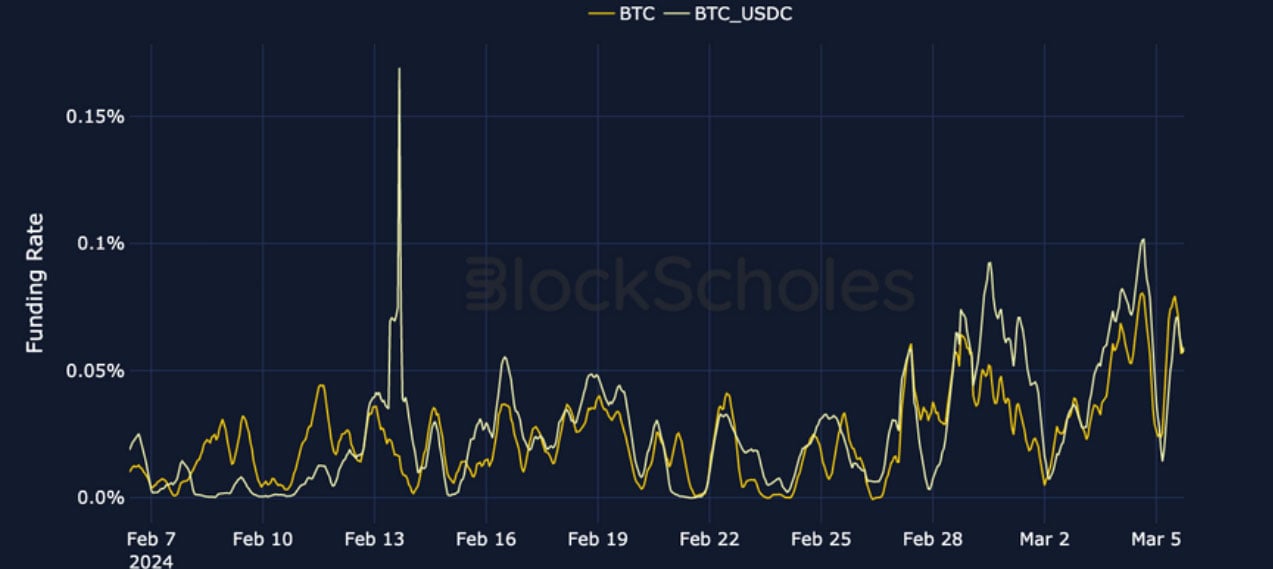
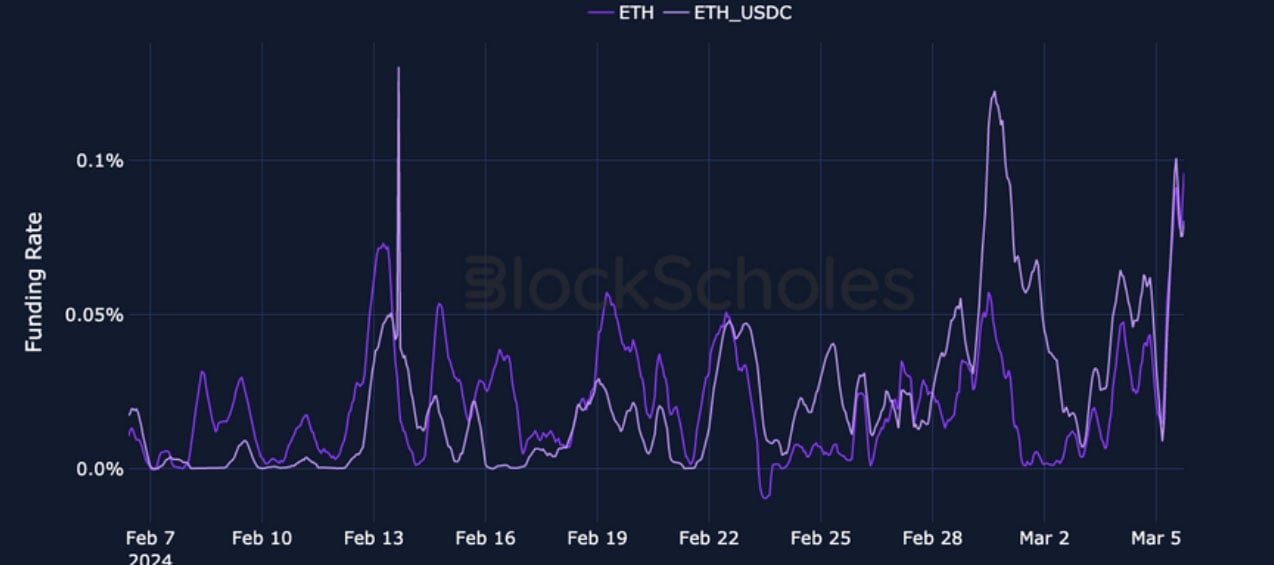
Futures-implied yields for BTC and ETH rose strongly during the rally to all-time high BTC prices, indicating a return to the strong demand for leveraged long exposure that we saw build-up ahead of the ETF announcement in late January. This is echoed by the extremely high funding rates for each coin. In a repeat of their reaction to last week’s spot rally, the term structures for both majors have inverted significantly, with the implied volatility at the front end reaching ~75%. Similarly, the volatility smiles are skewed strongly towards OTM calls, with a slight out-performance for BTC upside exposure over ETH.
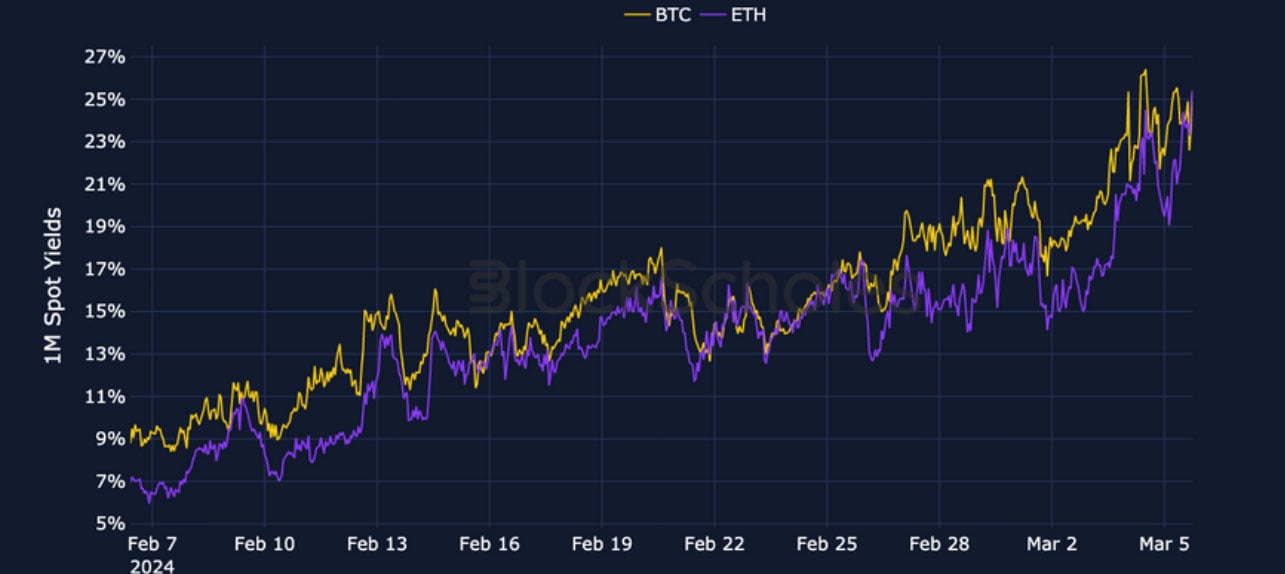
Futures Implied Yield, 1-Month Tenor
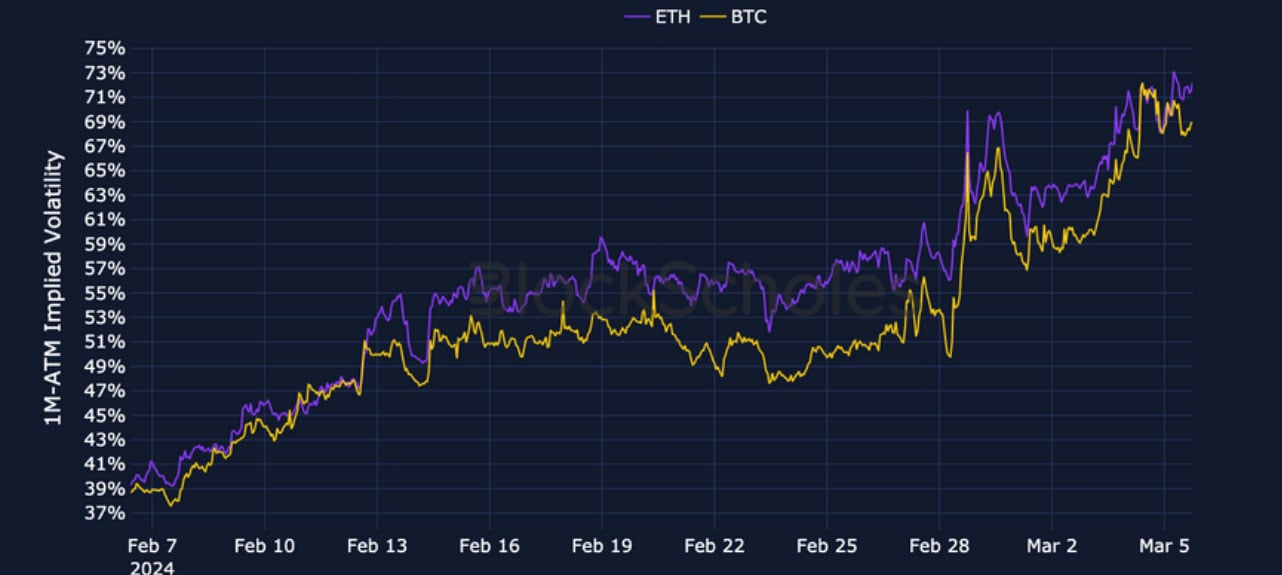
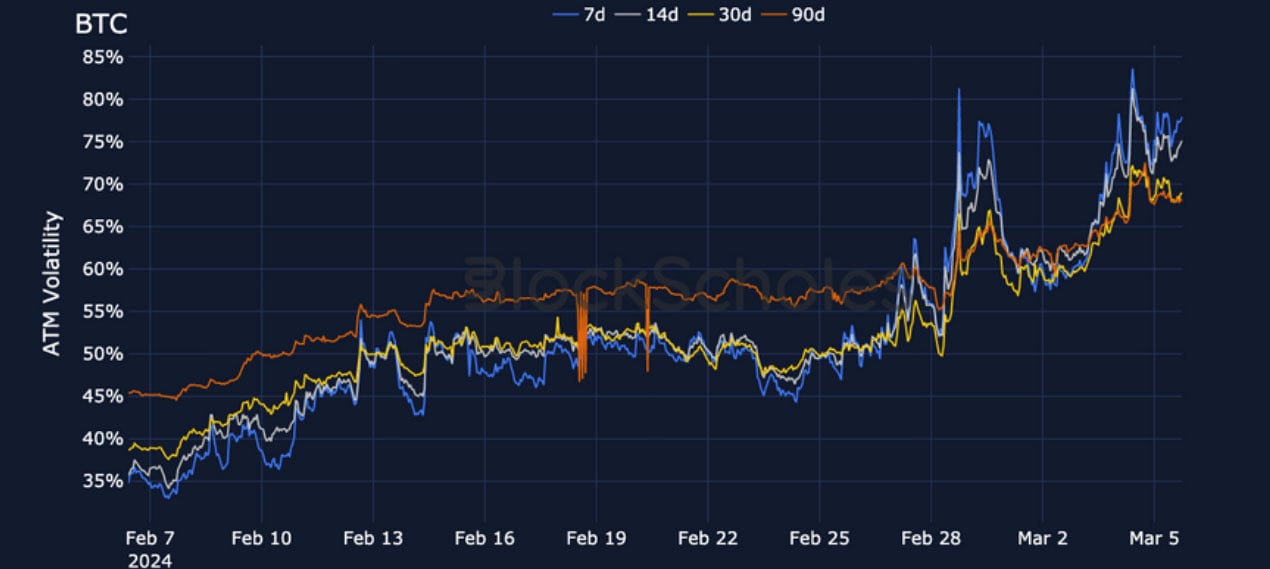
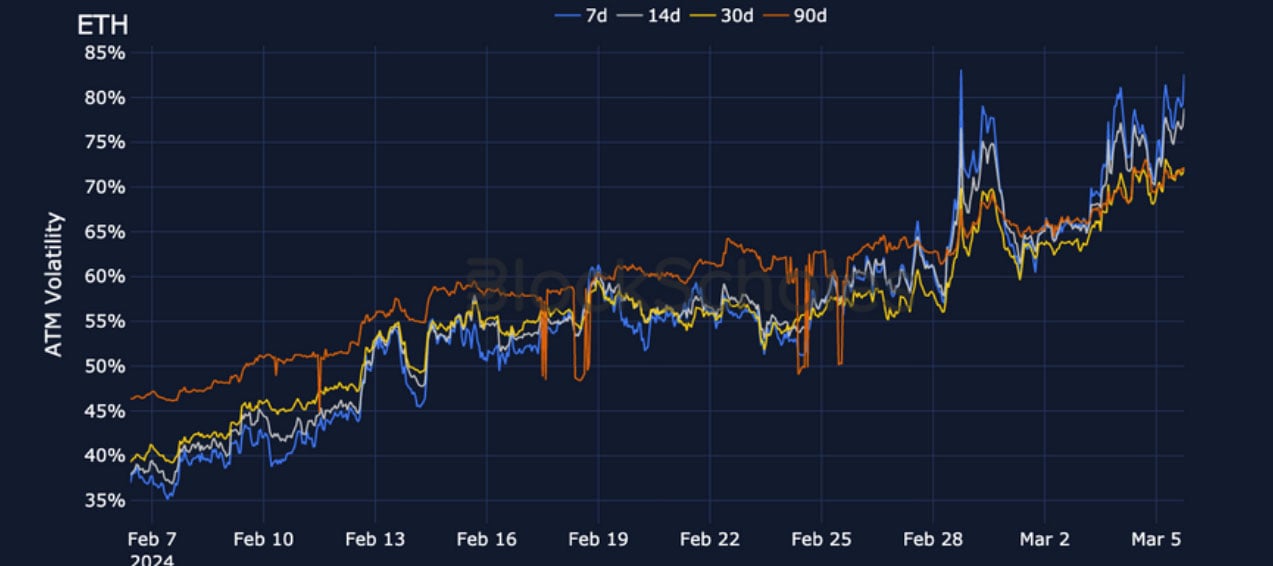
ATM Implied Volatility, 1-Month Tenor
*All data in tables recorded at a 10:00 UTC snapshot unless otherwise stated.
Futures
BTC ANNUALISED YIELDS – the strong demand for leverage has continued as BTC spot prices have continued to rally.
ETH ANNUALISED YIELDS – yields show a similar demand for leveraged long exposure, but with annualised rates peaking 10 points lower than BTC.
Perpetual Swap Funding Rate
BTC FUNDING RATE – funding rates trade at consistently high levels, reflecting the demand for long exposure in the listed expiry futures.
ETH FUNDING RATE – ETH perpetuals also trade at a consistent premium to the spot level, rising to similarly high levels as BTC’s perpetual.
BTC Options
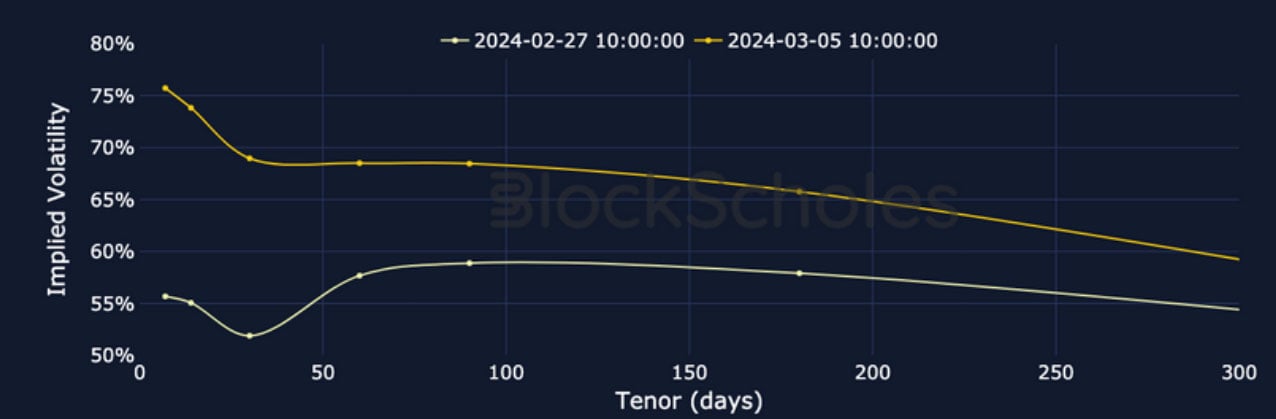
BTC SABR ATM IMPLIED VOLATILITY – the volatility term structure has inverted again in a repeat of last Wednesday’s rally.
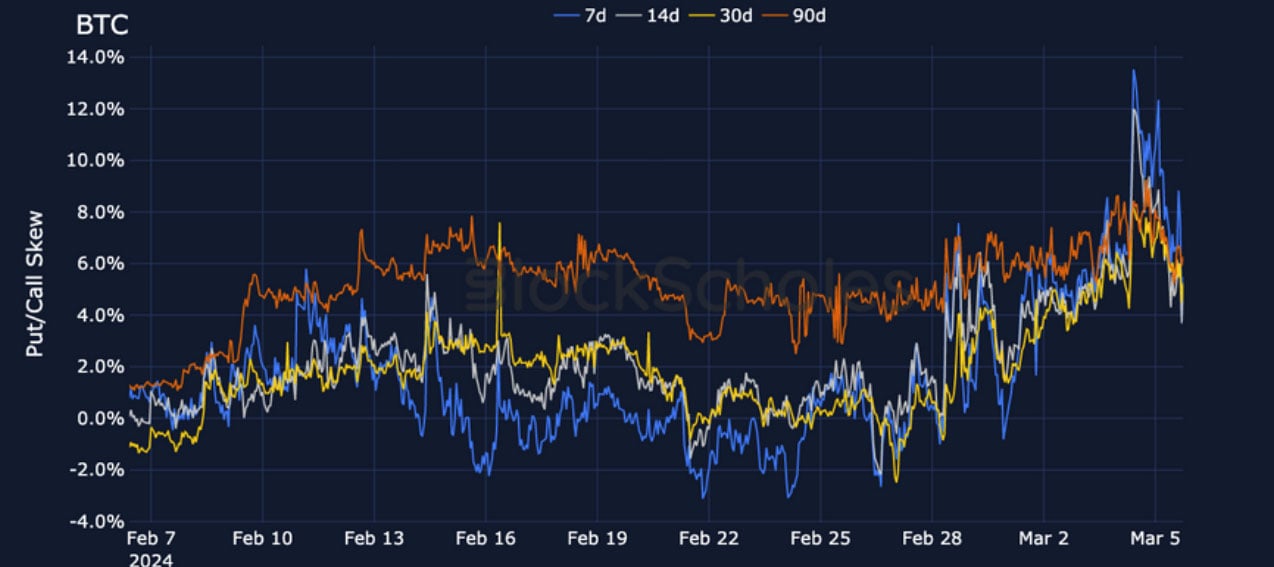
BTC 25-Delta Risk Reversal – while vol smiles skewed very strongly towards OTM calls in the last 24H, those levels have been moderated.
ETH Options
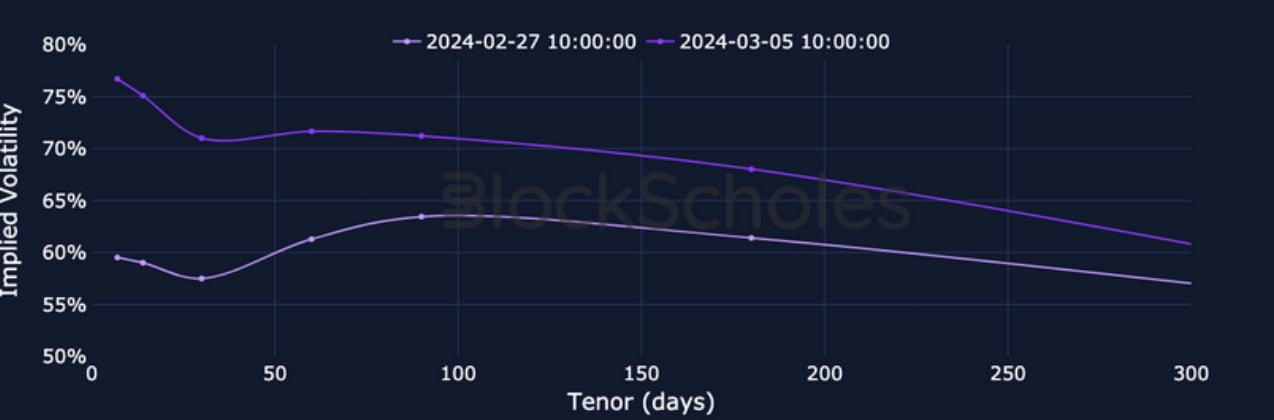
ETH SABR ATM IMPLIED VOLATILITY – ETH’s term structure is similarly inverted, with ATM vols rising as high as 80% at short tenors.
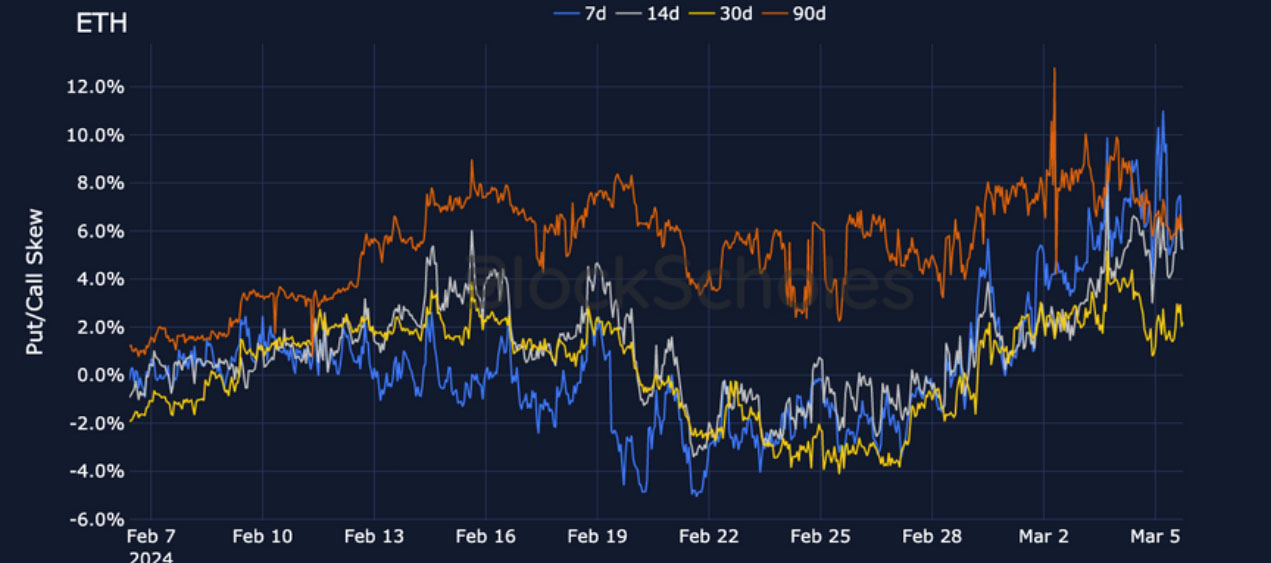
ETH 25-Delta Risk Reversal – ETH vol smiles are skewed decisively towards calls, but did not see the same spike and reversal that BTC’s did.
Volatility Surface
BTC IMPLIED VOL SURFACE – volatility across the surface is at the top of its 30-day range, with short-tenor OTM calls outperforming.
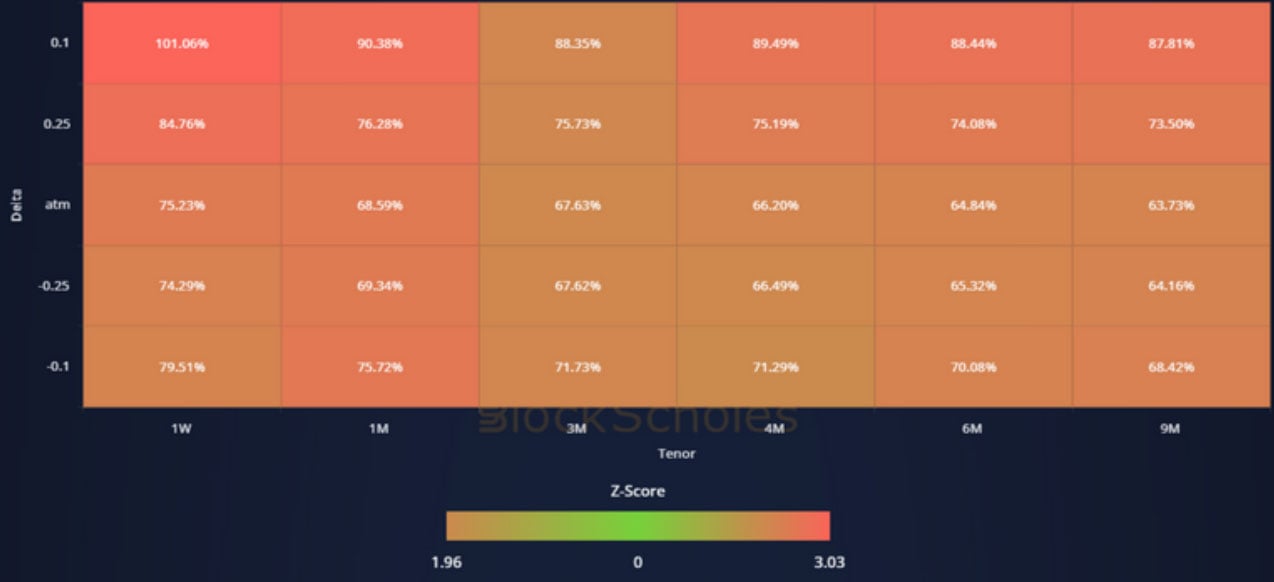
ETH IMPLIED VOL SURFACE – ETH’s vol surface shows a rise in volatility across the surface, with out-performance in 1W and 1M calls and 3M puts.
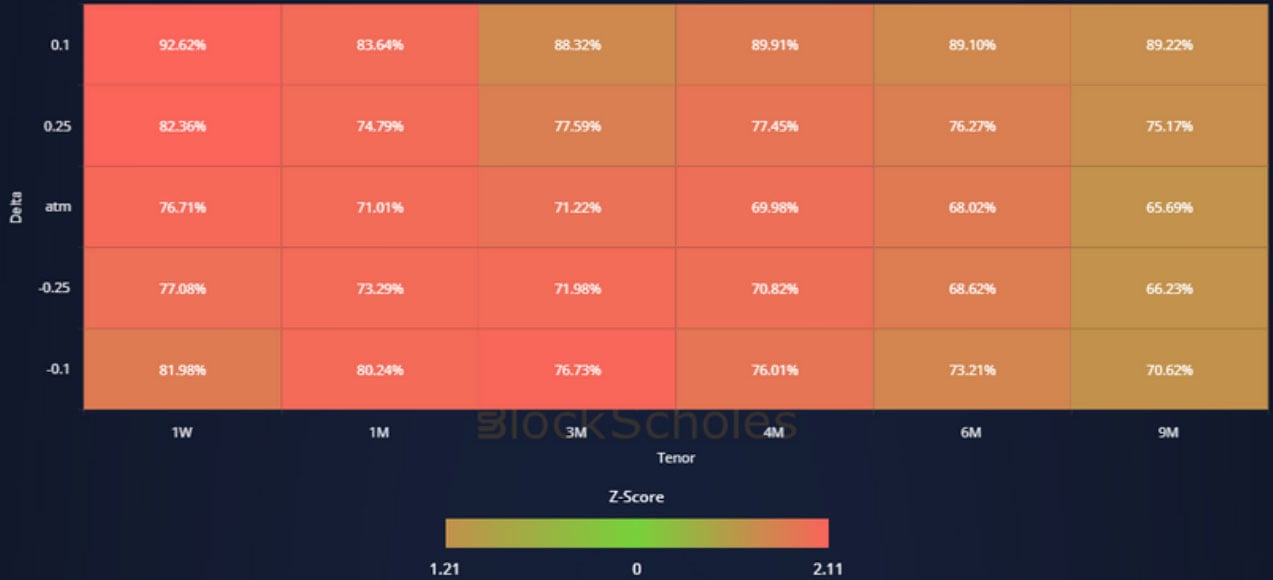
Z-Score calculated with respect to the distribution of implied volatility of an option at a given delta and tenor over the previous 30-days of hourly data, timestamp 10:00 UTC, SABR smile calibration.
Volatility Smiles
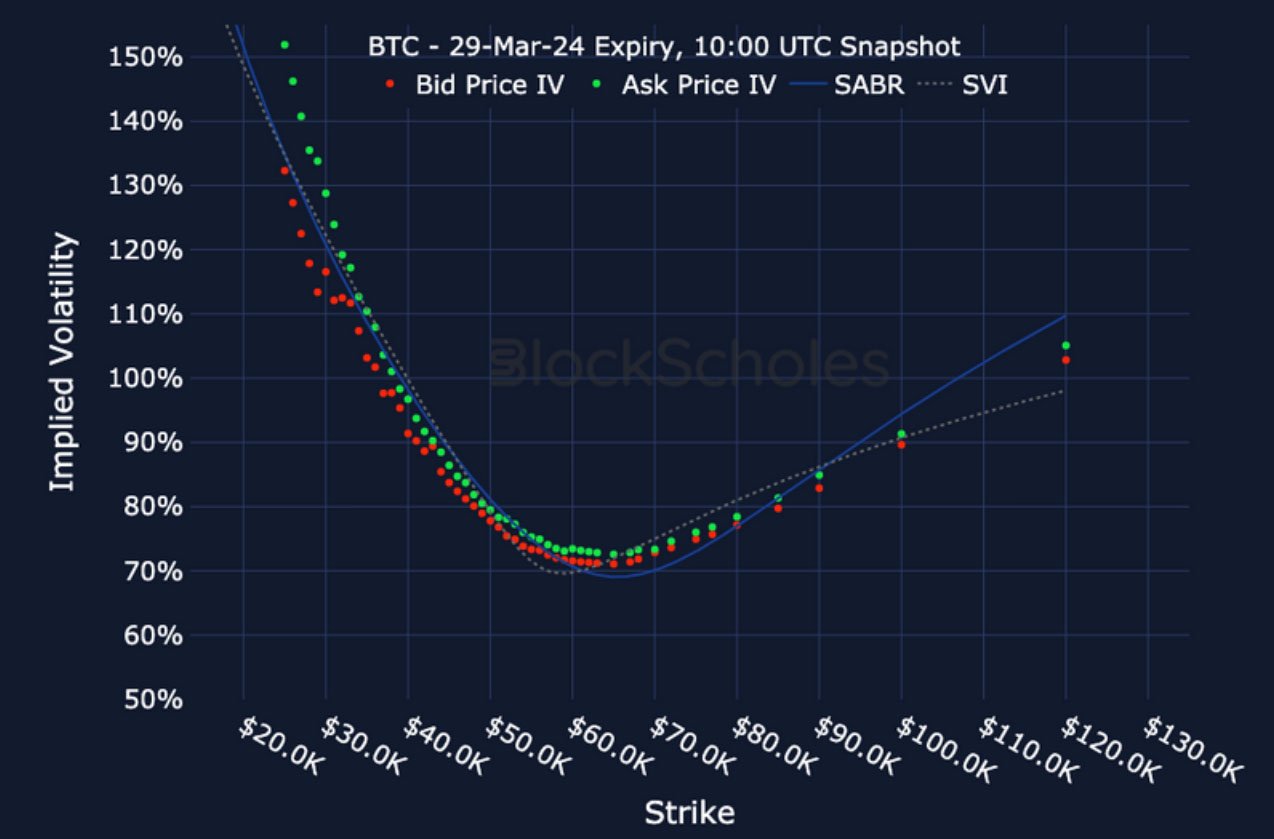
BTC SMILE CALIBRATIONS – 29-Mar-2024 Expiry, 10:00 UTC Snapshot.
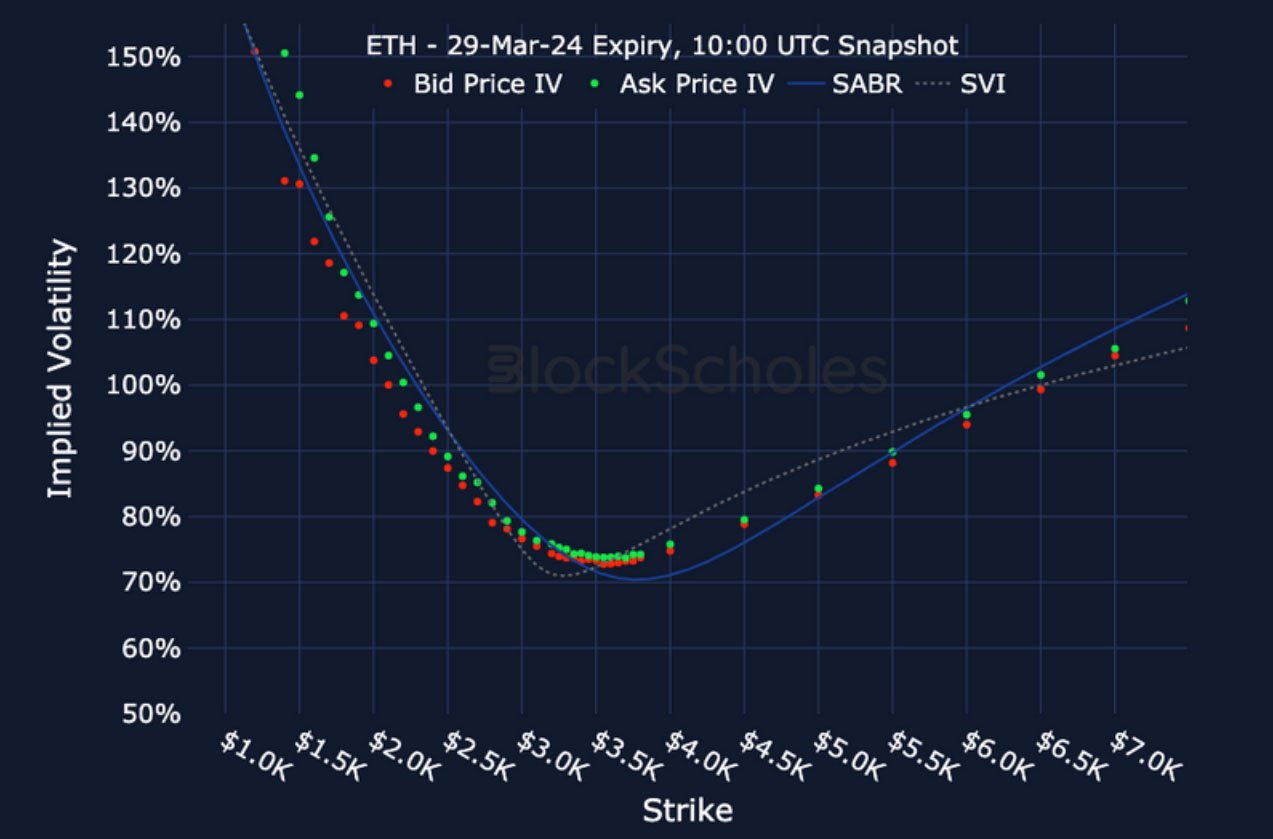
ETH SMILE CALIBRATIONS – 29-Mar-2024 Expiry, 10:00 UTC Snapshot.
Historical SABR Volatility Smiles
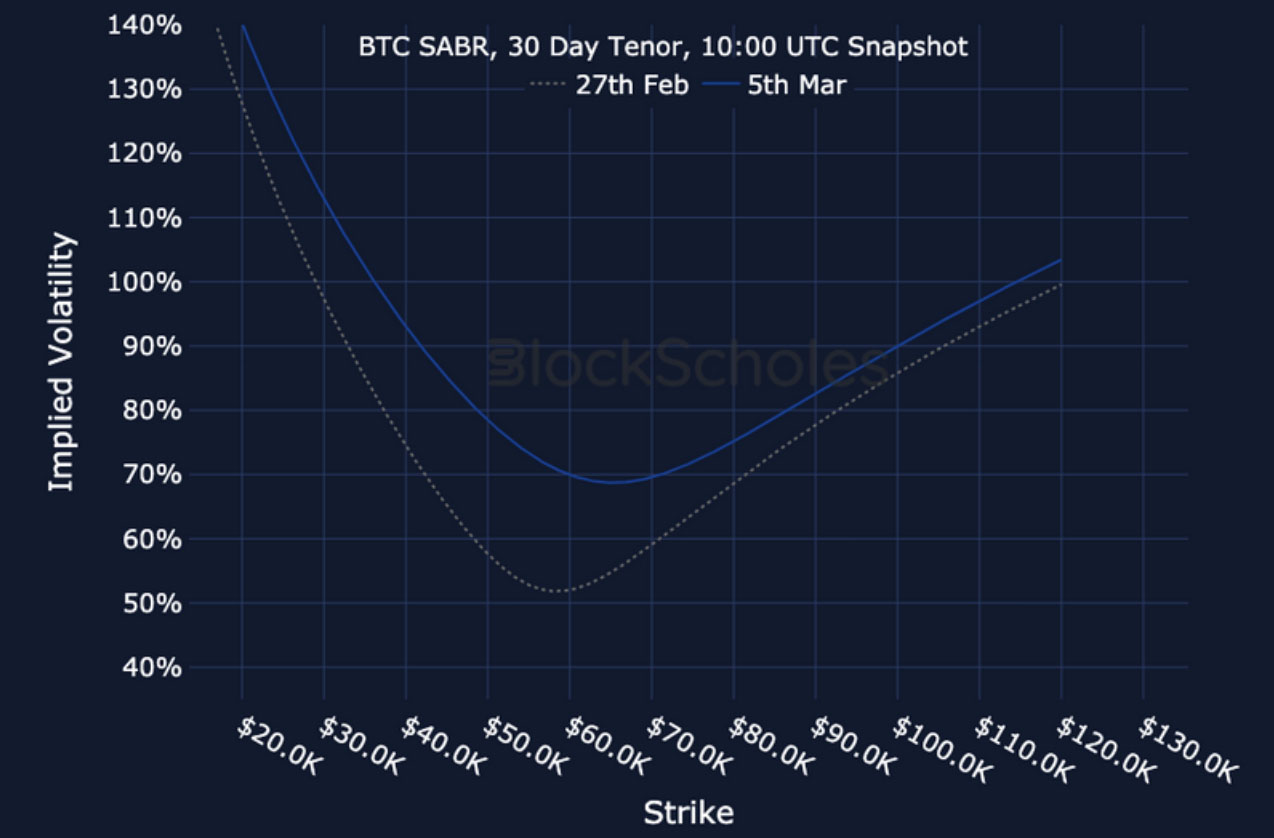
BTC SABR CALIBRATION – 30 Day Tenor, 10:00 UTC Snapshot.
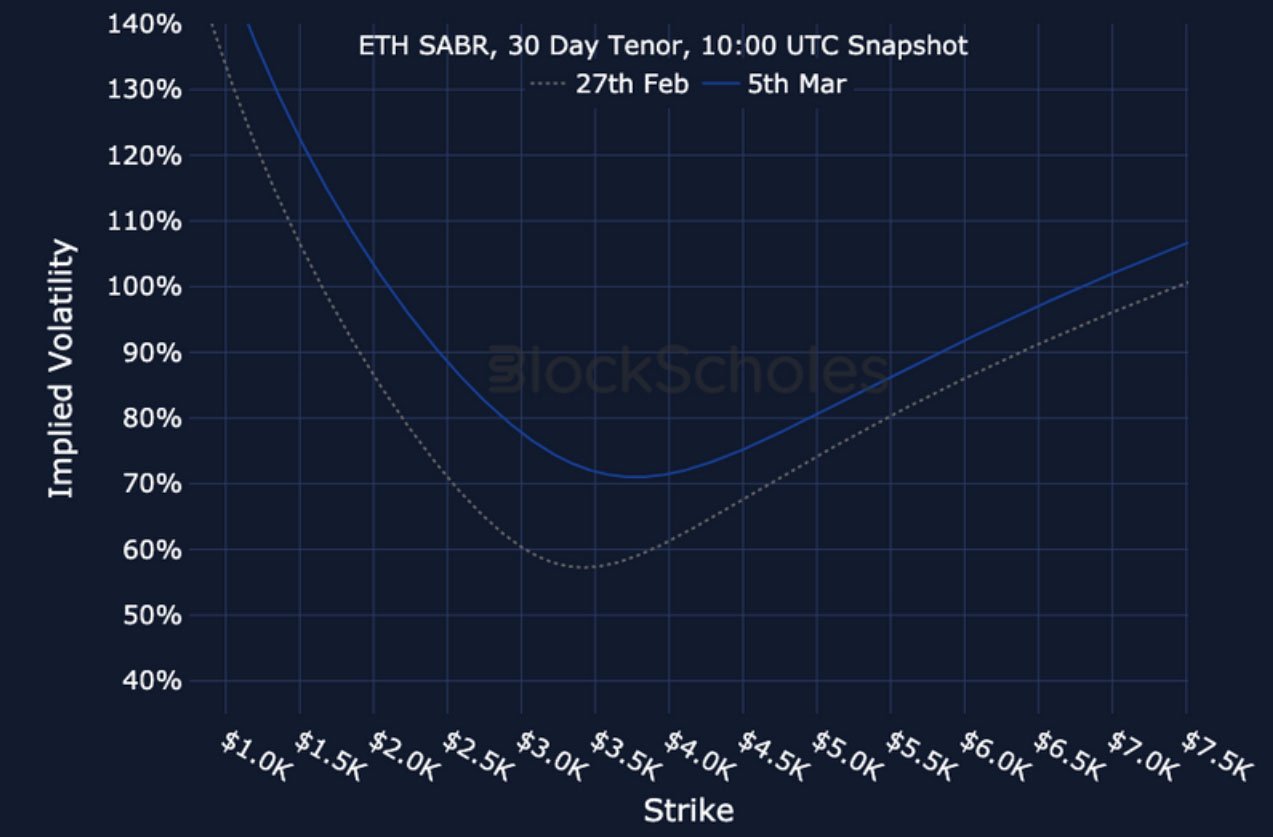
ETH SABR CALIBRATION – 30 Day Tenor, 10:00 UTC Snapshot.
AUTHOR(S)
Trading with a competitive edge. Providing robust quantitative modelling and pricing engines across crypto derivatives and risk metrics.