
Weekly recap of the crypto derivatives markets by BlockScholes.
Key Insights:
Realised volatility in spot prices over the last week has not translated into a large increase in implied vols, which continue to trade in their recent range of 40%-50% across the terms structure. However, the downturn and recovery in spot did lead a similar movement in the skew of the volatility smile, as expressed by the 25-delta, 1-month risk-reversals of each asset. Long exposure via the perpetual swap contract remains in high demand – as it has since March of this year.
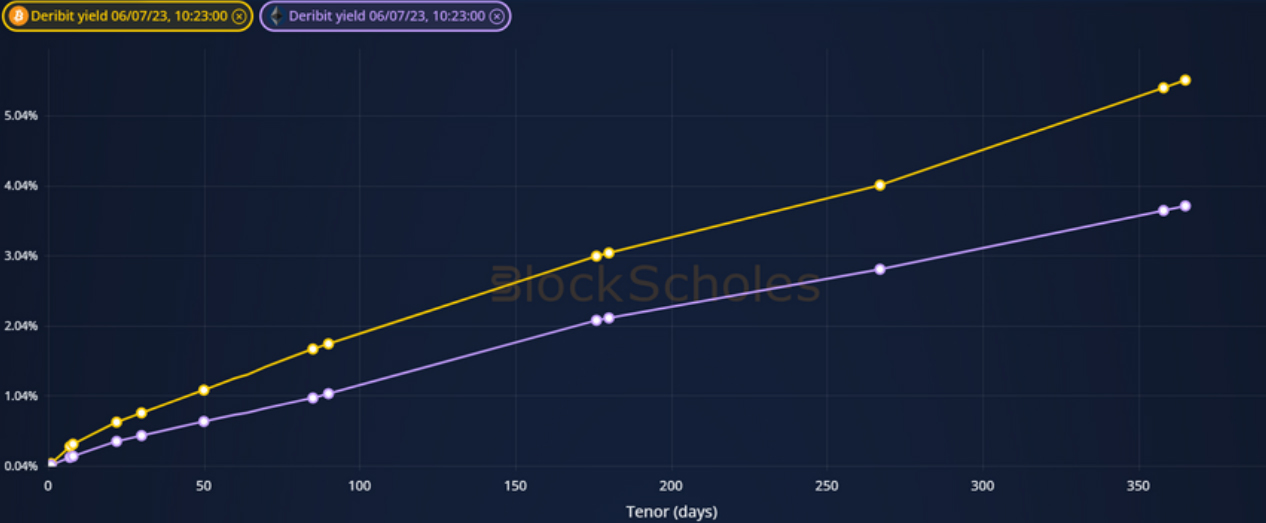
FUTURES IMPLIED YIELD TERM STRUCTURE.
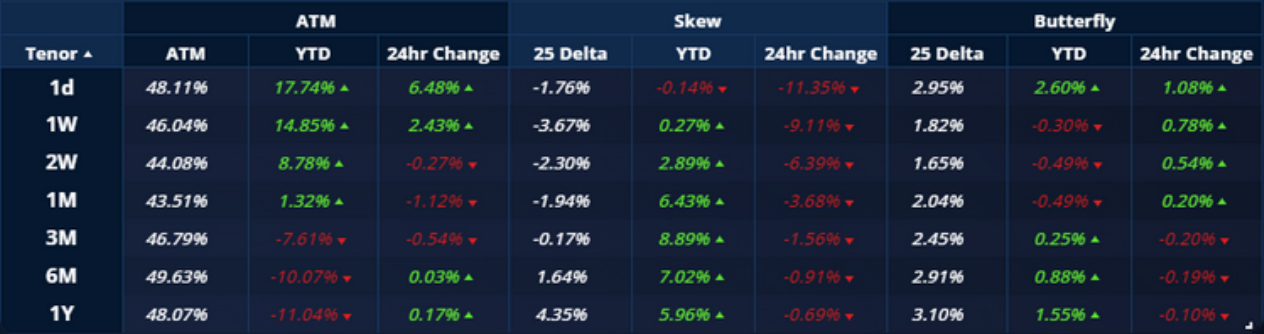
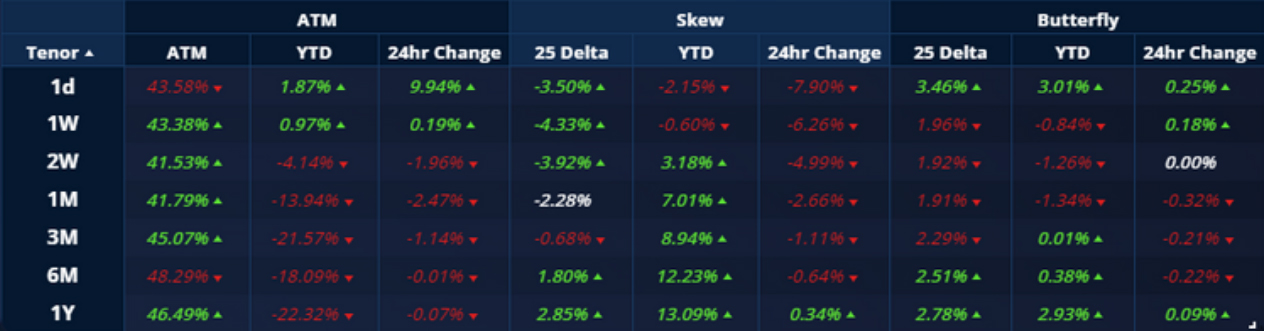
VOLATILITY SURFACE METRICS.

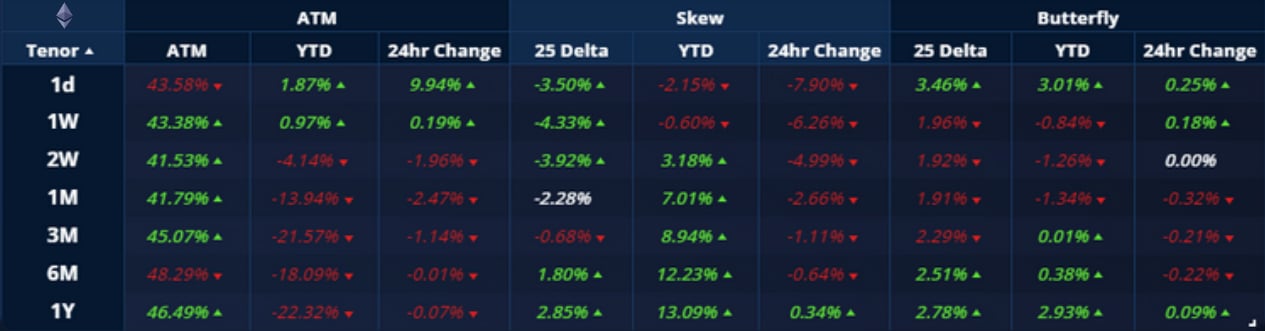
All data in tables are recorded at a 10:00 UTC snapshot unless otherwise stated.
Futures
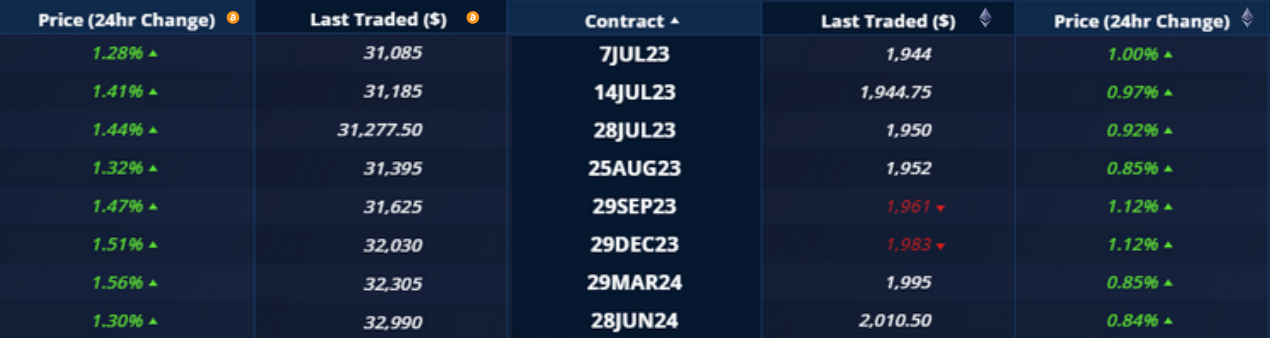
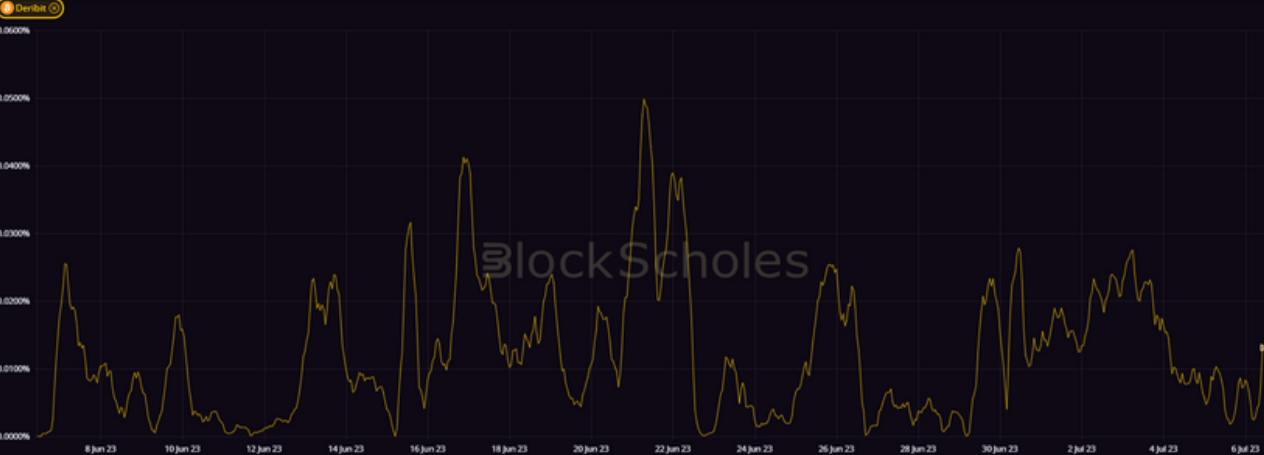
BTC ANNUALISED YIELDS – remain inverted throughout the past 30 days, spiking significantly in response to rallies in spot price.

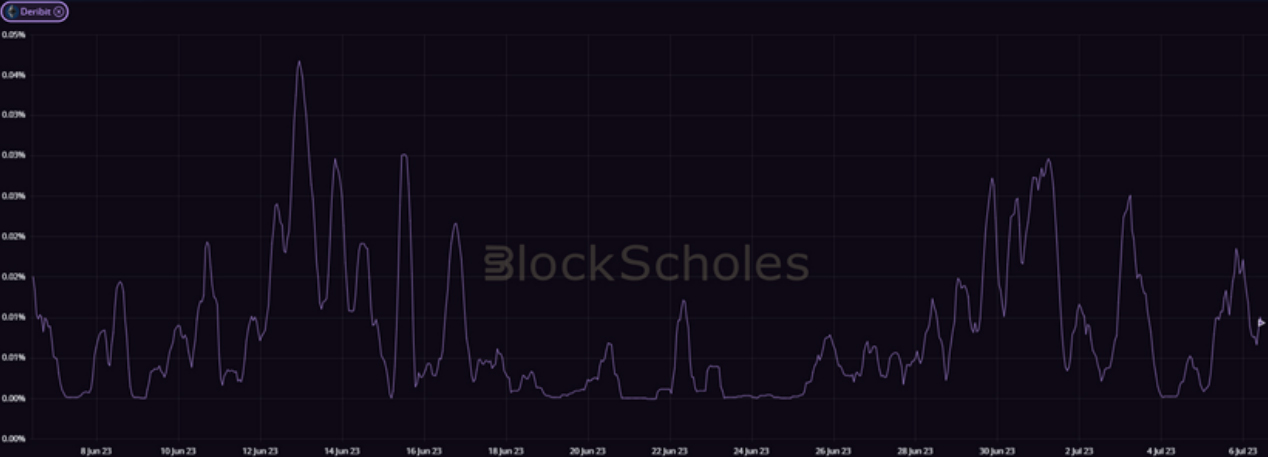
ETH ANNUALISED YIELDS – have not traded with the same volatility as BTC’s, and have trended steadily upwards over the last 7 days.

Perpetual Swap Funding Rate
BTC FUNDING RATE – has shown no sign of the demand for long exposure through the perpetual swap contract dwindling.
ETH FUNDING RATE – has seen rates paid consistently to short holders as long positions continue to pay for exposure to ETH’s spot price.
BTC Options
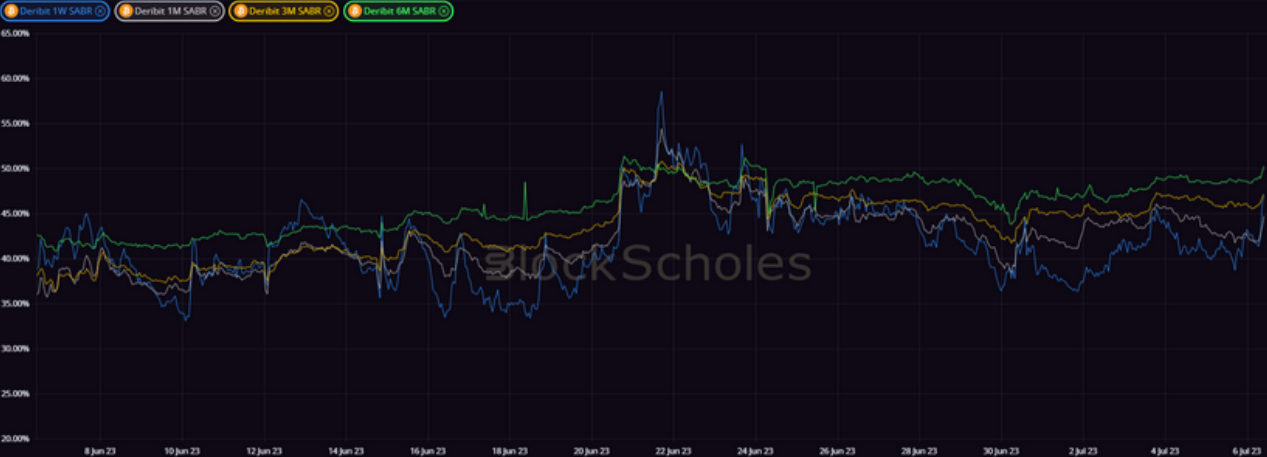
BTC SABR ATM IMPLIED VOLATILITY – has remained above its pre-rally levels, with a pickup across the term structure in the last 24 hours.
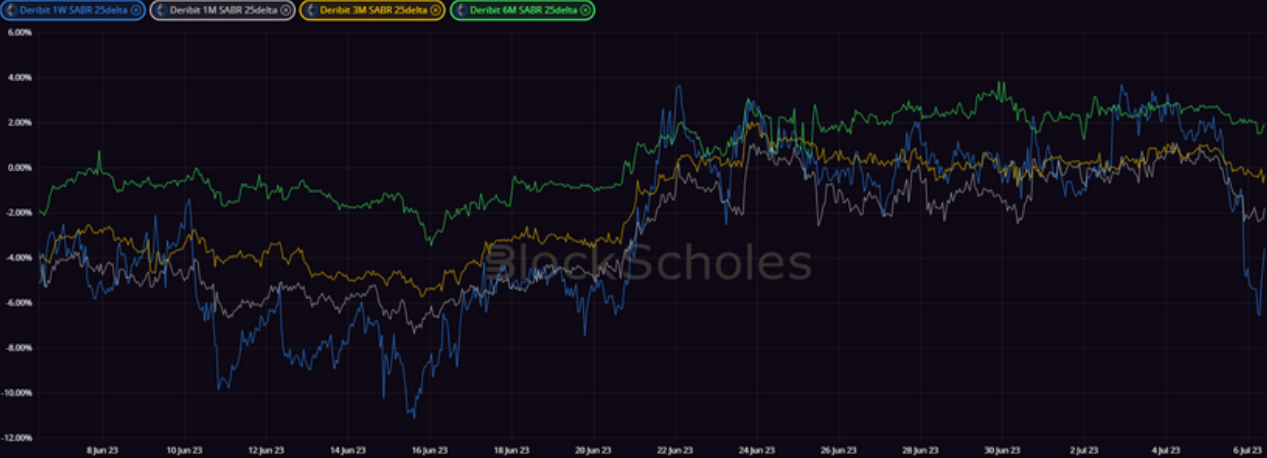
BTC 25-Delta Risk Reversal – skewed sharply towards puts in the last 24 hours as spot prices stumble, before beginning a recovery towards neutral.

ETH Options
ETH SABR ATM IMPLIED VOLATILITY – continues to trade in the 40%-50% range across the term structure, with longer tenors at a higher vol level.

ETH 25-Delta Risk Reversal – fell in tandem with BTC’s during the short spot downturn at the end of the 7 day period.
Volatility Surface
BTC IMPLIED VOL SURFACE – highlights a surface-wide trend high in implied volatility, with longer dated tenors seeing the largest increase.

ETH IMPLIED VOL SURFACE – shows a fall in the implied volatility of OTM calls at a 1-month tenor, with a mixed response elsewhere on the surface.

Z-Score calculated with respect to the distribution of implied volatility of an option at a given delta and tenor over the previous 30-days of hourly data, timestamp 10:00 UTC, SABR smile calibration
Volatility Smiles
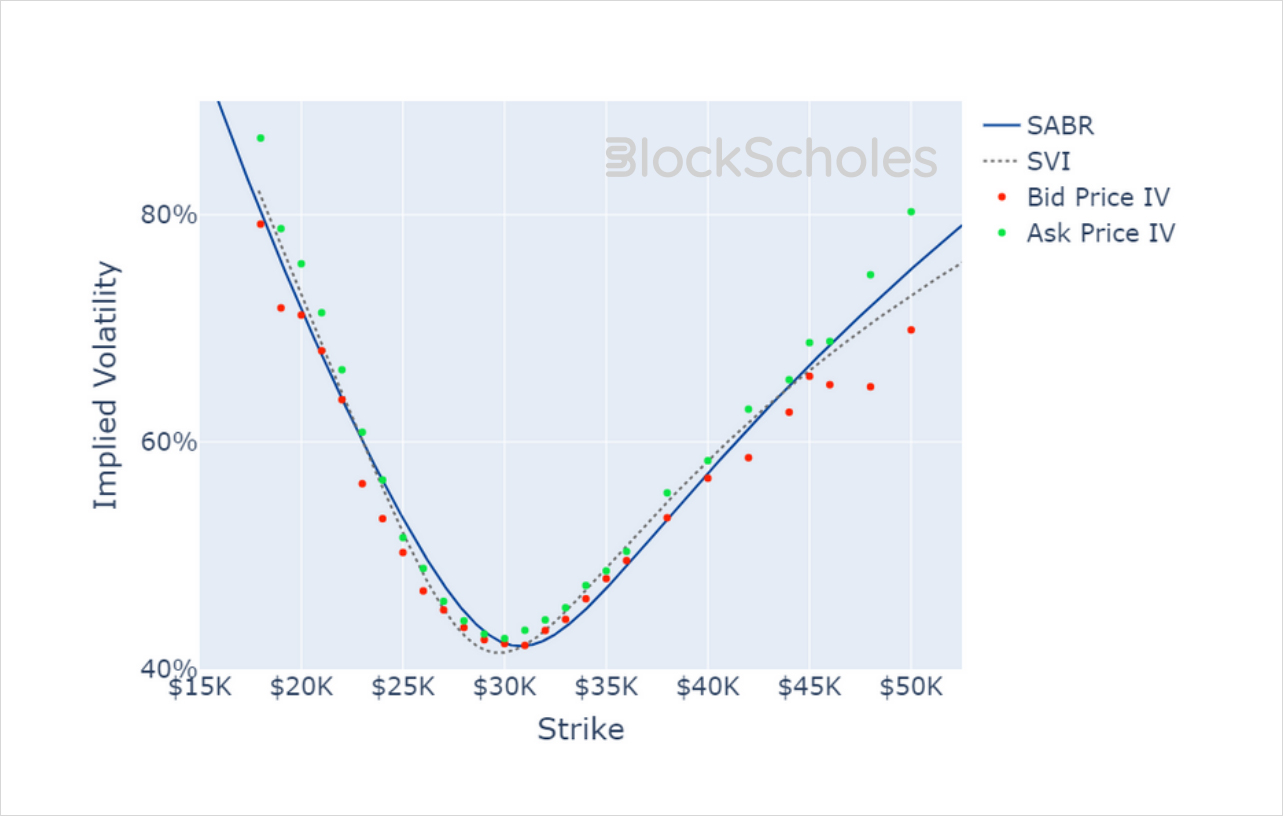
BTC SMILE CALIBRATIONS – 28-Jul-2023 Expiry, 10:00 UTC Snapshot.
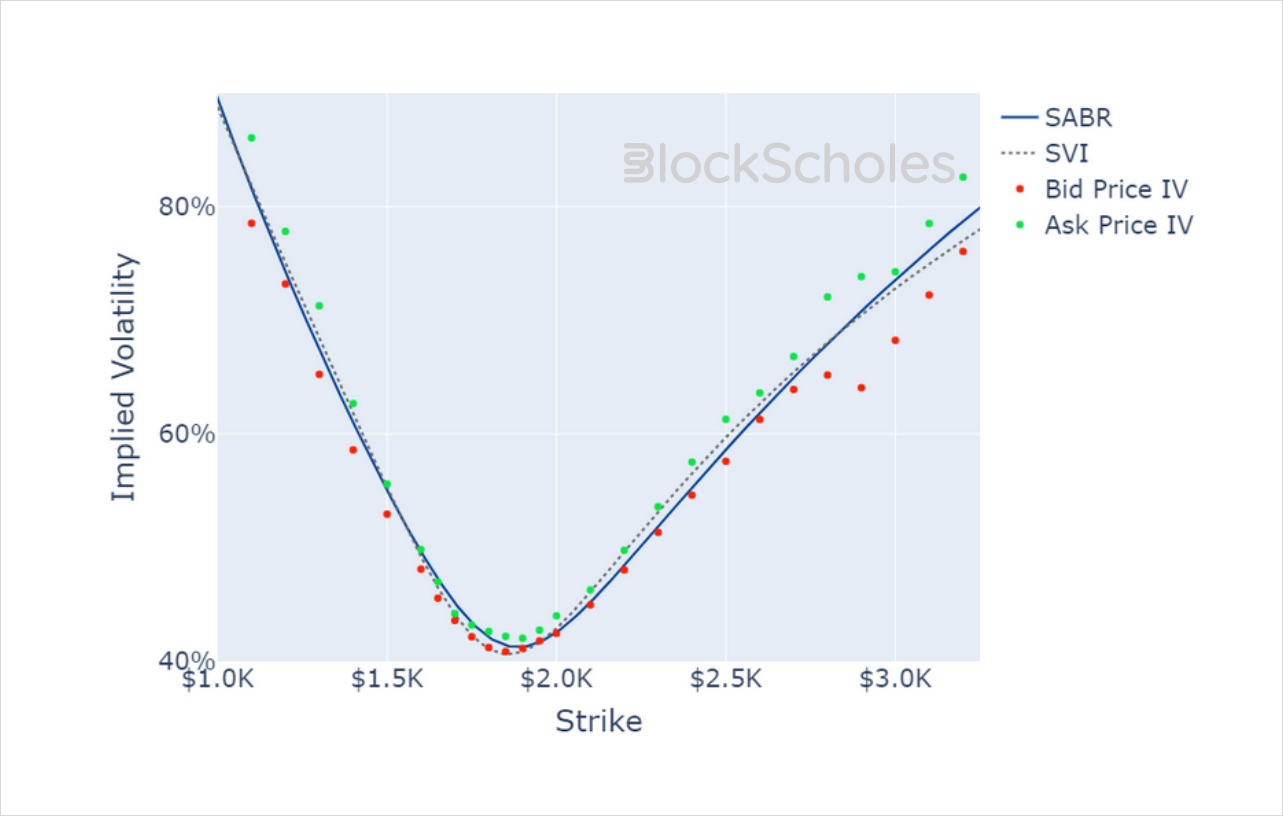
ETH SMILE CALIBRATIONS – 28-Jul-2023 Expiry, 10:00 UTC Snapshot.
Historical SABR Volatility Smiles
BTC SABR CALIBRATION – 30 Day Tenor, 10:00 UTC Snapshot.

ETH SABR CALIBRATION – 30 Day Tenor, 10:00 UTC Snapshot.

AUTHOR(S)
Trading with a competitive edge. Providing robust quantitative modelling and pricing engines across crypto derivatives and risk metrics.