
Weekly recap of the crypto derivatives markets by BlockScholes.
Key Insights:
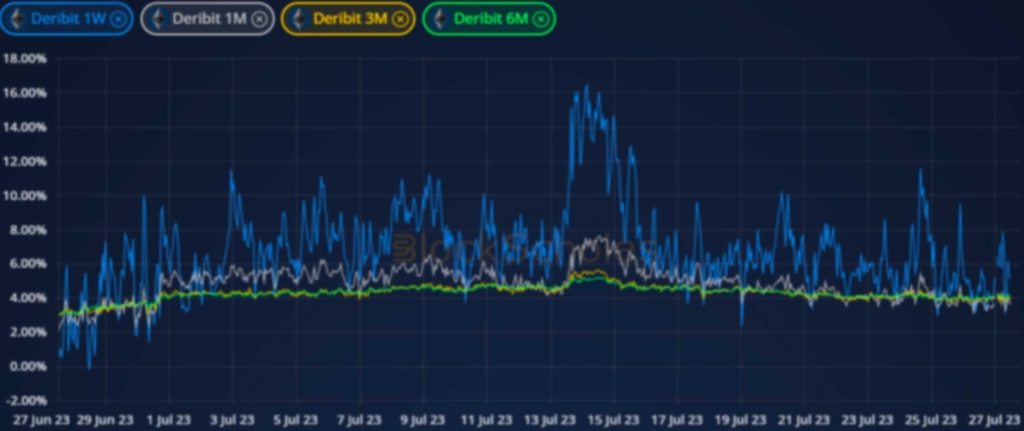
Implied volatility has continued to fall across the term structures of both BTC and ETH, reaching new all- time lows between 25% and 30% at short tenors. The sustained support for long exposure through the perpetual swap contract looked to have been subdued somewhat at the beginning of the last week, before ramping up again in the last 24 hours. In a similar time frame, ETH risk-reversals have recovered to price for a more neutral volatility smile, closer to that expressed by BTC’s options market.
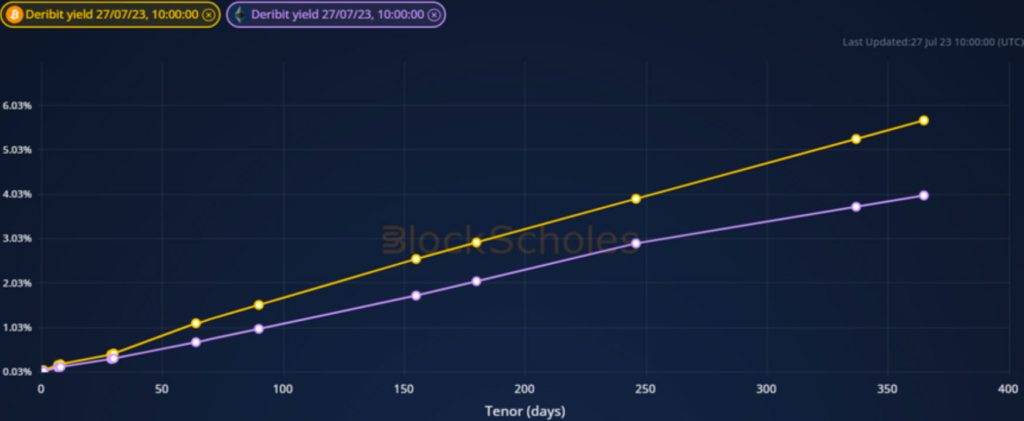
Futures implied yield term structure.
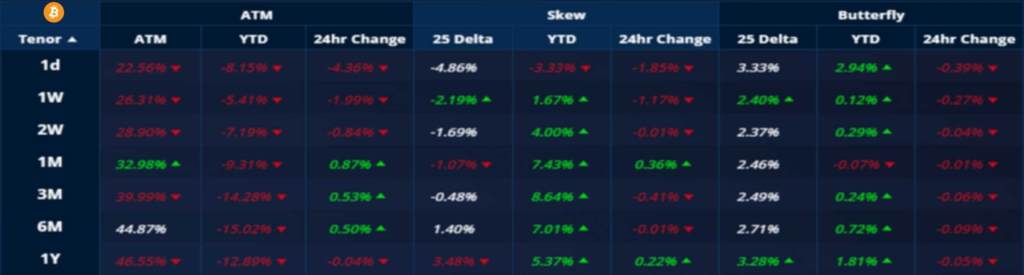
Volatility Surface Metrics.

*All data in tables recorded at a 10:17 UTC snapshot unless otherwise stated.
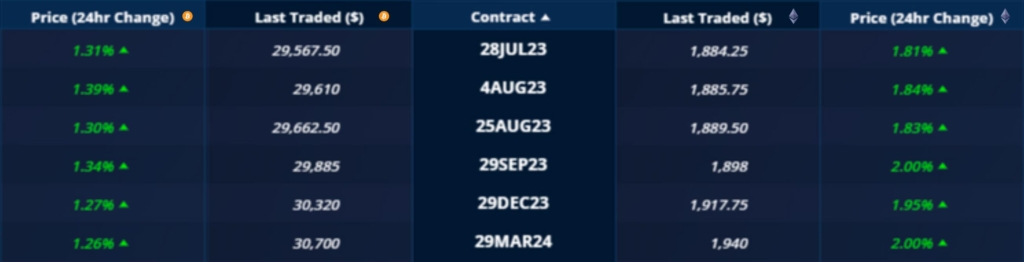
Futures
BTC ANNUALISED YIELDS – Trade positively at a more muted range of 5- 10% whilst trending upwards in the later part of the last week.

ETH ANNUALISED YIELDS – Remain in a tighter range than BTC’s, with futures trading in the 4-6% range above spot at an annualised rate.
Perpetual Swap Funding Rate
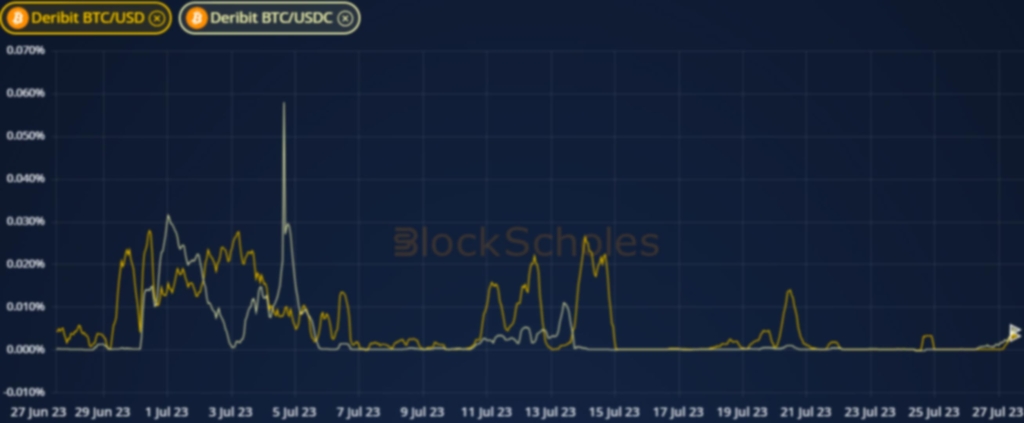
BTC FUNDING RATE – A relatively muted week shows signs of ramping back up as long positions begin to pay for leveraged exposure via the spot-linked derivative.
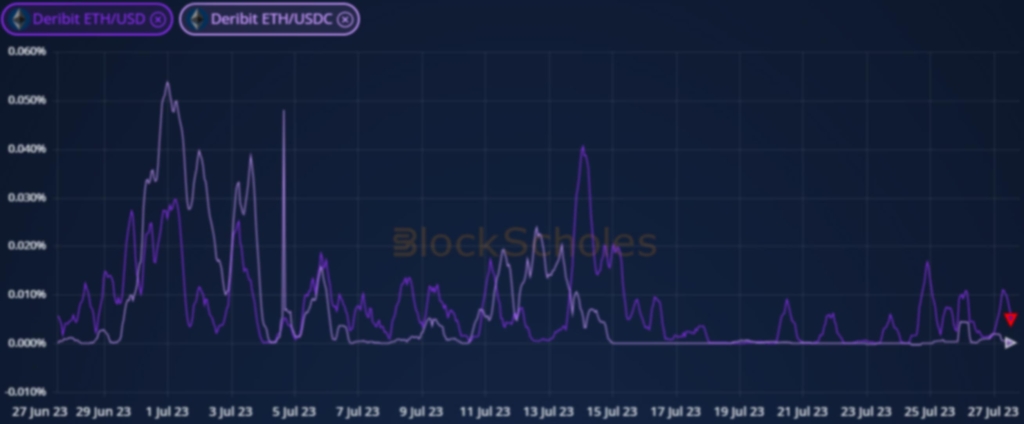
ETH FUNDING RATE – Similarly shows more activity in long positions once again as the funding rate rises high several times towards the end of the latest 7 -day period.
BTC Options

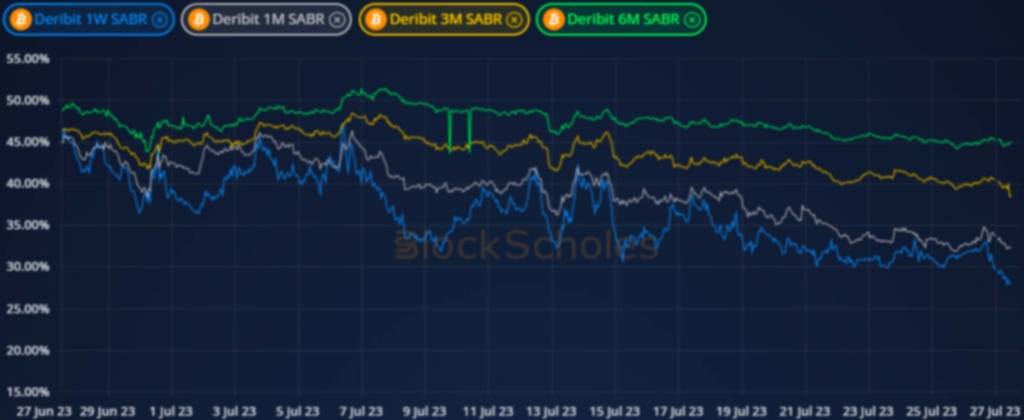
BTC SABR ATM IMPLIED VOLATILITY – Records fresh all-time lows at shorter tenors, trading consistently below 30%.
BTC 25-Delta Risk Reversal – Continues to trade in a tight range around 0% across the term structure, reflecting the neutral pricing of the vol smile.

ETH Options
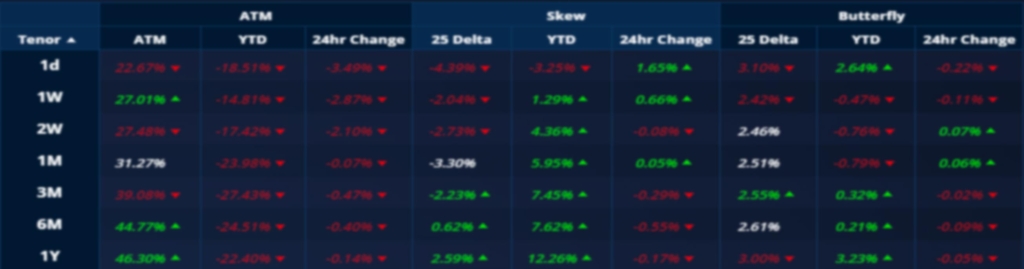
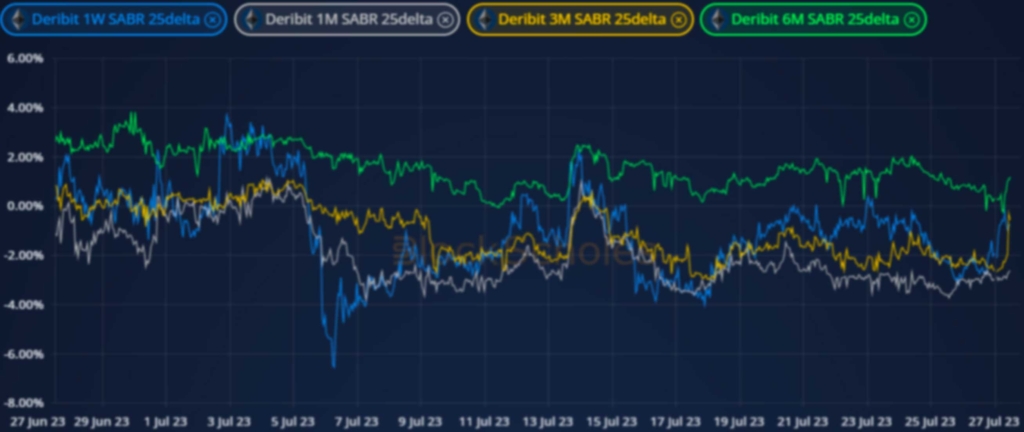
ETH SABR ATM IMPLIED VOLATILITY – Reaches new all-time lows in the high 20%s, with longer dated optionality implying a higher volatility.

ETH 25-Delta Risk Reversal – Spike towards neutral most recently after expressing a higher preference for downside protection for most of the week.
Volatility Surface
BTC IMPLIED VOL SURFACE – Blue cells across the board reflect the strength of the trend with which volatility has reached new all-time lows.
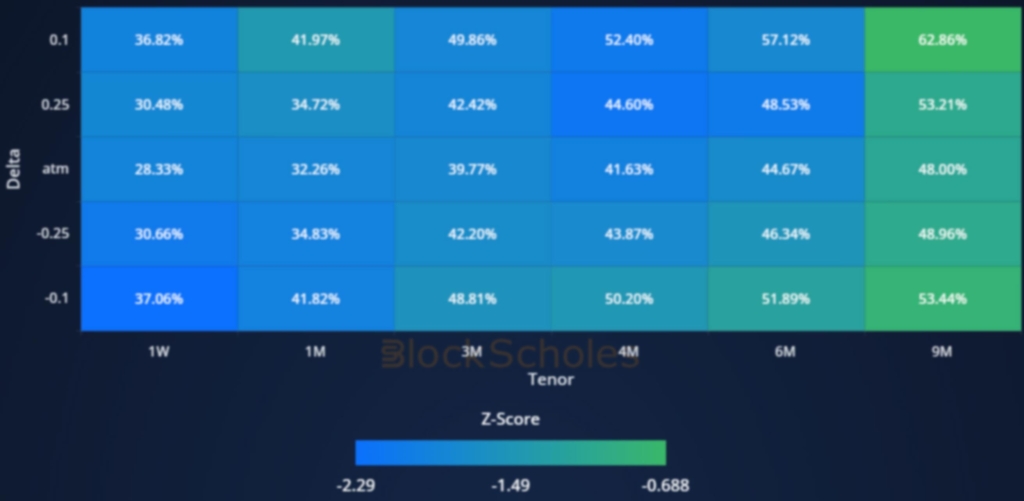
ETH IMPLIED VOL SURFACE – Whilst reflecting a similarly stark trend downwards for much of the volatility surface, shows a generally sideways trend at the 9M tenor.

Z-Score calculated with respect to the distribution of implied volatility of an option at a given delta and tenor over the previous 30-days of hourly data, timestamp 10:00 UTC, SABR smile calibration.
Volatility Smiles
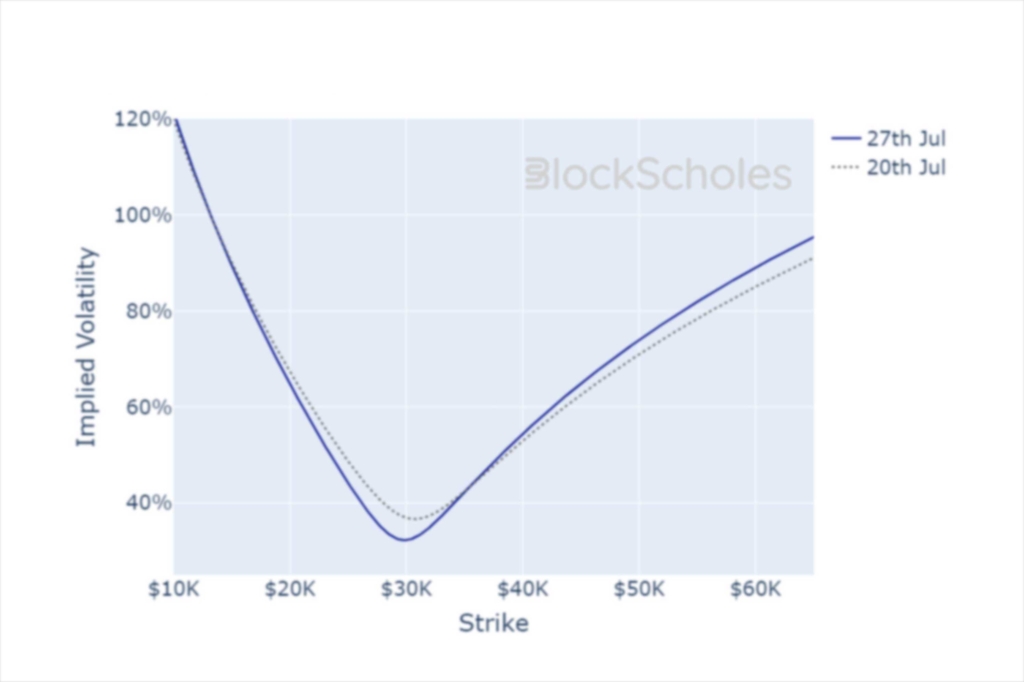
BTC SMILE CALIBRATIONS – 25-Aug-2023 Expiry, 10:17 UTC Snapshot.

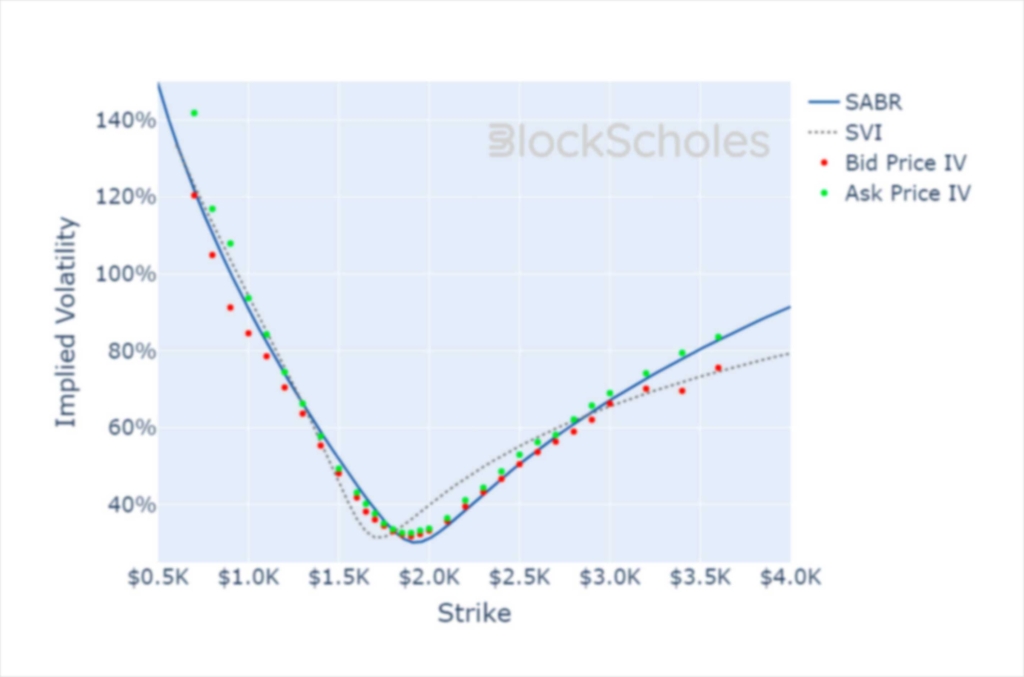
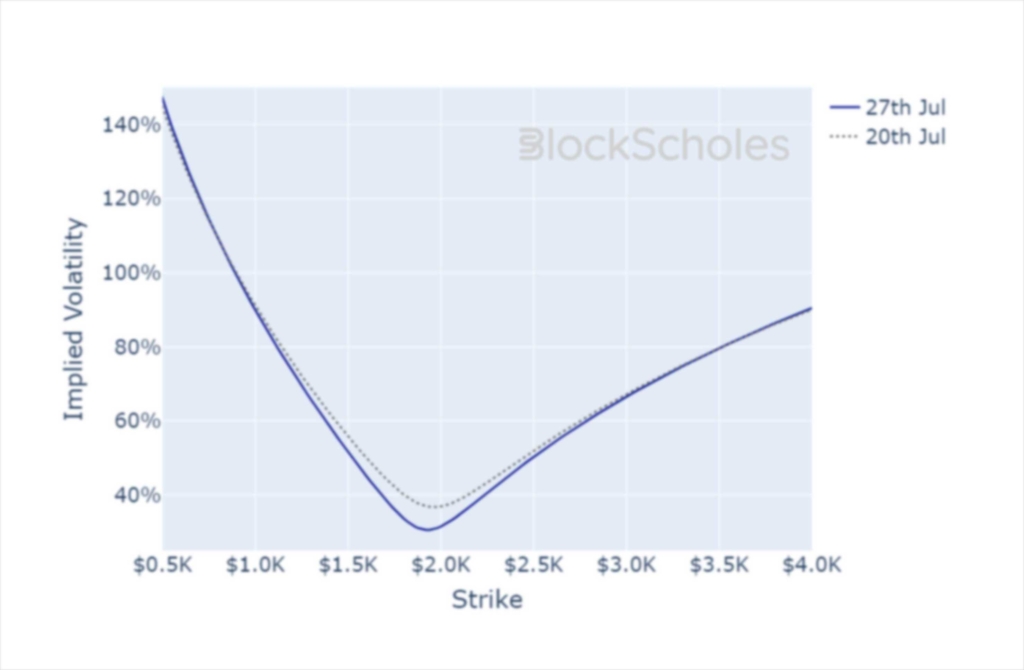
ETH SMILE CALIBRATIONS – 25-Aug-2023 Expiry, 10:17 UTC Snapshot.
Historical SABR Volatility Smiles
BTC SABR CALIBRATION – 30 Day Tenor, 10:17 UTC Snapshot.
ETH SABR CALIBRATION – 30 Day Tenor, 10:17 UTC Snapshot.
AUTHOR(S)
Trading with a competitive edge. Providing robust quantitative modelling and pricing engines across crypto derivatives and risk metrics.