
Weekly recap of the crypto derivatives markets by BlockScholes.
Key Insights:
Implied volatility has arrested its tumble following an increase in realised volatility over the last seven days. It now trades between 25% and 40% across the term structures of both majors. The skew towards puts sharpened in the hours before the downside action in the last 24H and has stayed tilted towards OTM puts. Whilst funding rate still refuses to turn negative, we did see a temporary curtailment of the high positive rates that short positions have been collecting throughout the last month
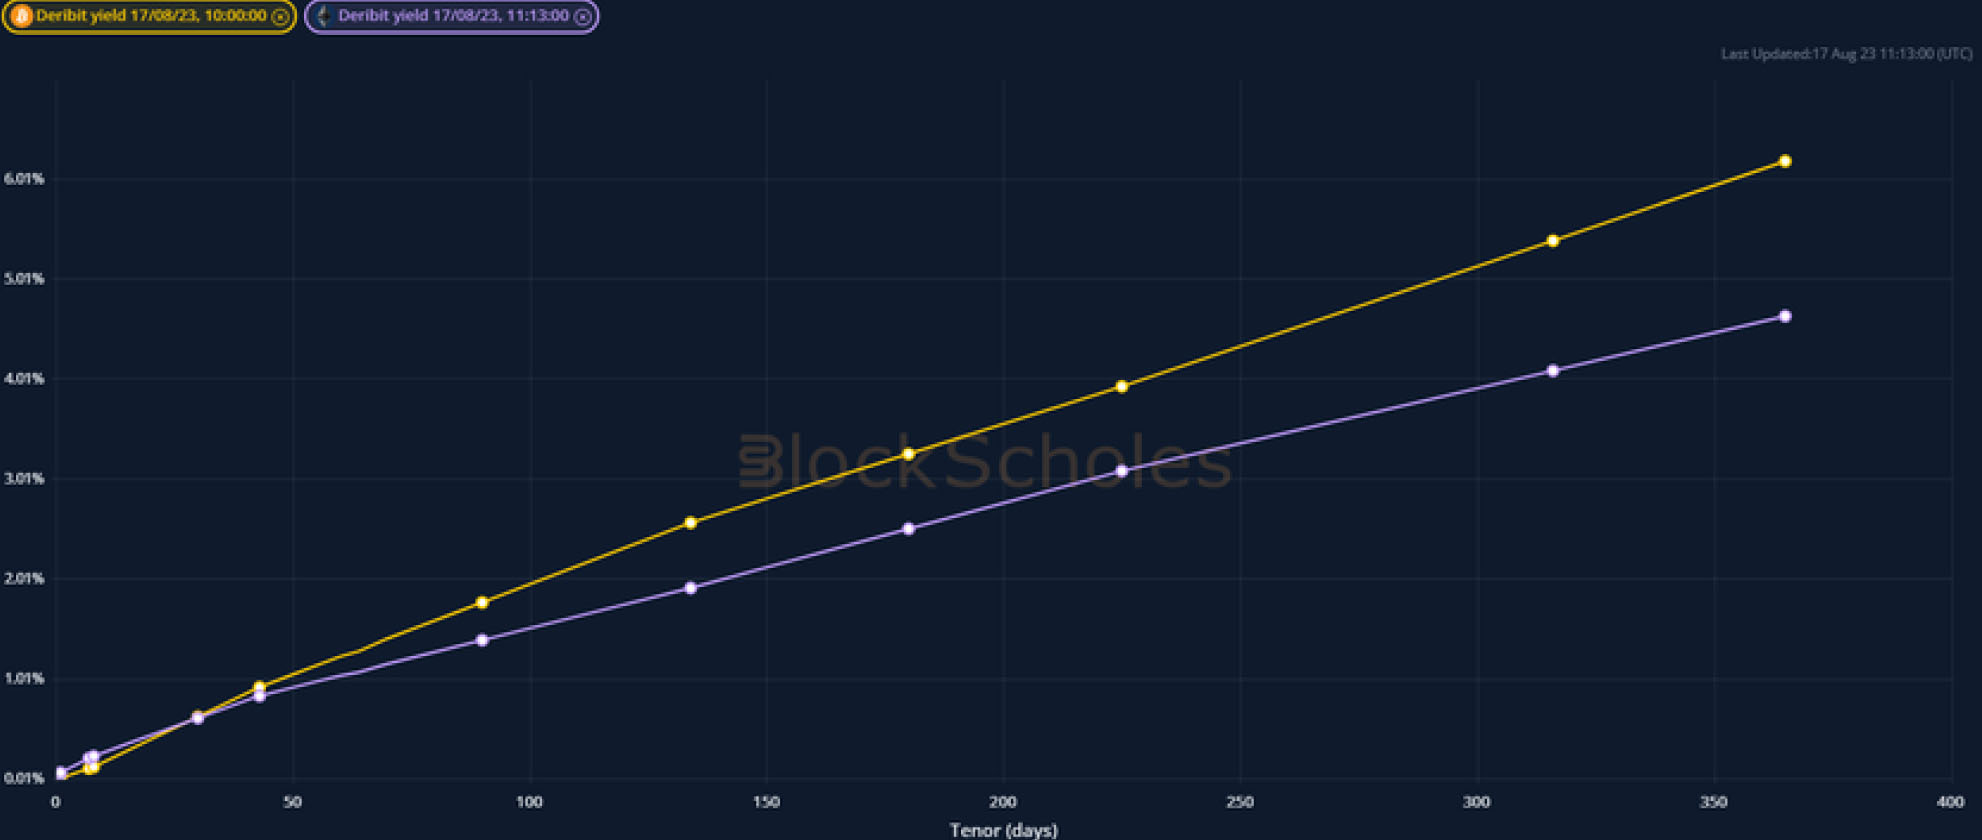
Futures implied yield term structure.
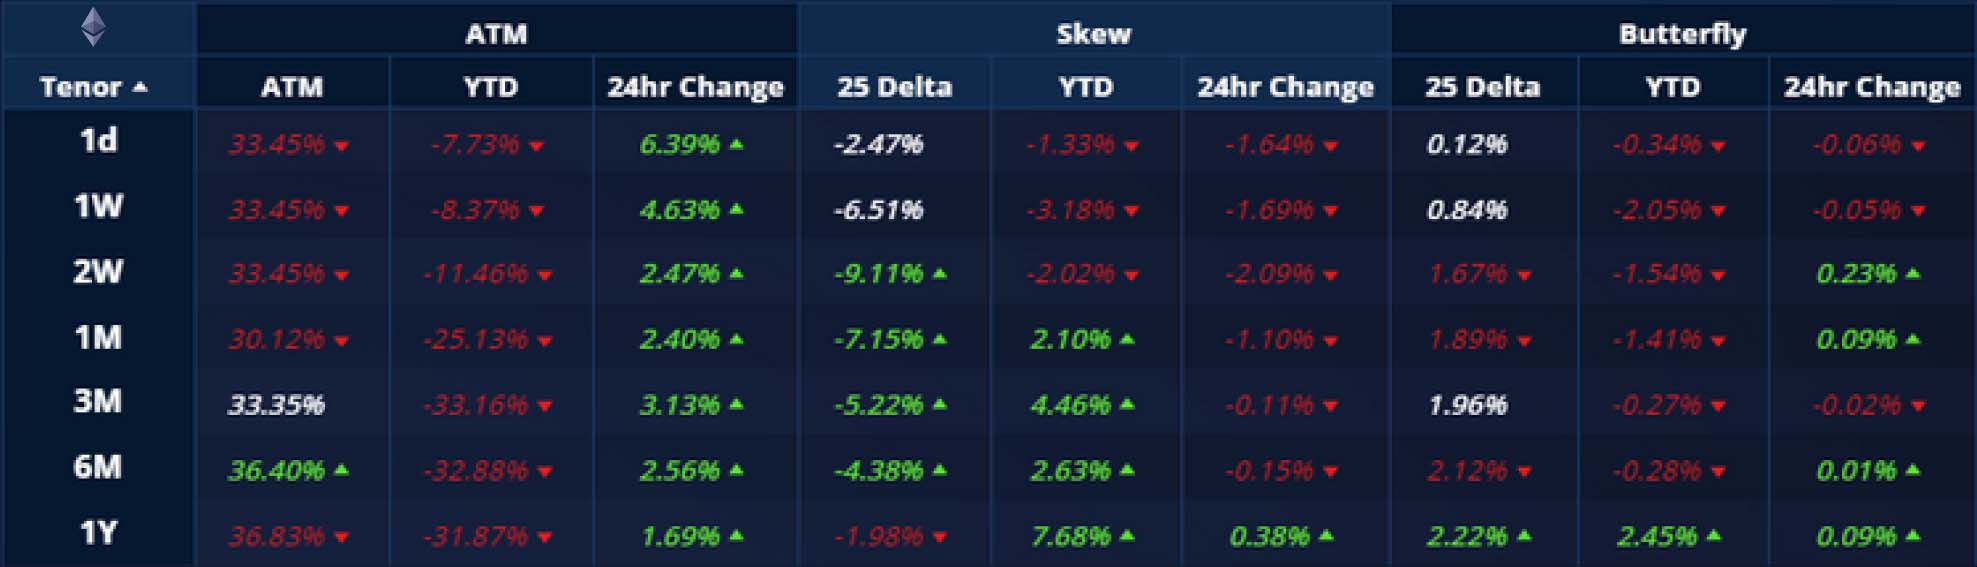
Volatility Surface Metrics.

*All data in tables recorded at a 10:20 UTC snapshot unless otherwise stated.
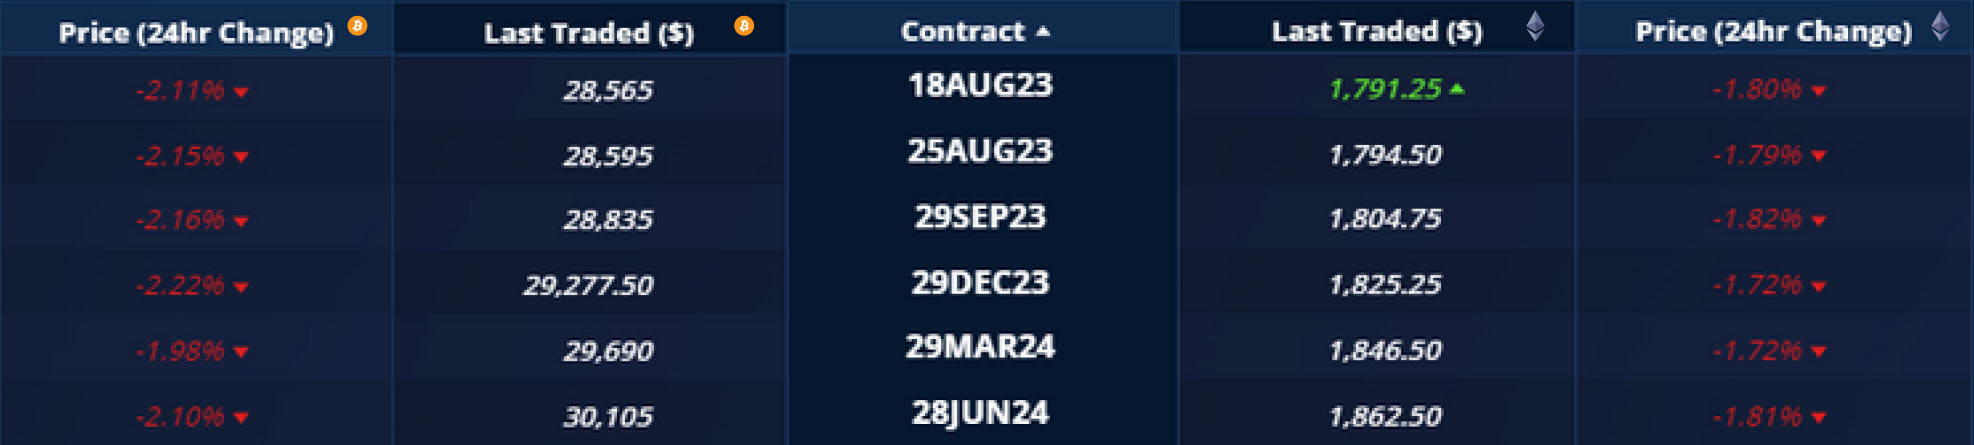
Futures
BTC ANNUALISED YIELDS – Are positive and inverted, with the entire term structure trading between 6% and 8% at an annualised rate.
ETH ANNUALISED YIELDS – Continue at their higher levels, with short tenor futures rising as high as 12% above spot at an annualised rate.
Perpetual Swap Funding Rate
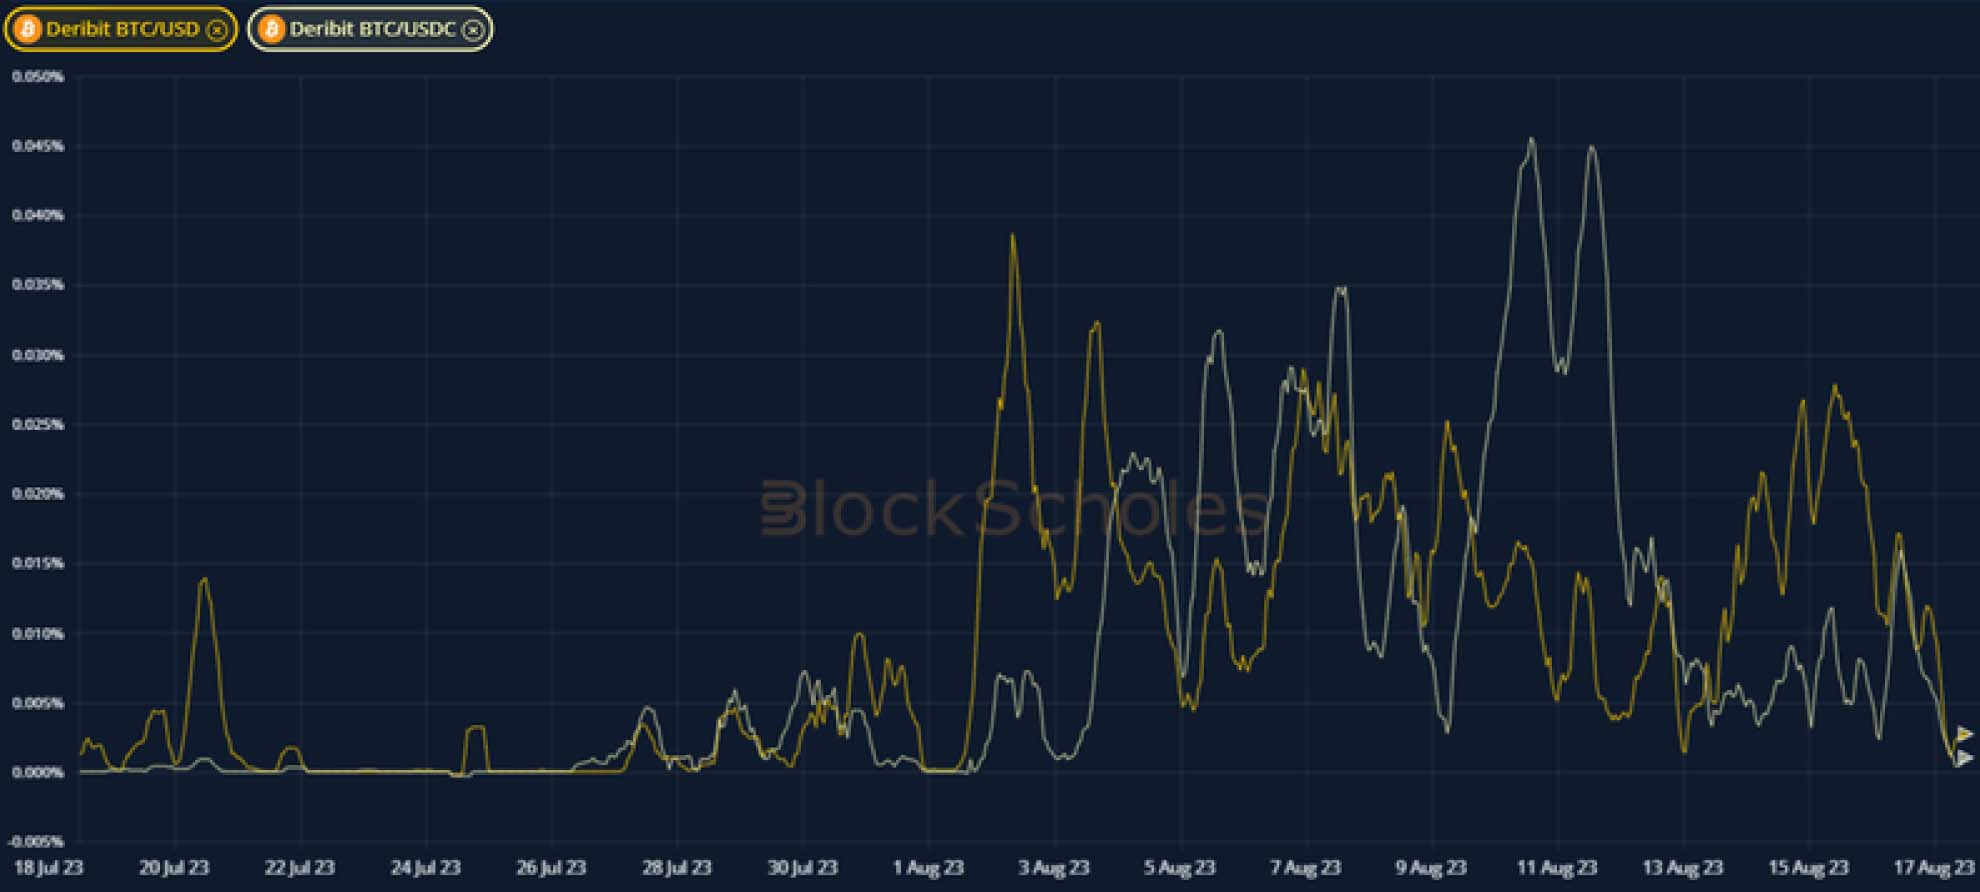
BTC FUNDING RATE – Has remained high throughout the week, tailing off during the spot selloff in the last 24H.
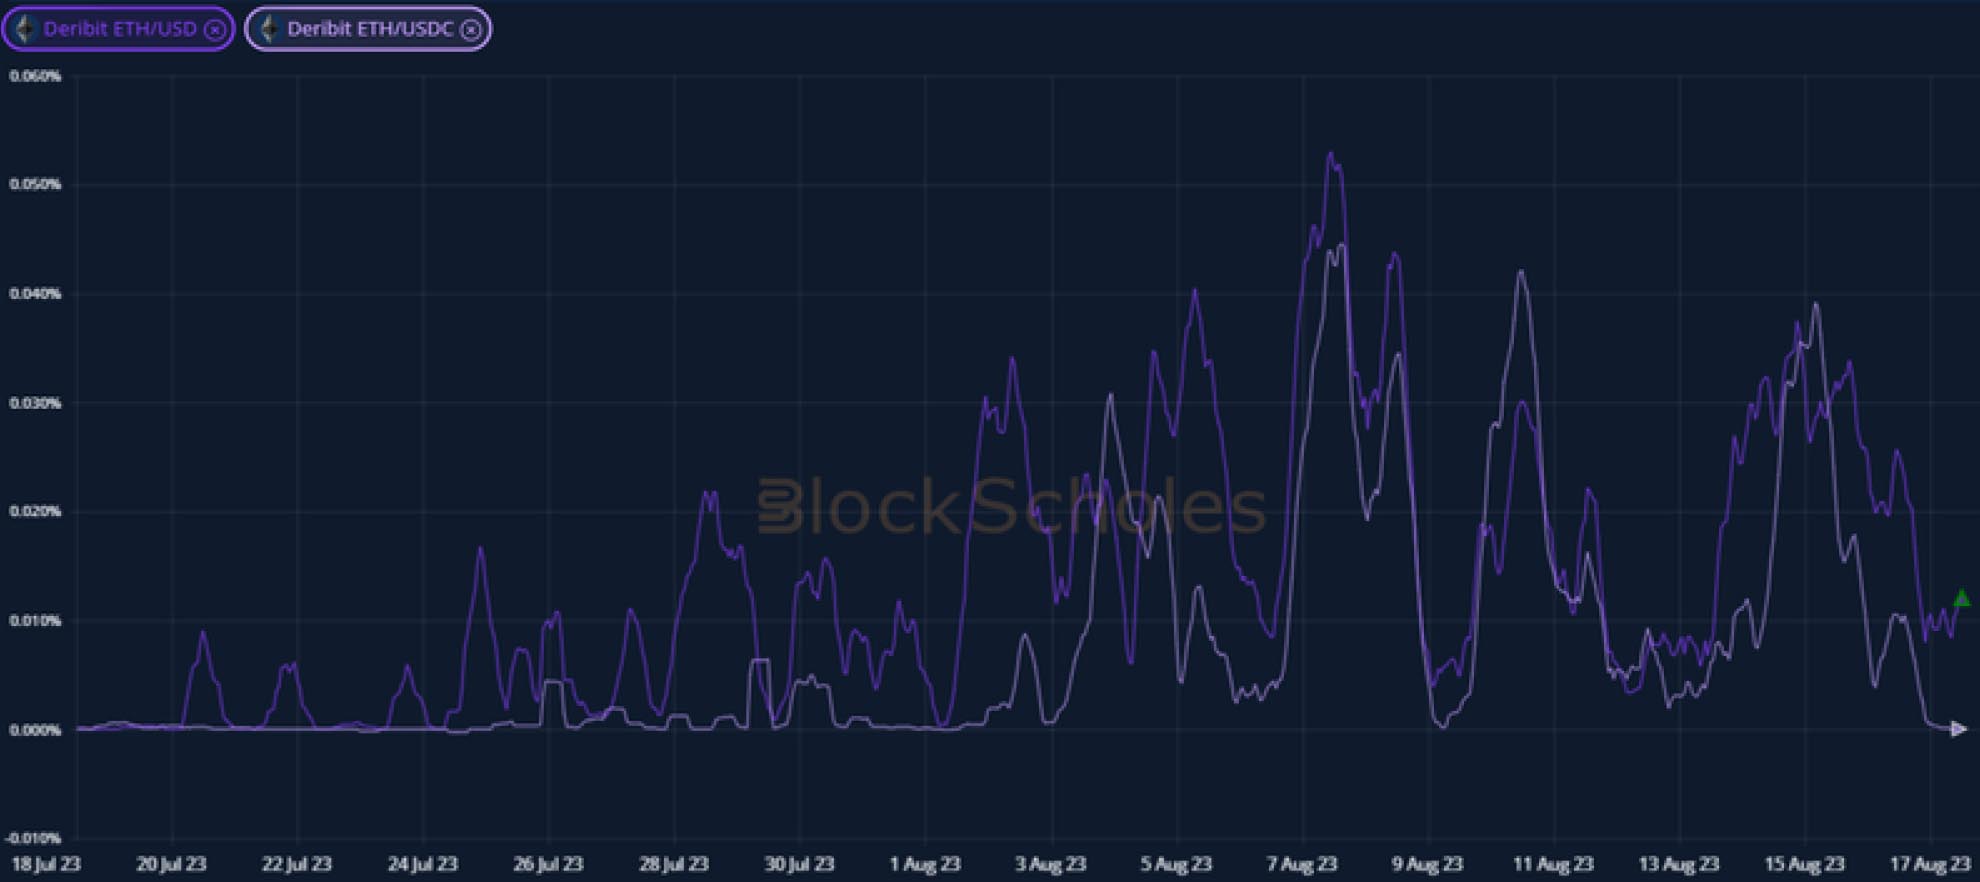
ETH FUNDING RATE – Remains positive despite the spot market selloff, at lower levels than seen earlier in the week.
BTC Options

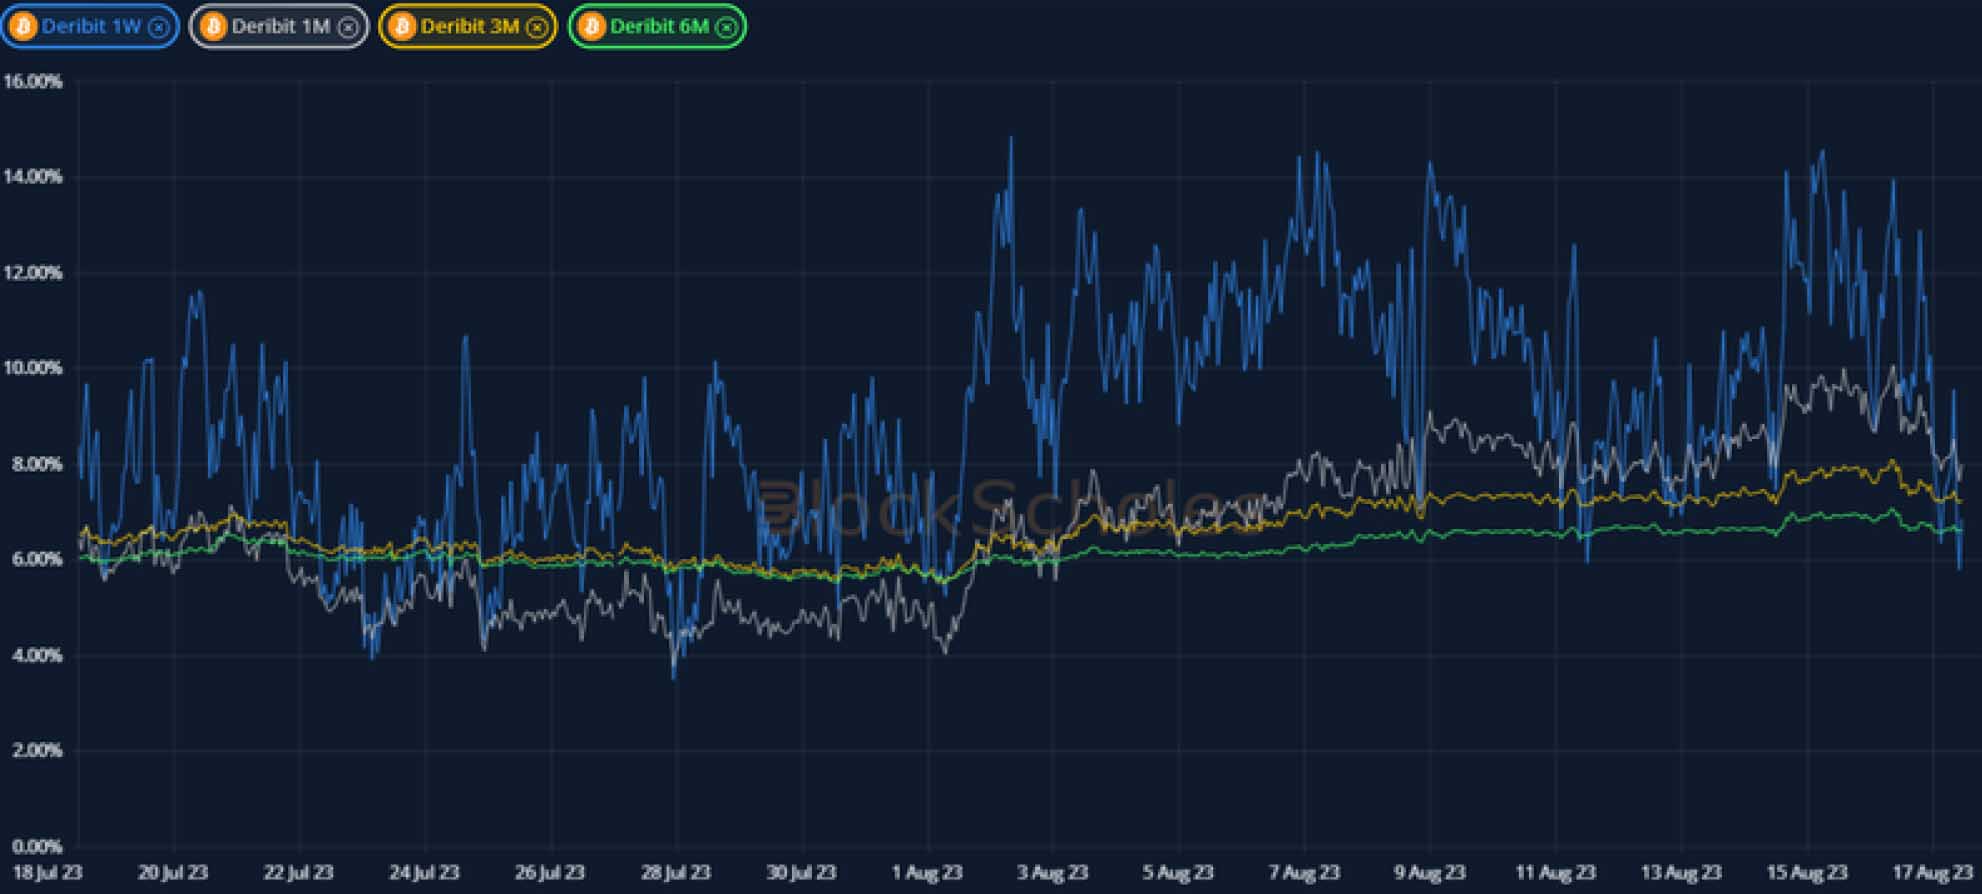
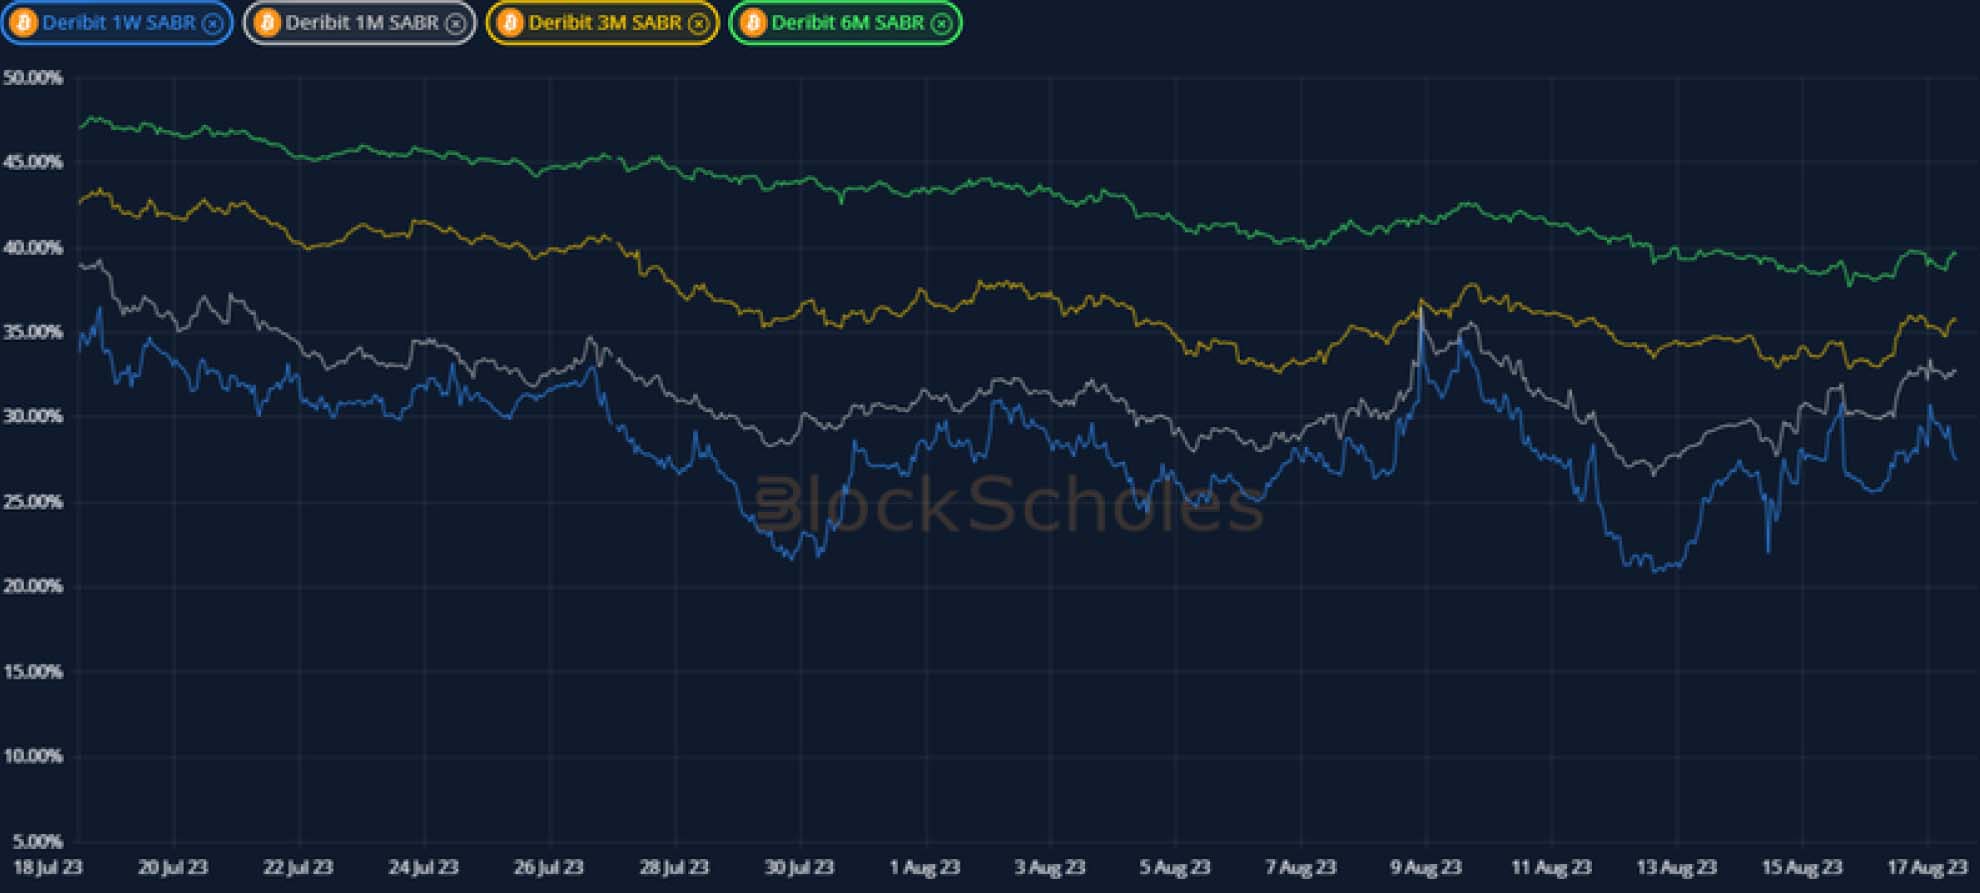
BTC SABR ATM IMPLIED VOLATILITY – Has continued to oscillate between 20-40% across the term structure, tracking changes in realised volatility.
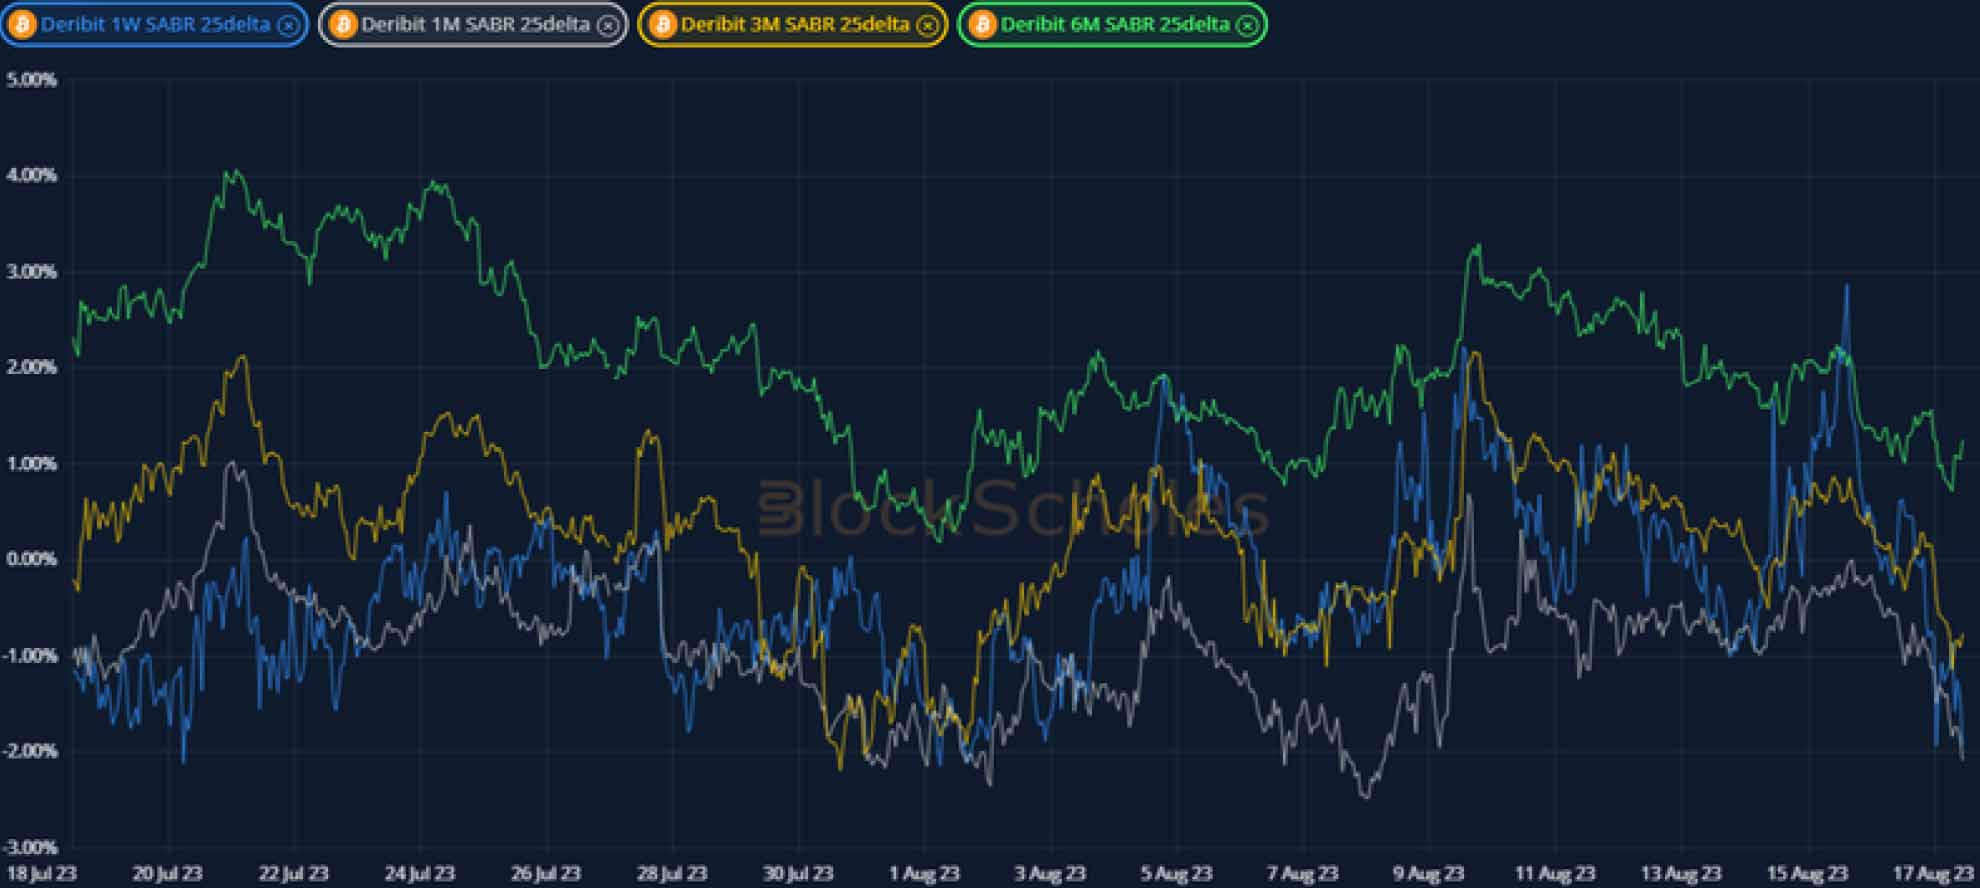
BTC 25-Delta Risk Reversal – Fell decisively ahead of the selloff in spot prices in the last 24H.
ETH Options

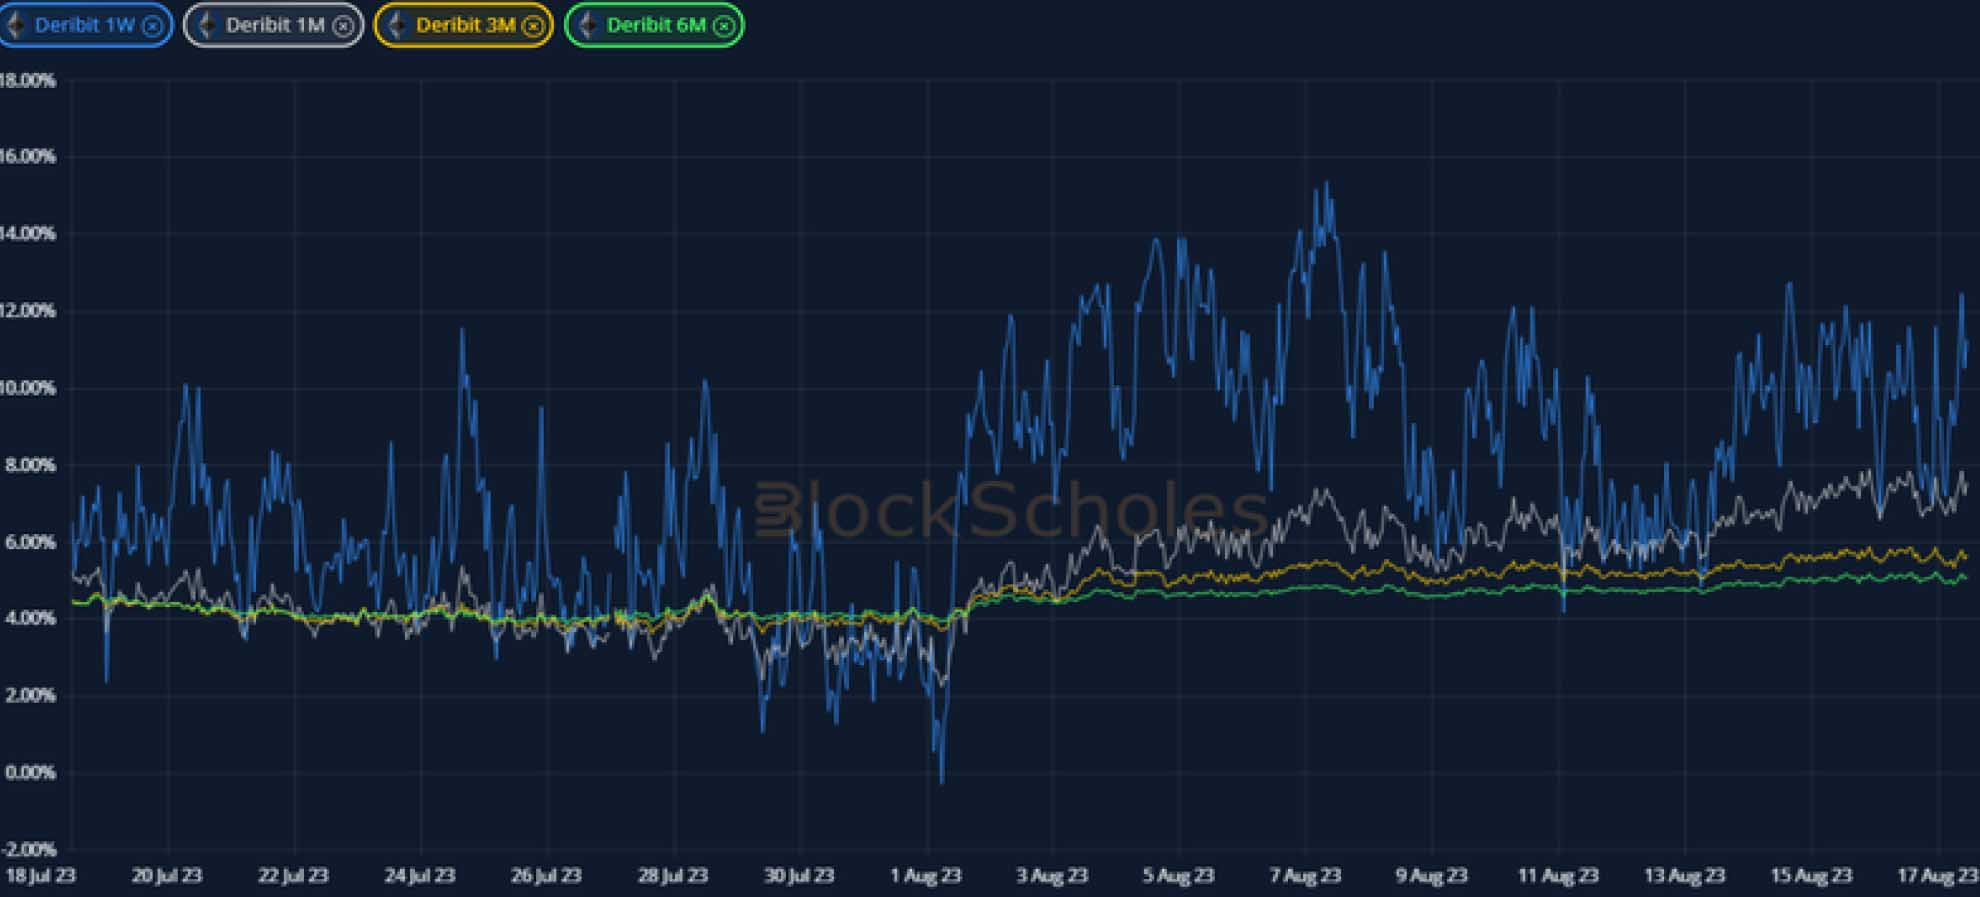
ETH SABR ATM IMPLIED VOLATILITY – Has traded sideways over the past week across all tenors, some 4 vol points below BTC’s.

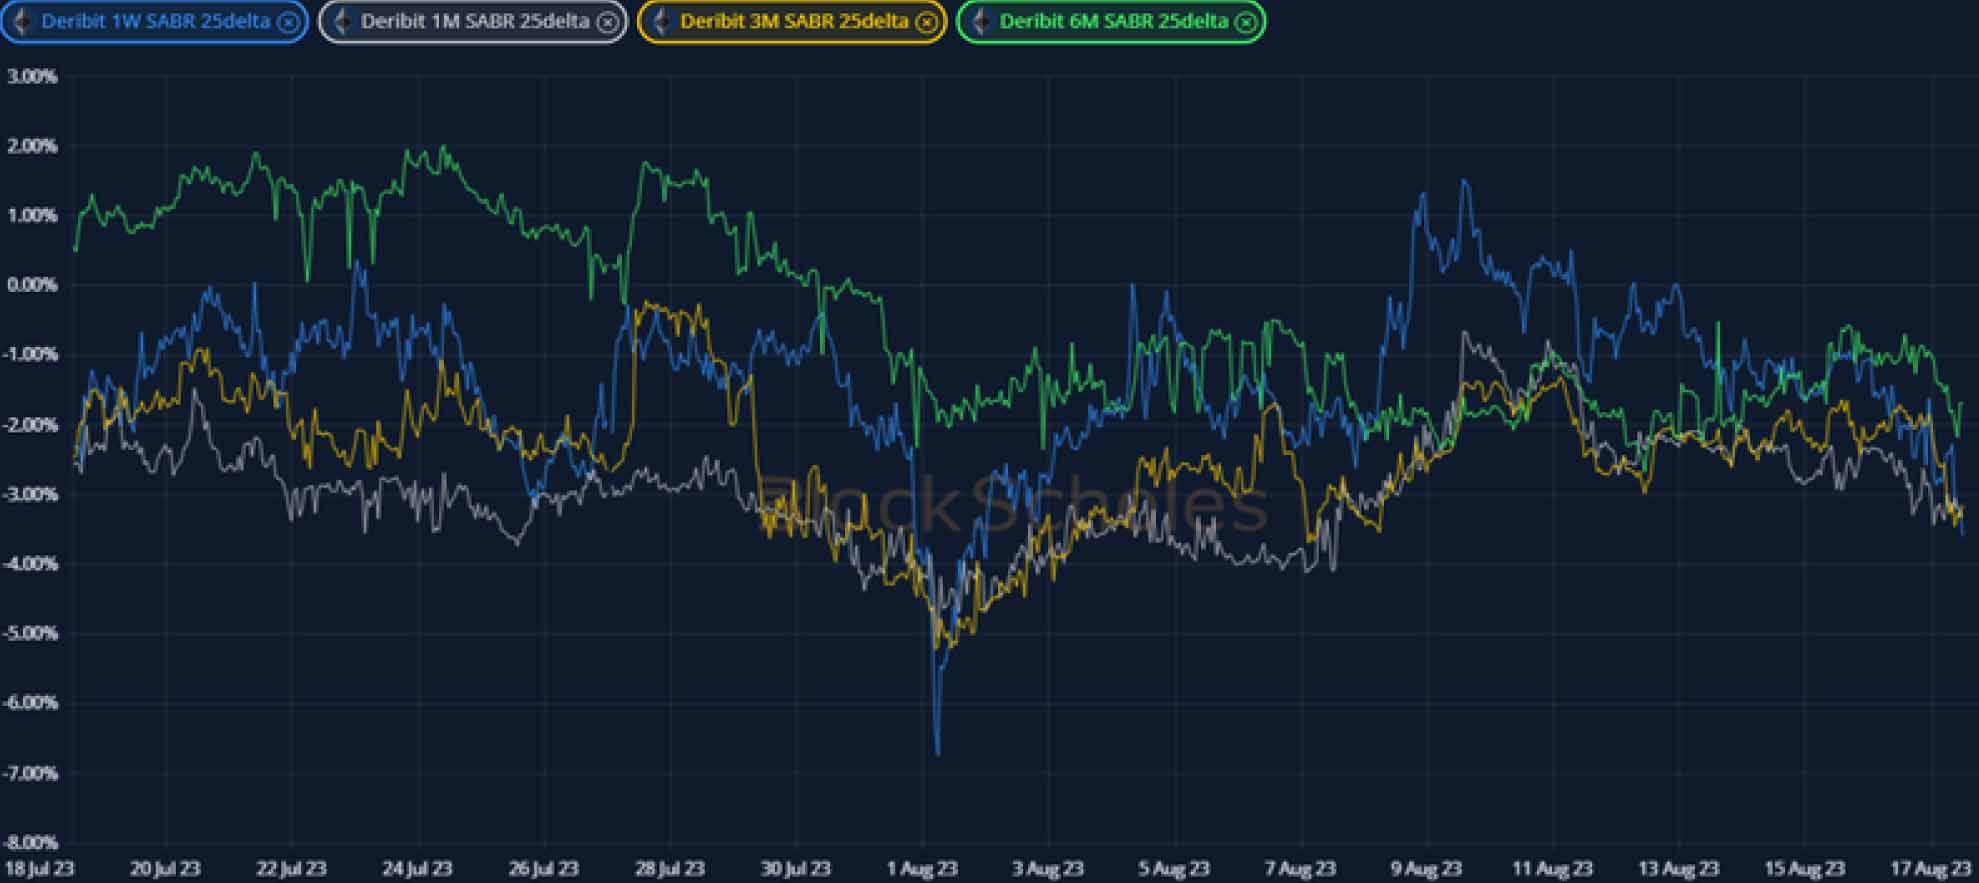
ETH 25-Delta Risk Reversal – Have trended in a similarly downwards direction during the selloff from an already skewed starting point.
Volatility Surface
BTC IMPLIED VOL SURFACE – Shows that the pickup in implied volatility this week has been strongest in the front end of the term structure as longer-dated implied vols continue to cool.

ETH IMPLIED VOL SURFACE – Shows much less of an increase in near- term implied volatilities than BTC’s surface.

Z-Score calculated with respect to the distribution of implied volatility of an option at a given delta and tenor over the previous 30-days of hourly data, timestamp 10:00 UTC, SABR smile calibration.
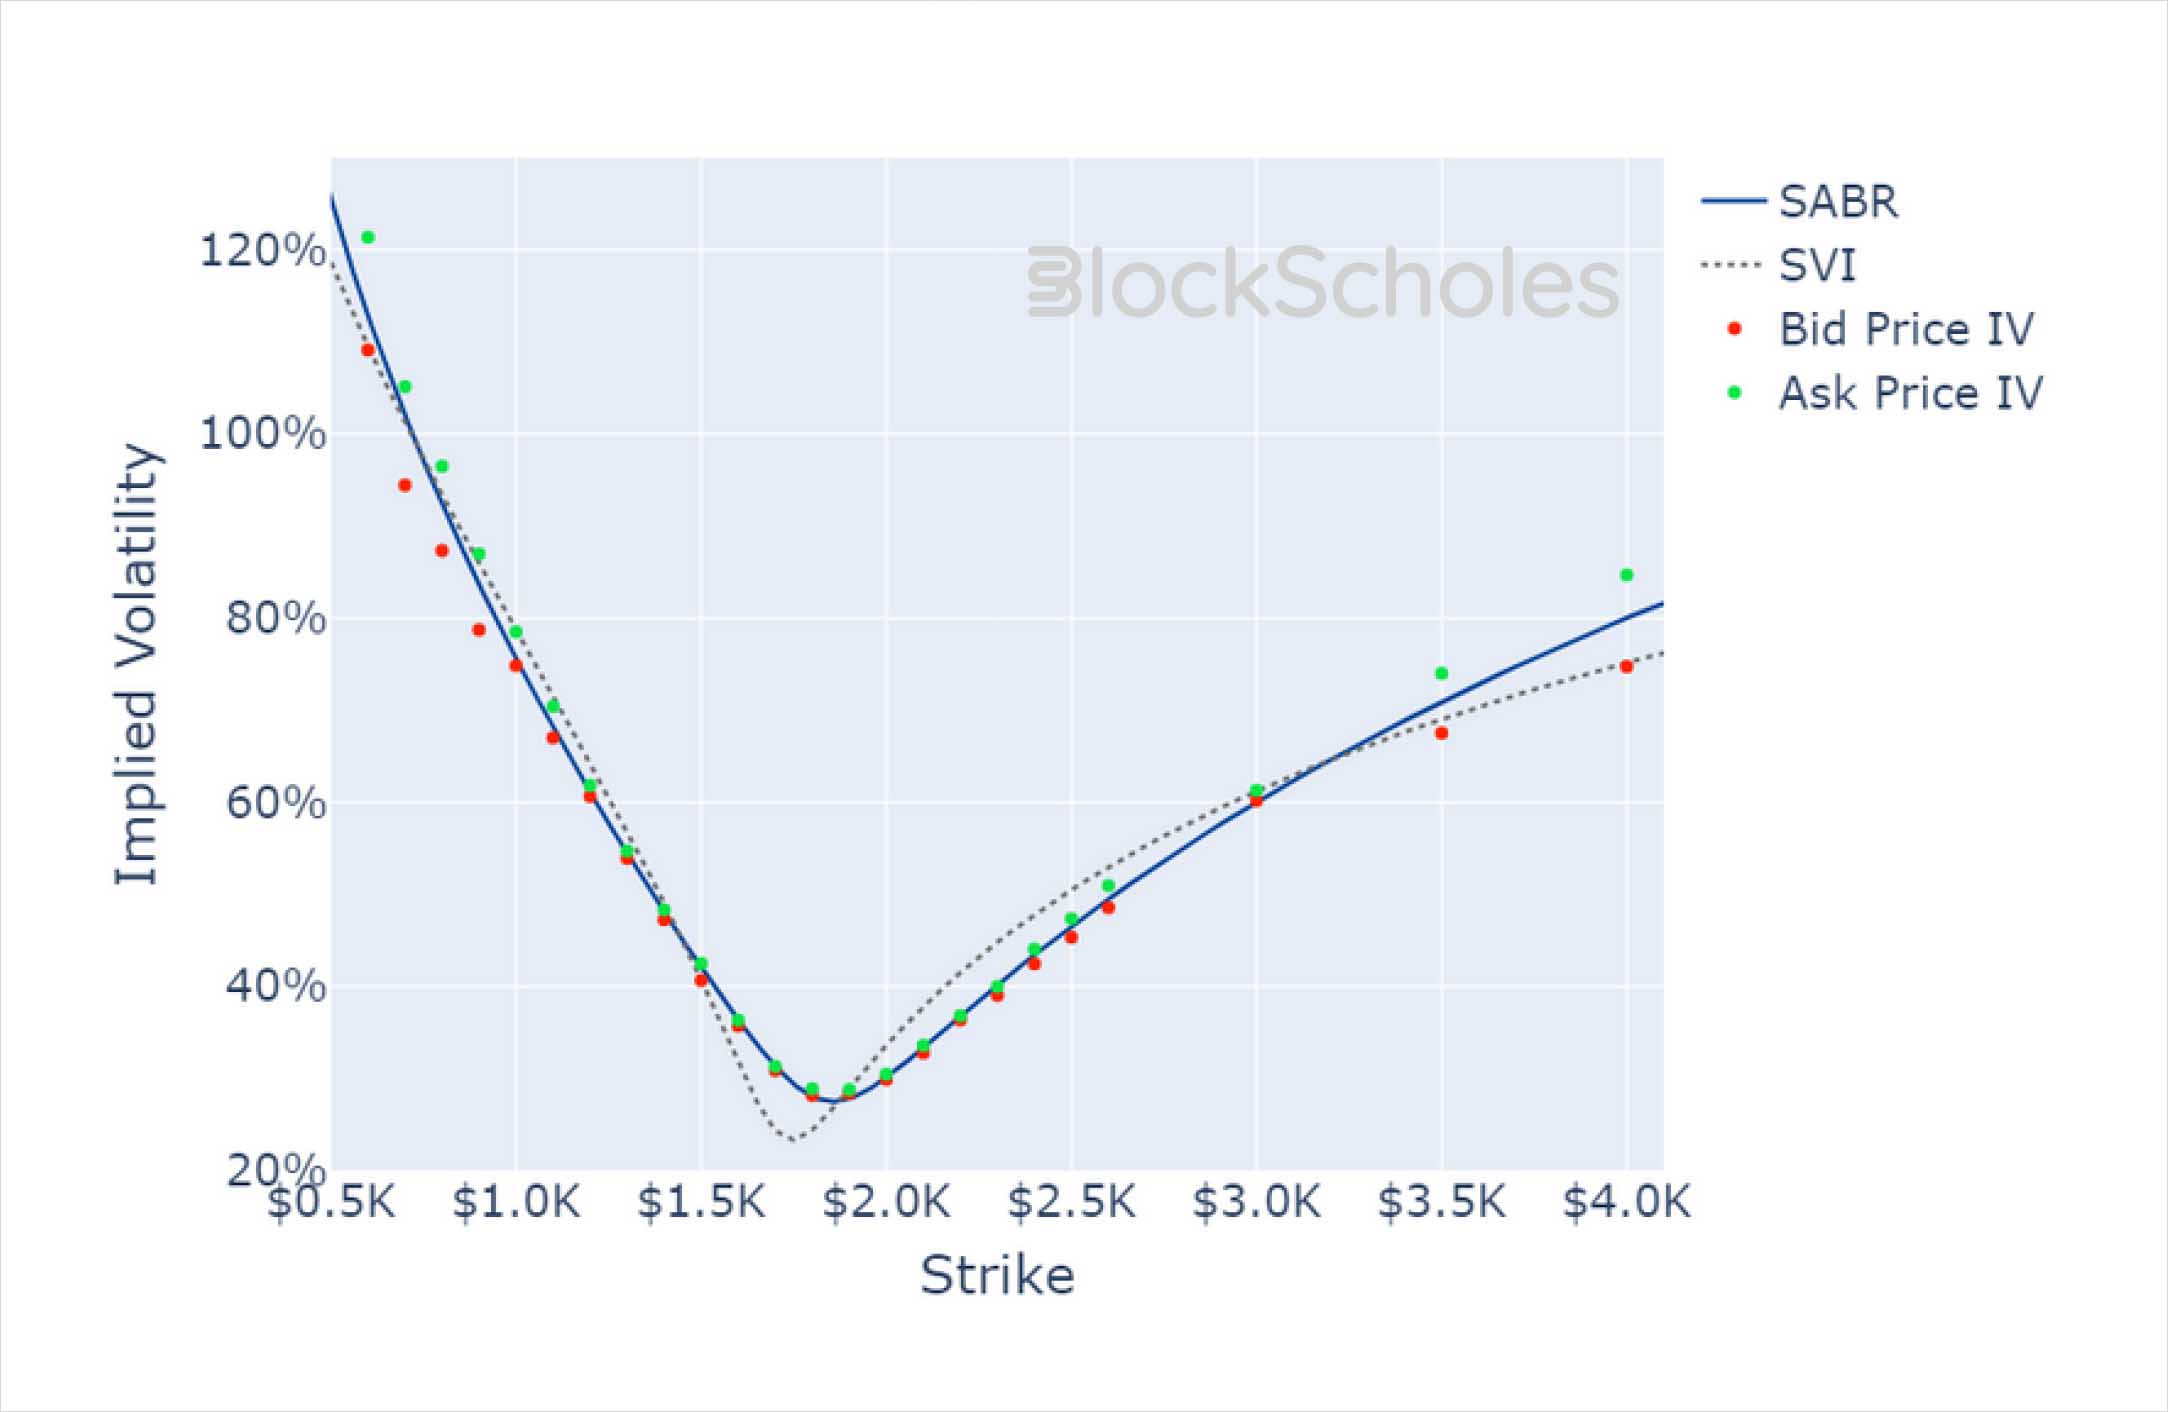
Volatility Smiles
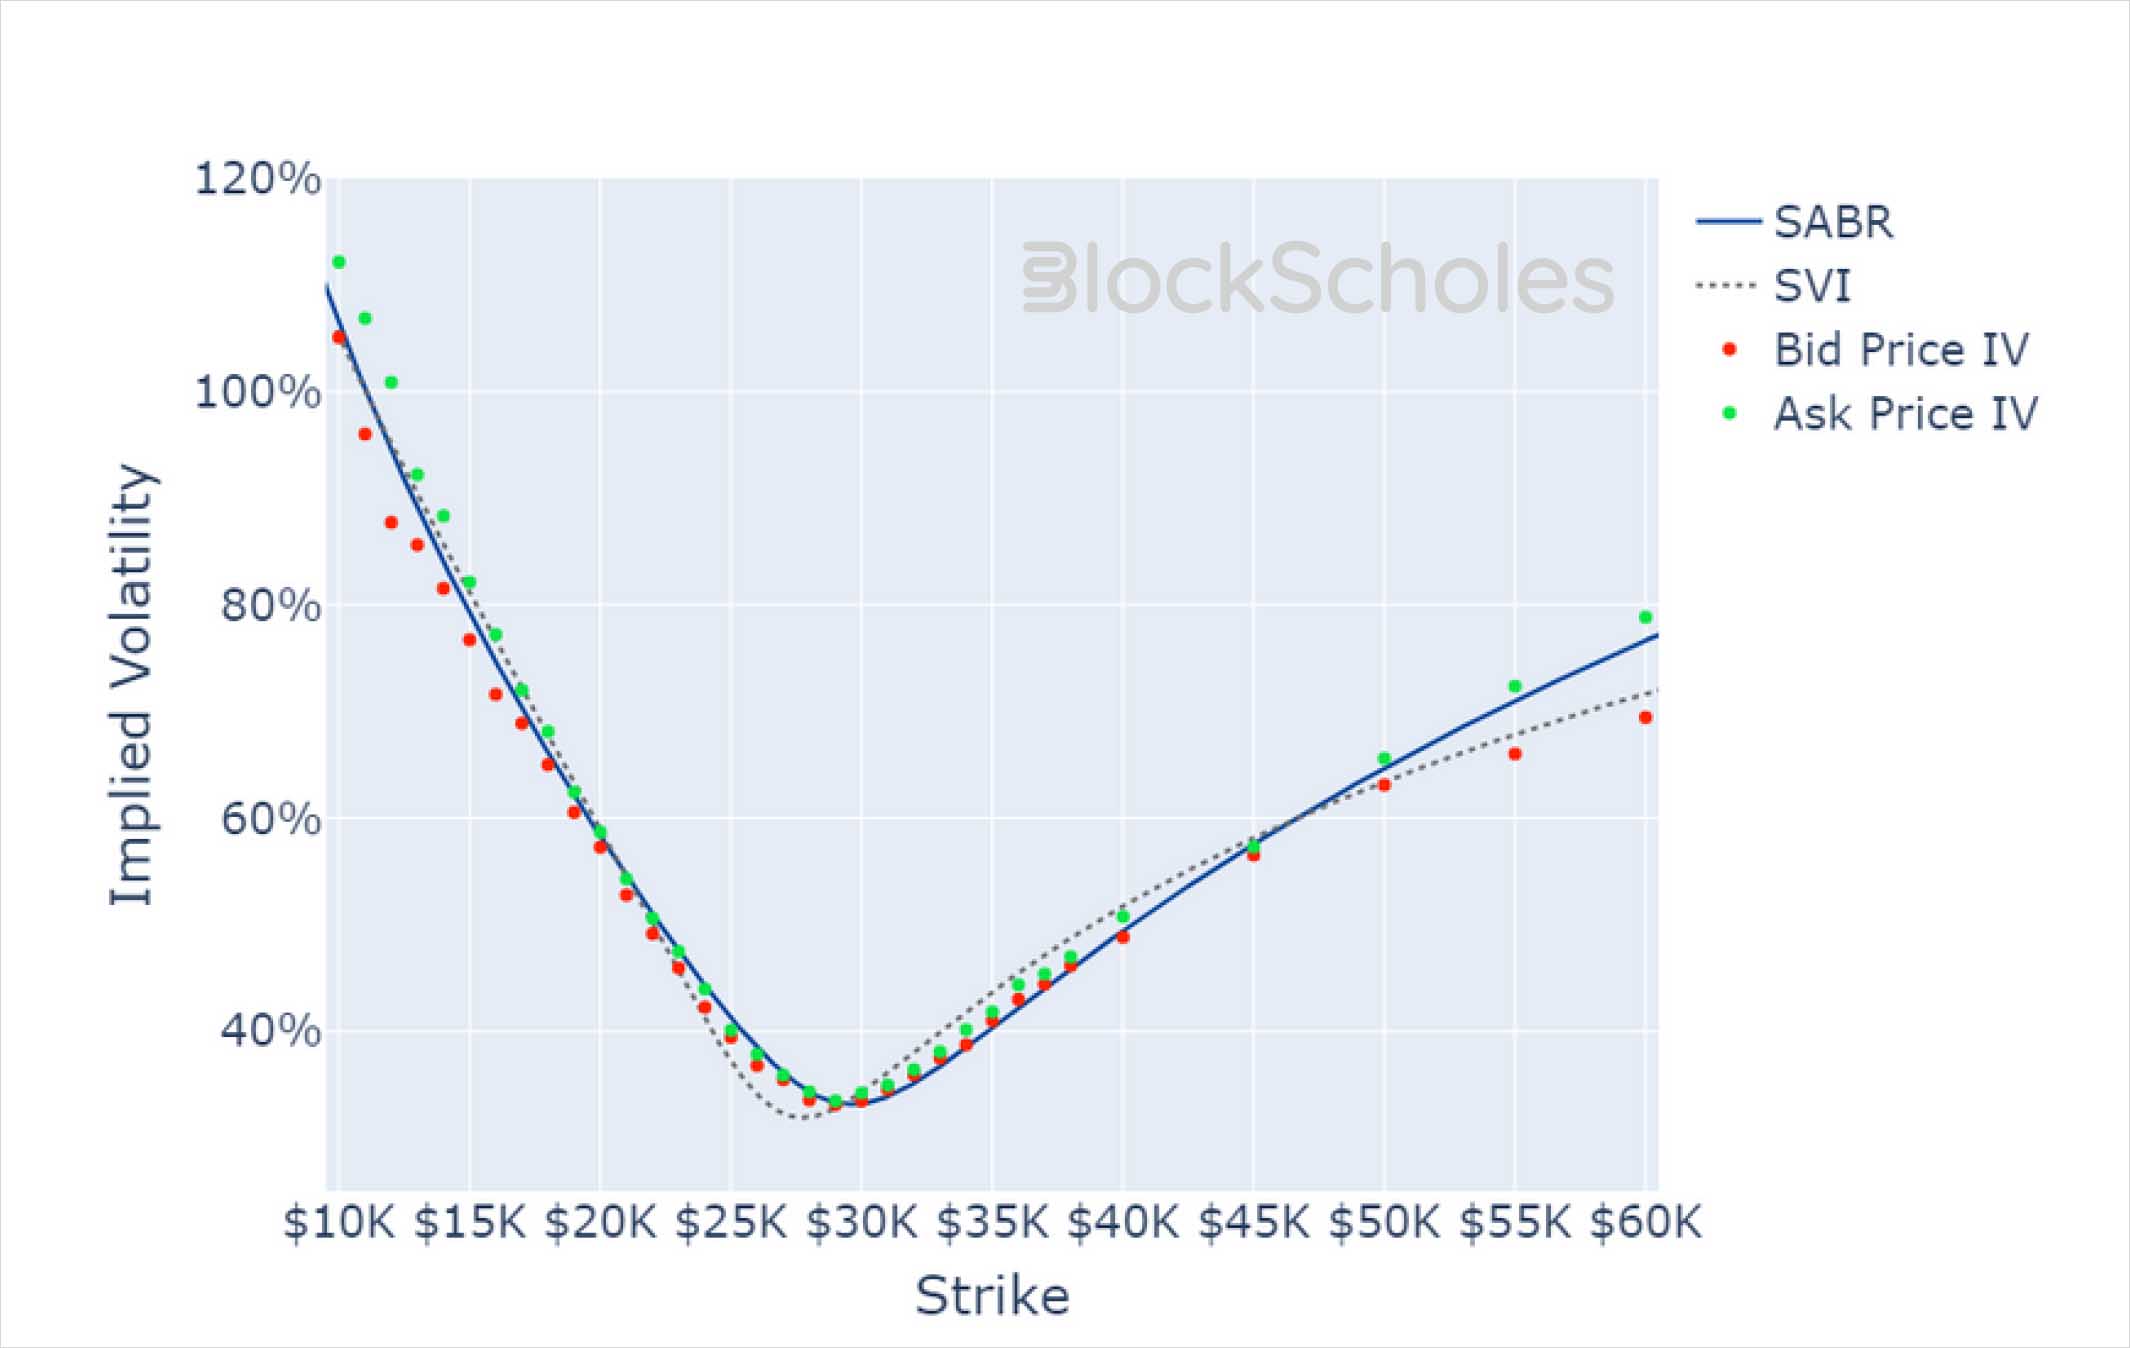
BTC SMILE CALIBRATIONS – 29-Sep-2023 Expiry, 10:20 UTC Snapshot.
ETH SMILE CALIBRATIONS – 29-Sep-2023 Expiry, 10:20 UTC Snapshot.
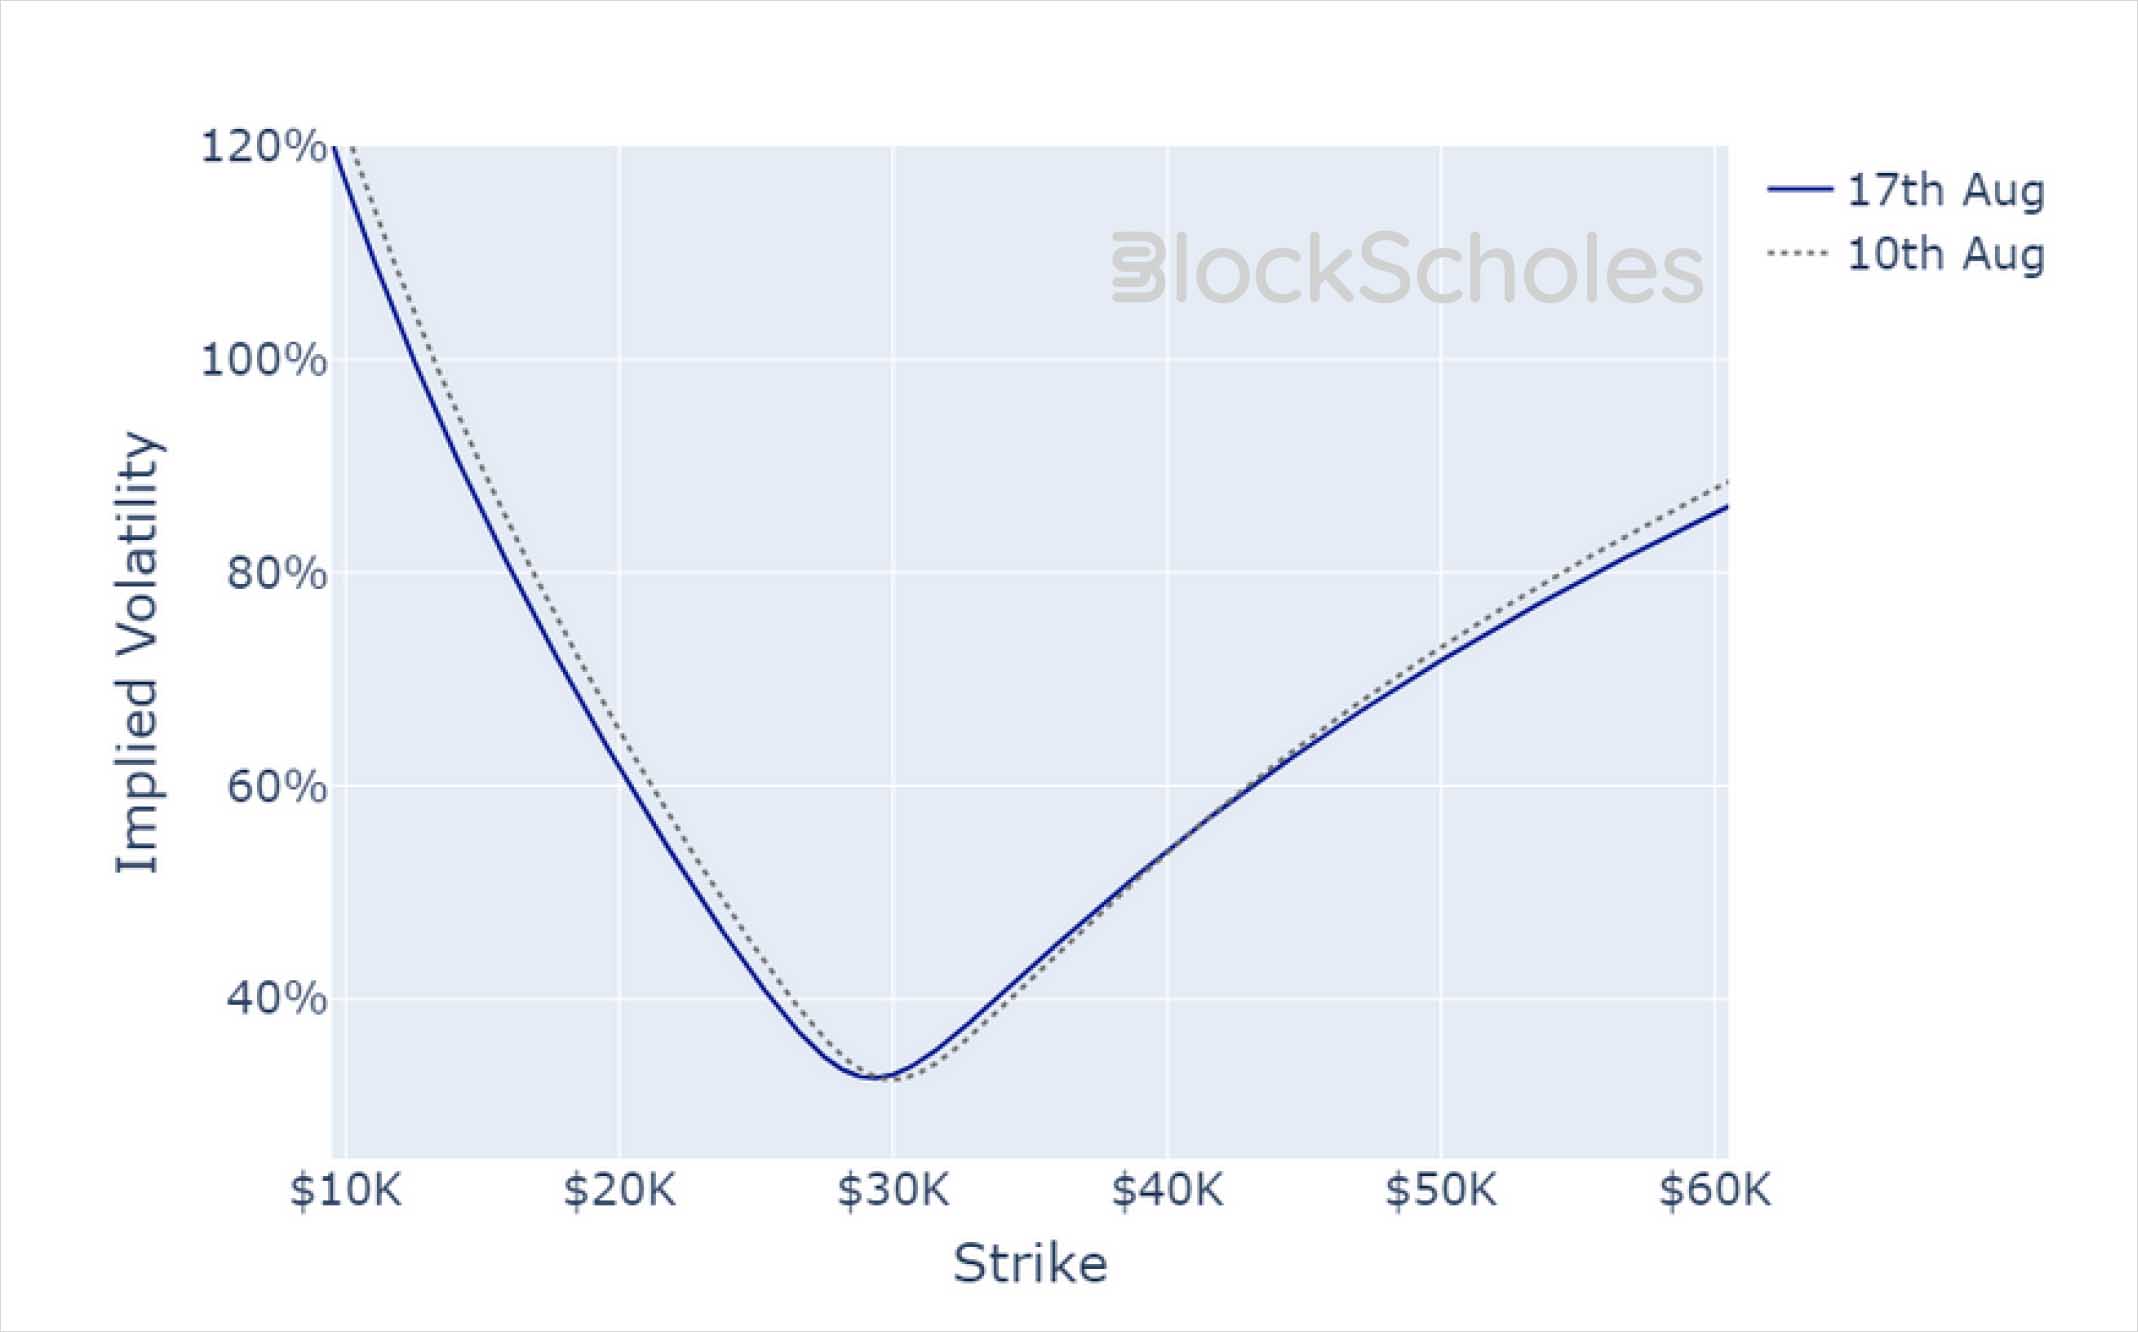
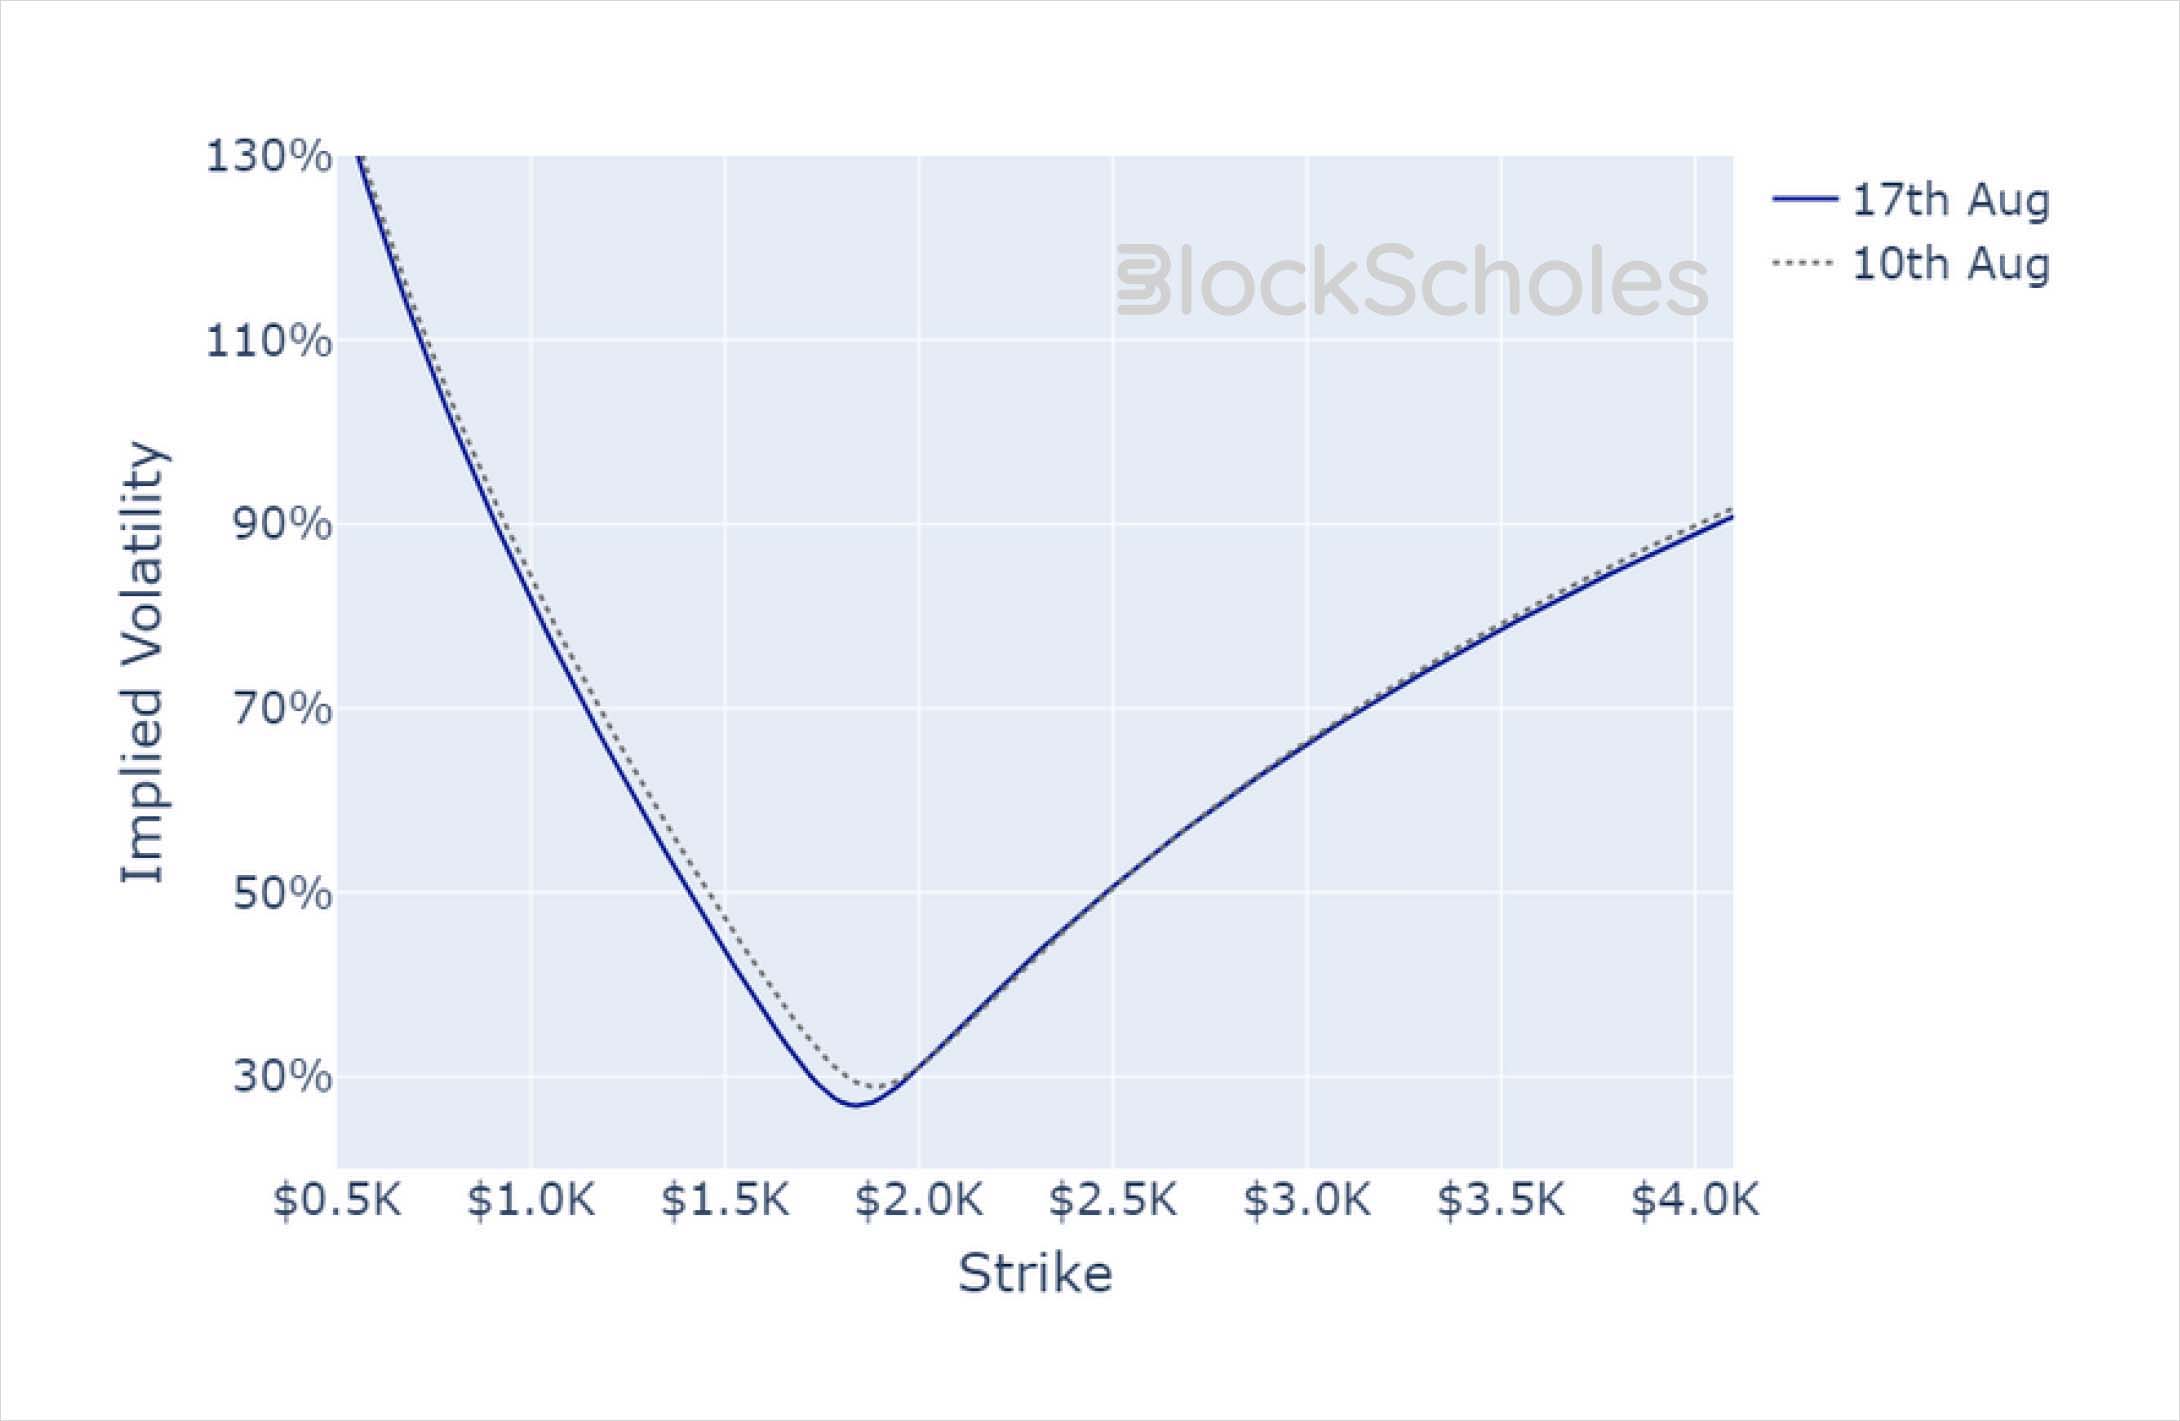
Historical SABR Volatility Smiles
BTC SABR CALIBRATION – 30 Day Tenor, 10:00 UTC Snapshot.
ETH SABR CALIBRATION – 30 Day Tenor, 10:00 UTC Snapshot.
AUTHOR(S)
Trading with a competitive edge. Providing robust quantitative modelling and pricing engines across crypto derivatives and risk metrics.