
Weekly recap of the crypto derivatives markets by BlockScholes.
Key Insights:
Last Thursday’s selloff in the spot prices of BTC and ETH resulted in another underwhelming pickup in their at-the-money implied volatility, rising only to levels last seen as recently as early July. The volatility smiles of both assets skewed sharply towards puts – more so for ETH than BTC – but have since recovered to a slight tilt towards calls for BTC and a neutral pricing for ETH. We also saw a long-held positive funding rate turn swiftly negative, before trading sideways in the week since the selloff.
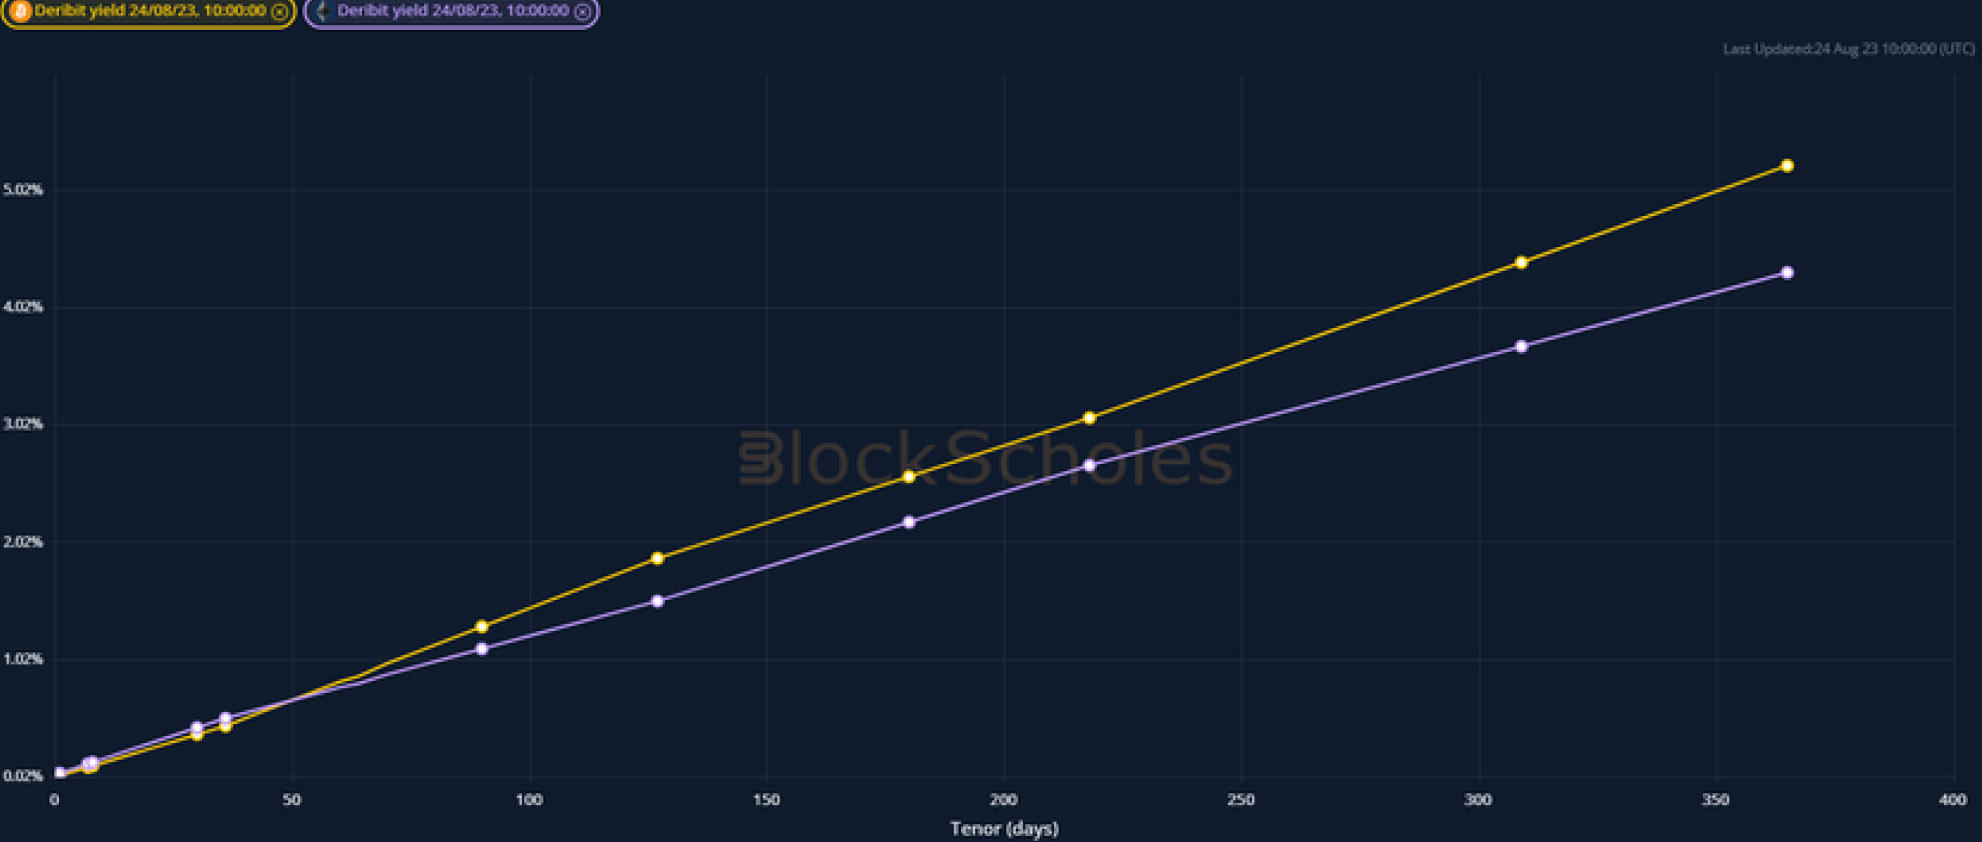
Futures implied yield term structure.
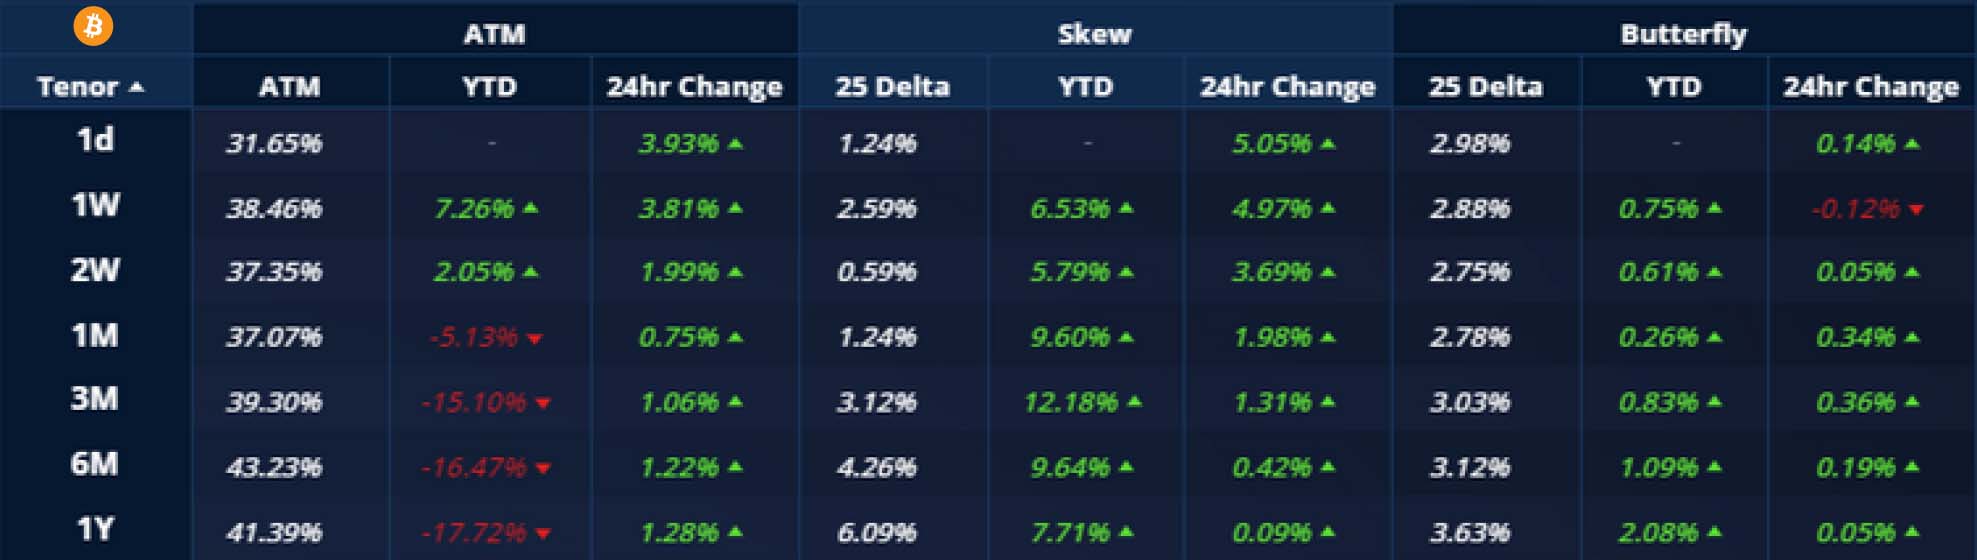
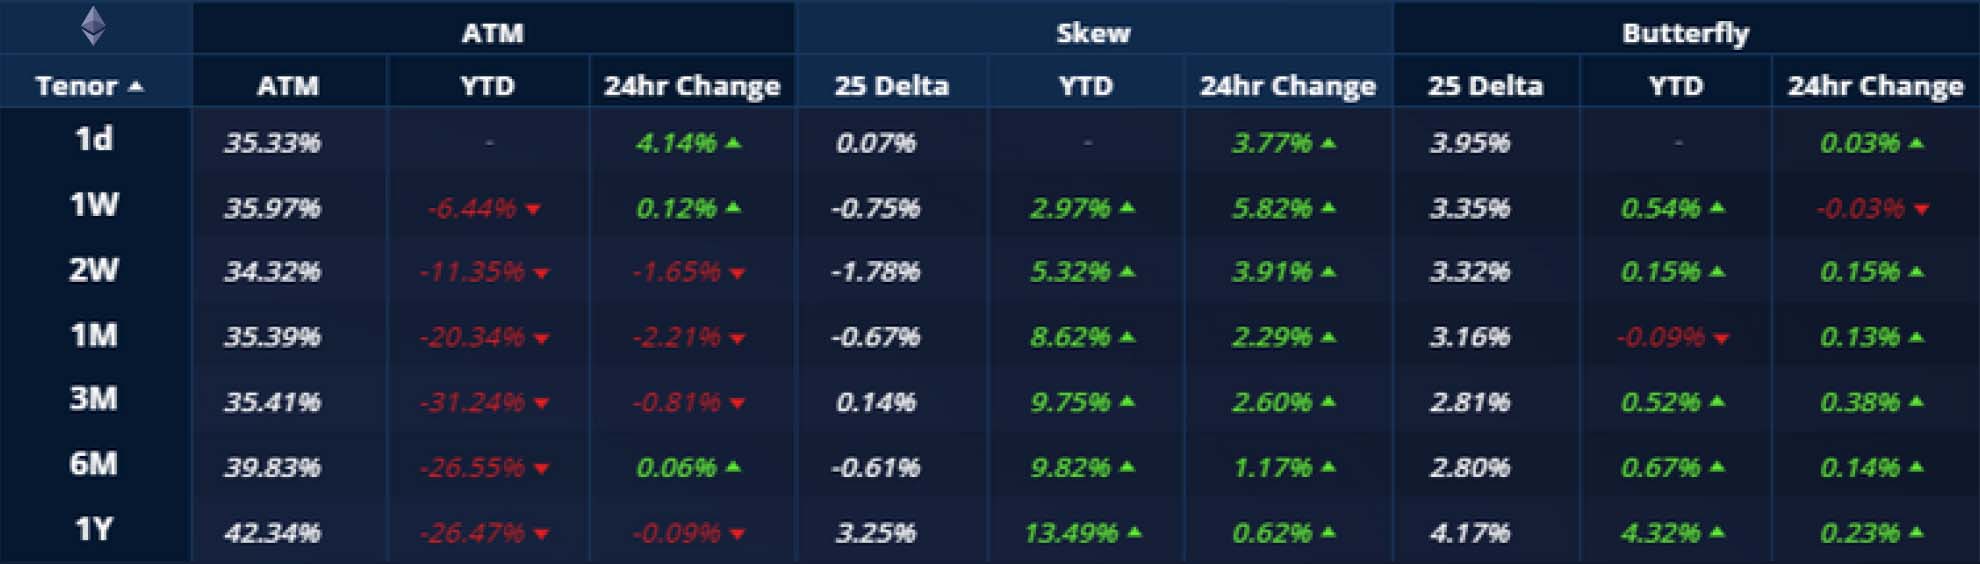
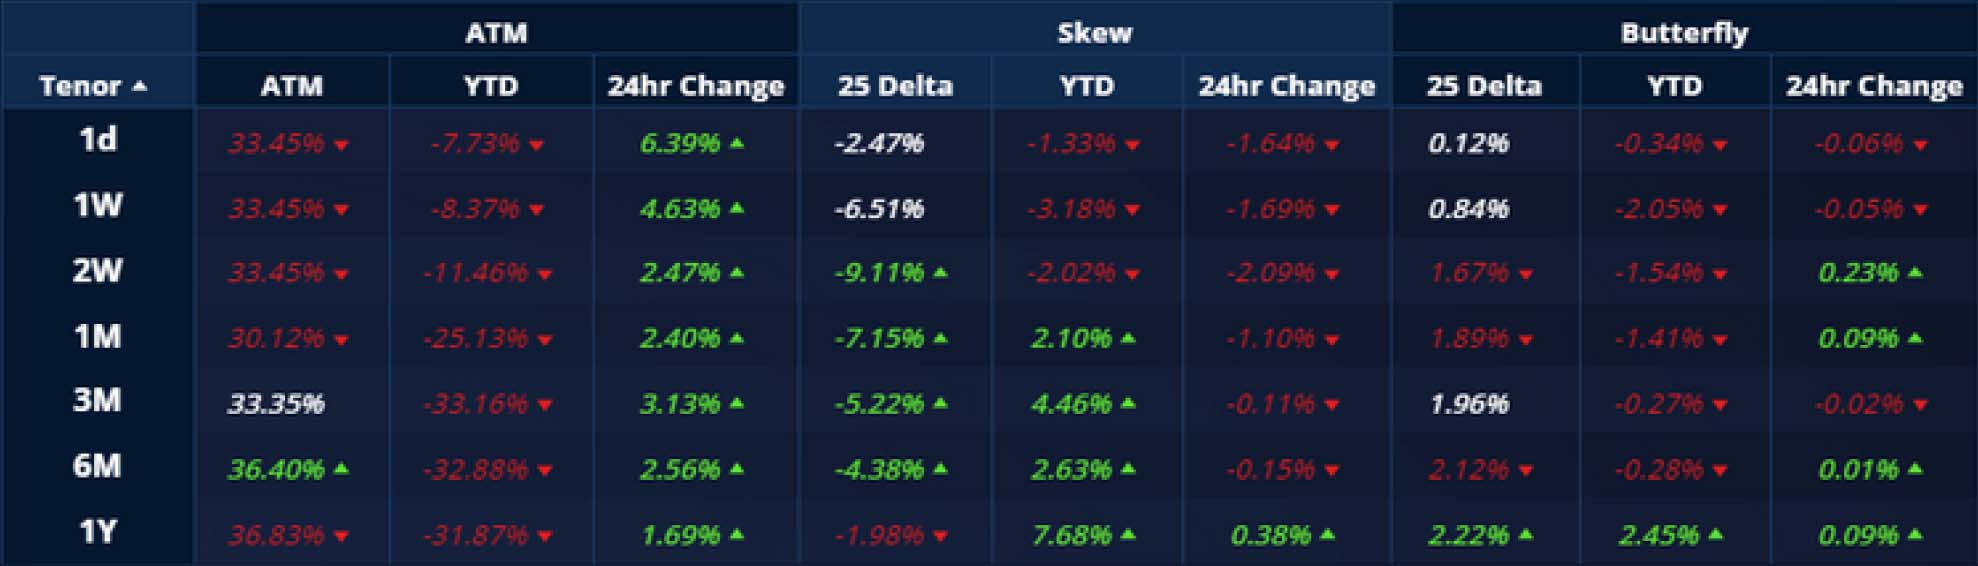
Volatility Surface Metrics.
*All data in tables recorded at a 14:30 UTC snapshot unless otherwise stated.
Futures

BTC ANNUALISED YIELDS – fell dramatically during the selloff last week, reflecting a sharp drop of futures prices below spot price at all tenors.
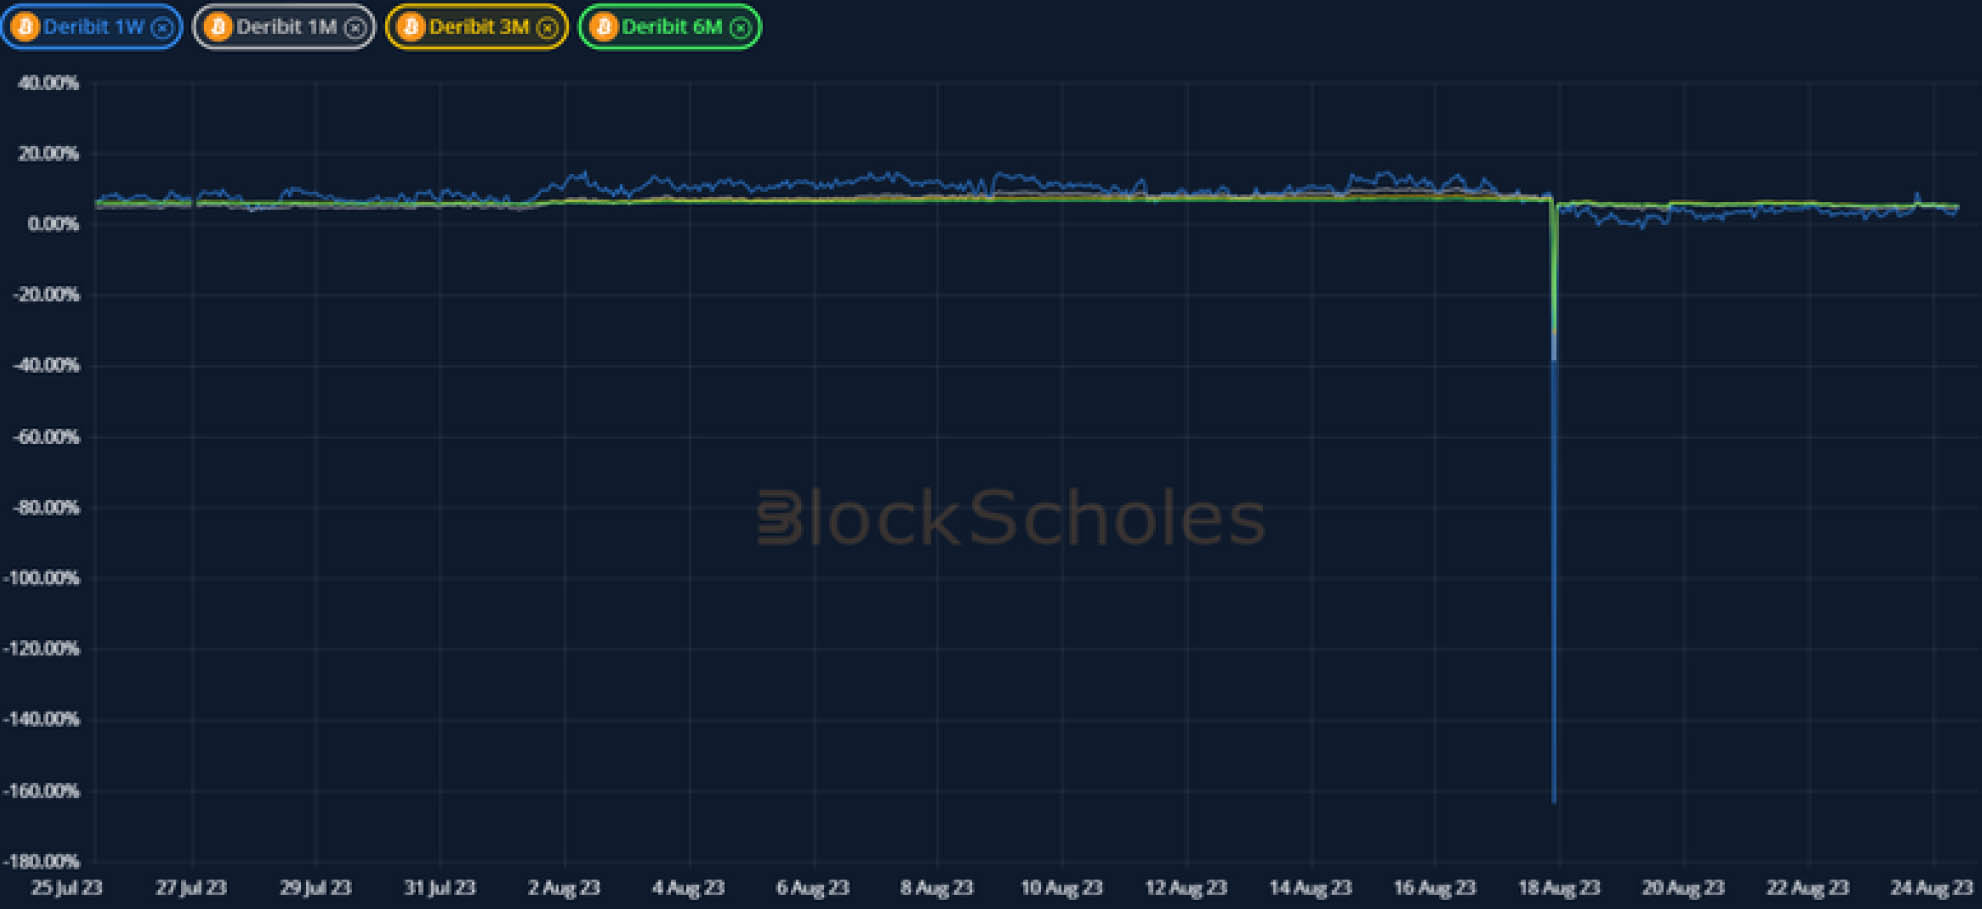
ETH ANNUALISED YIELDS – saw a similarly volatile fall as a result of the drop in futures prices at all tenors.

Perpetual Swap Funding Rate
BTC FUNDING RATE – the selloff in spot signalled a decisive halt to the long held positive funding rate, turning swiftly negative before trading sideways in the week since.

ETH FUNDING RATE – remains far more muted than before the selloff, during which it spiked to the lowest levels since March.

BTC Options

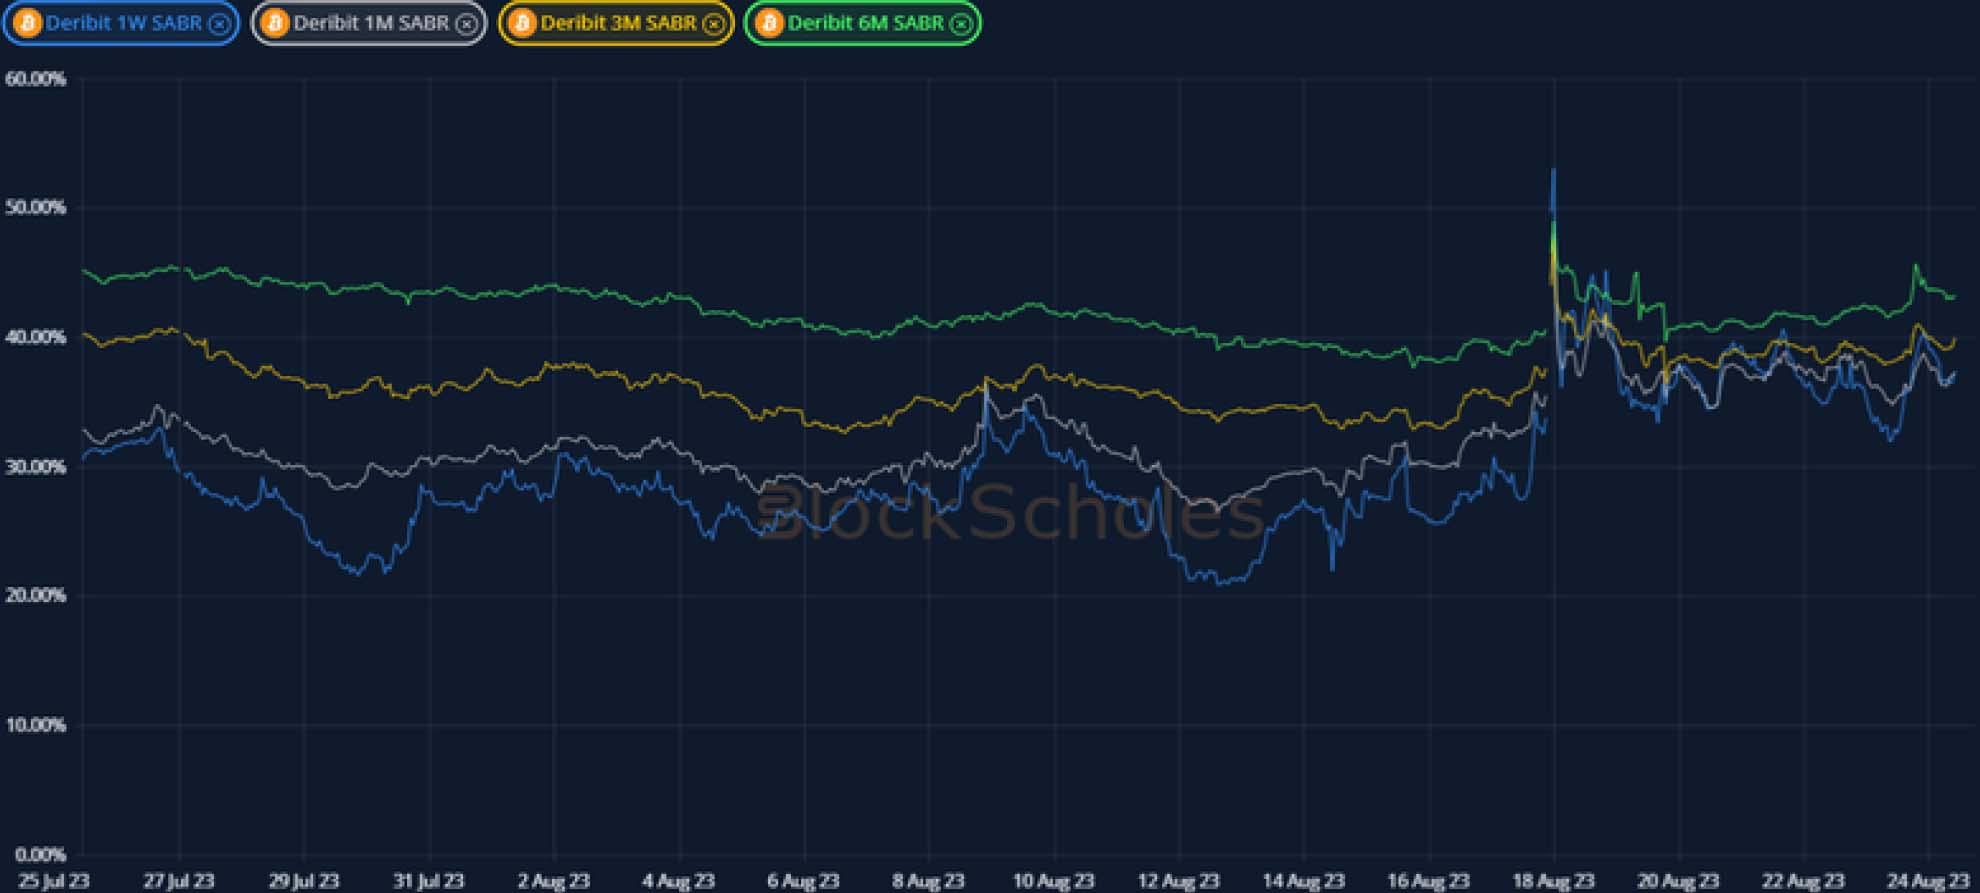
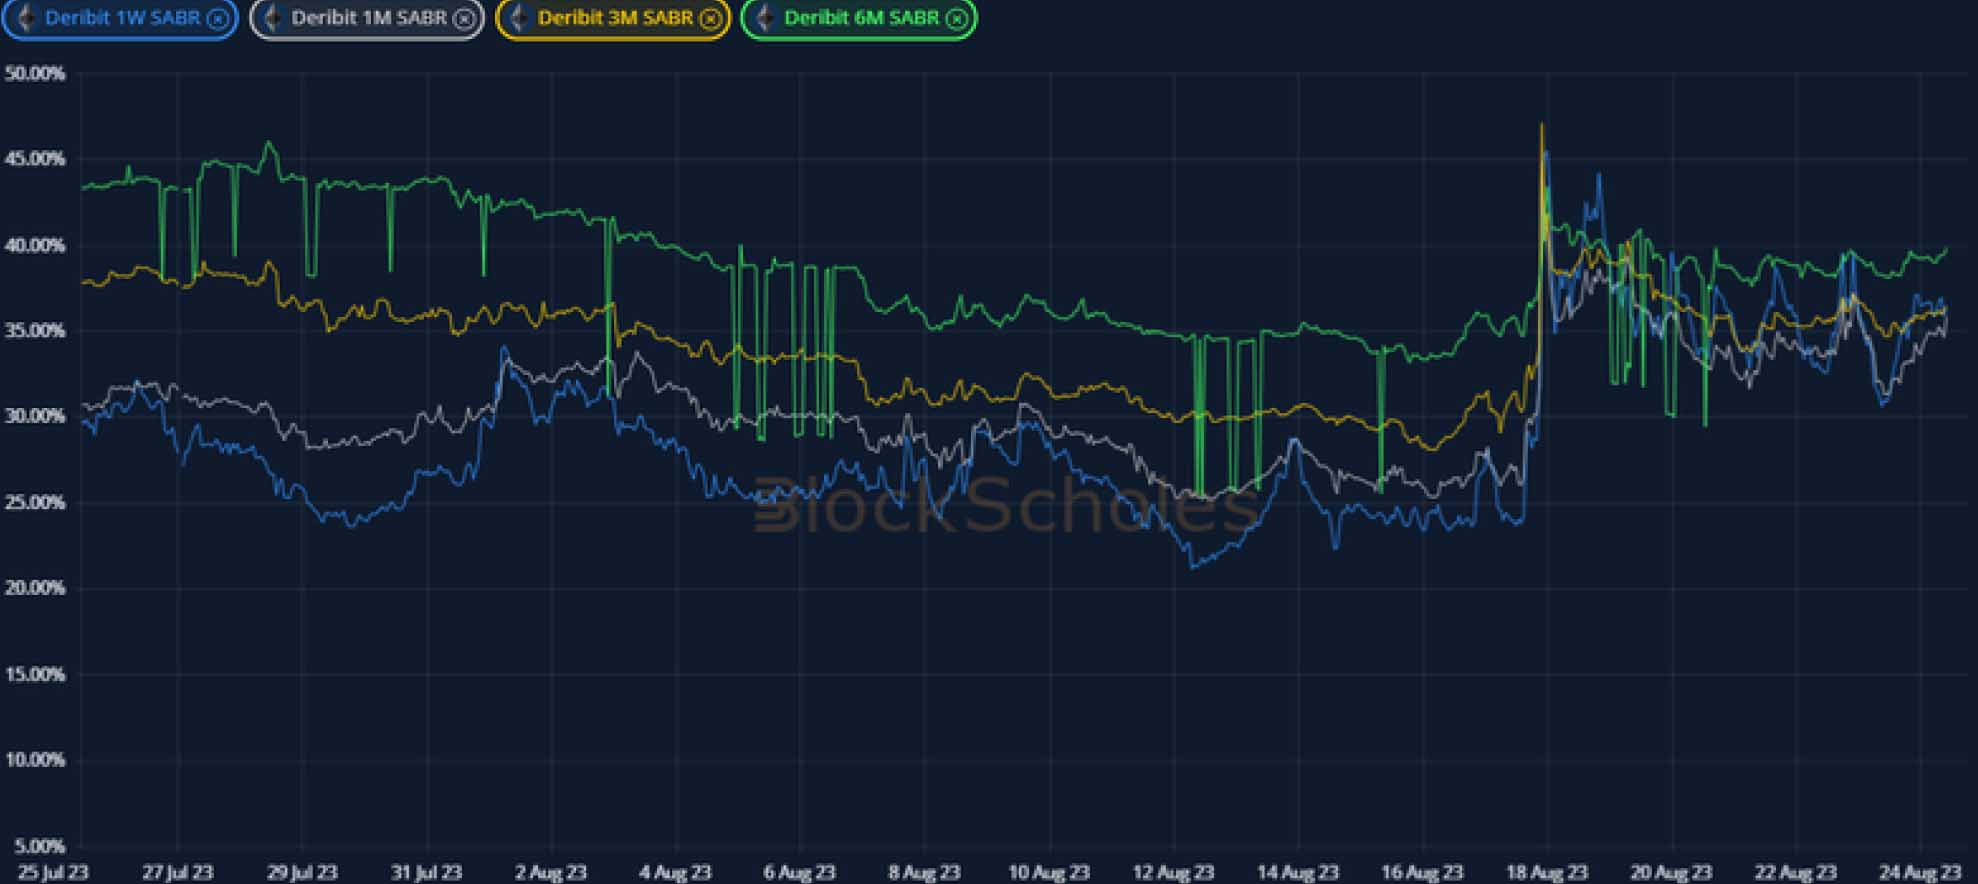
BTC SABR ATM IMPLIED VOLATILITY – jumped up as traders participated in the downside action, and has traded at higher levels in the week since.
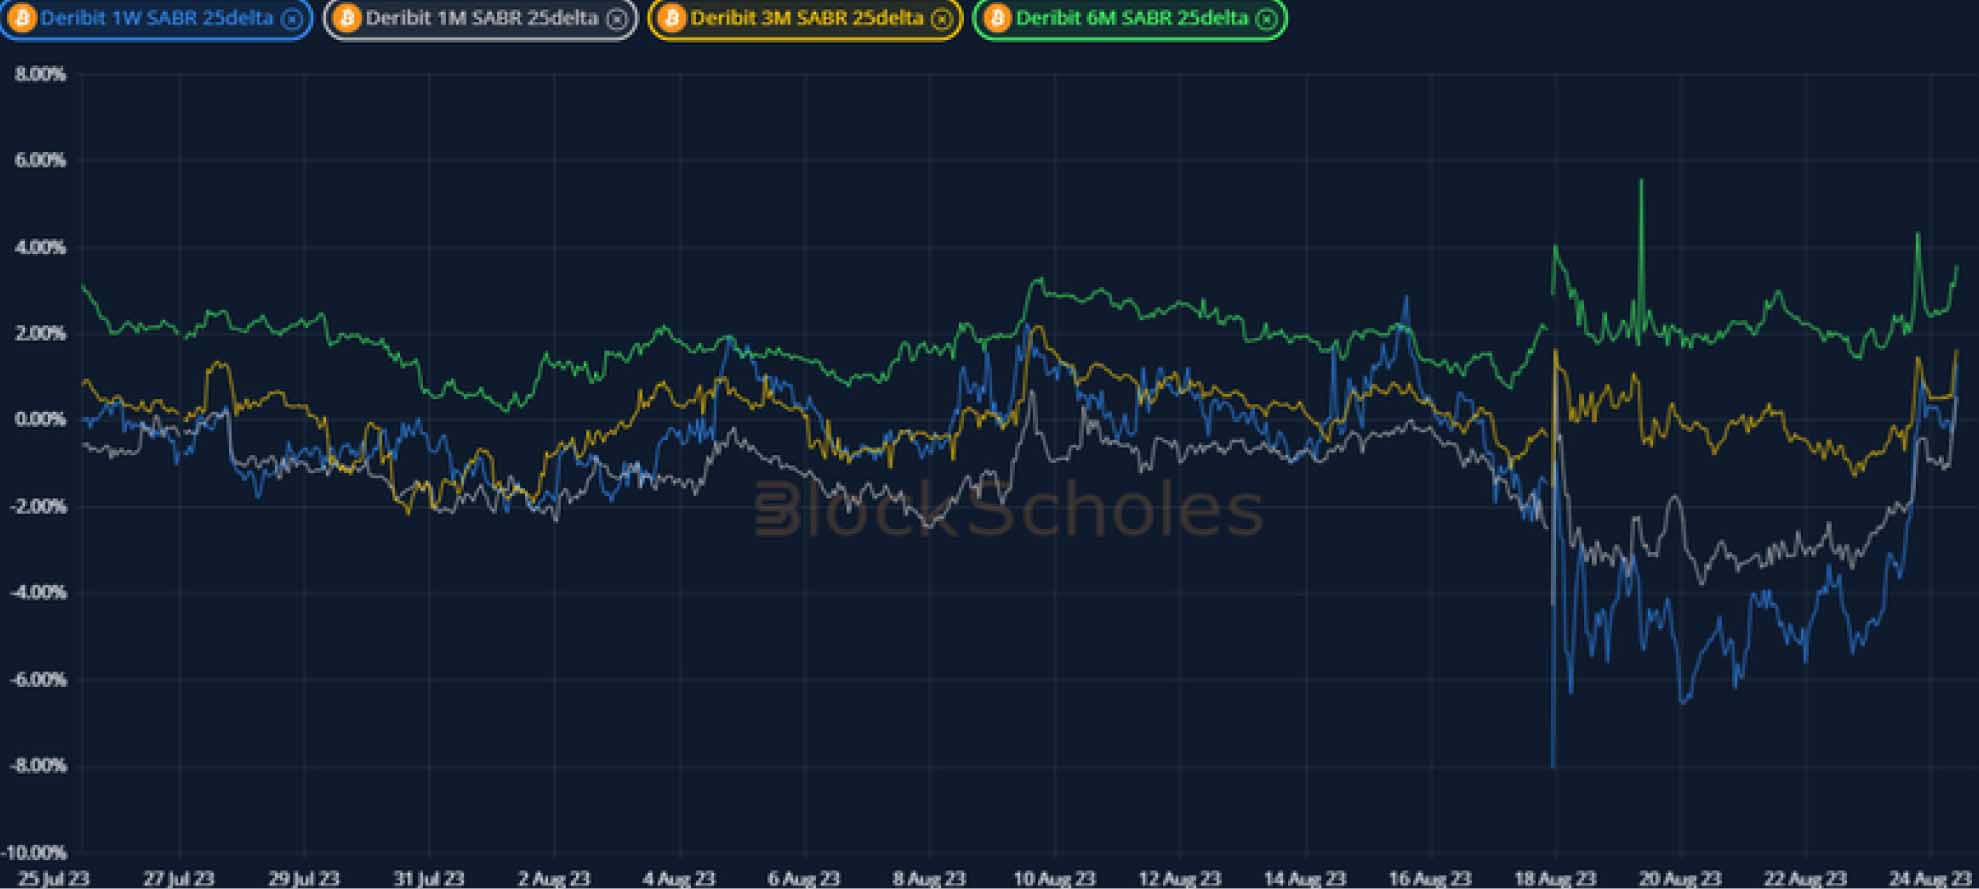
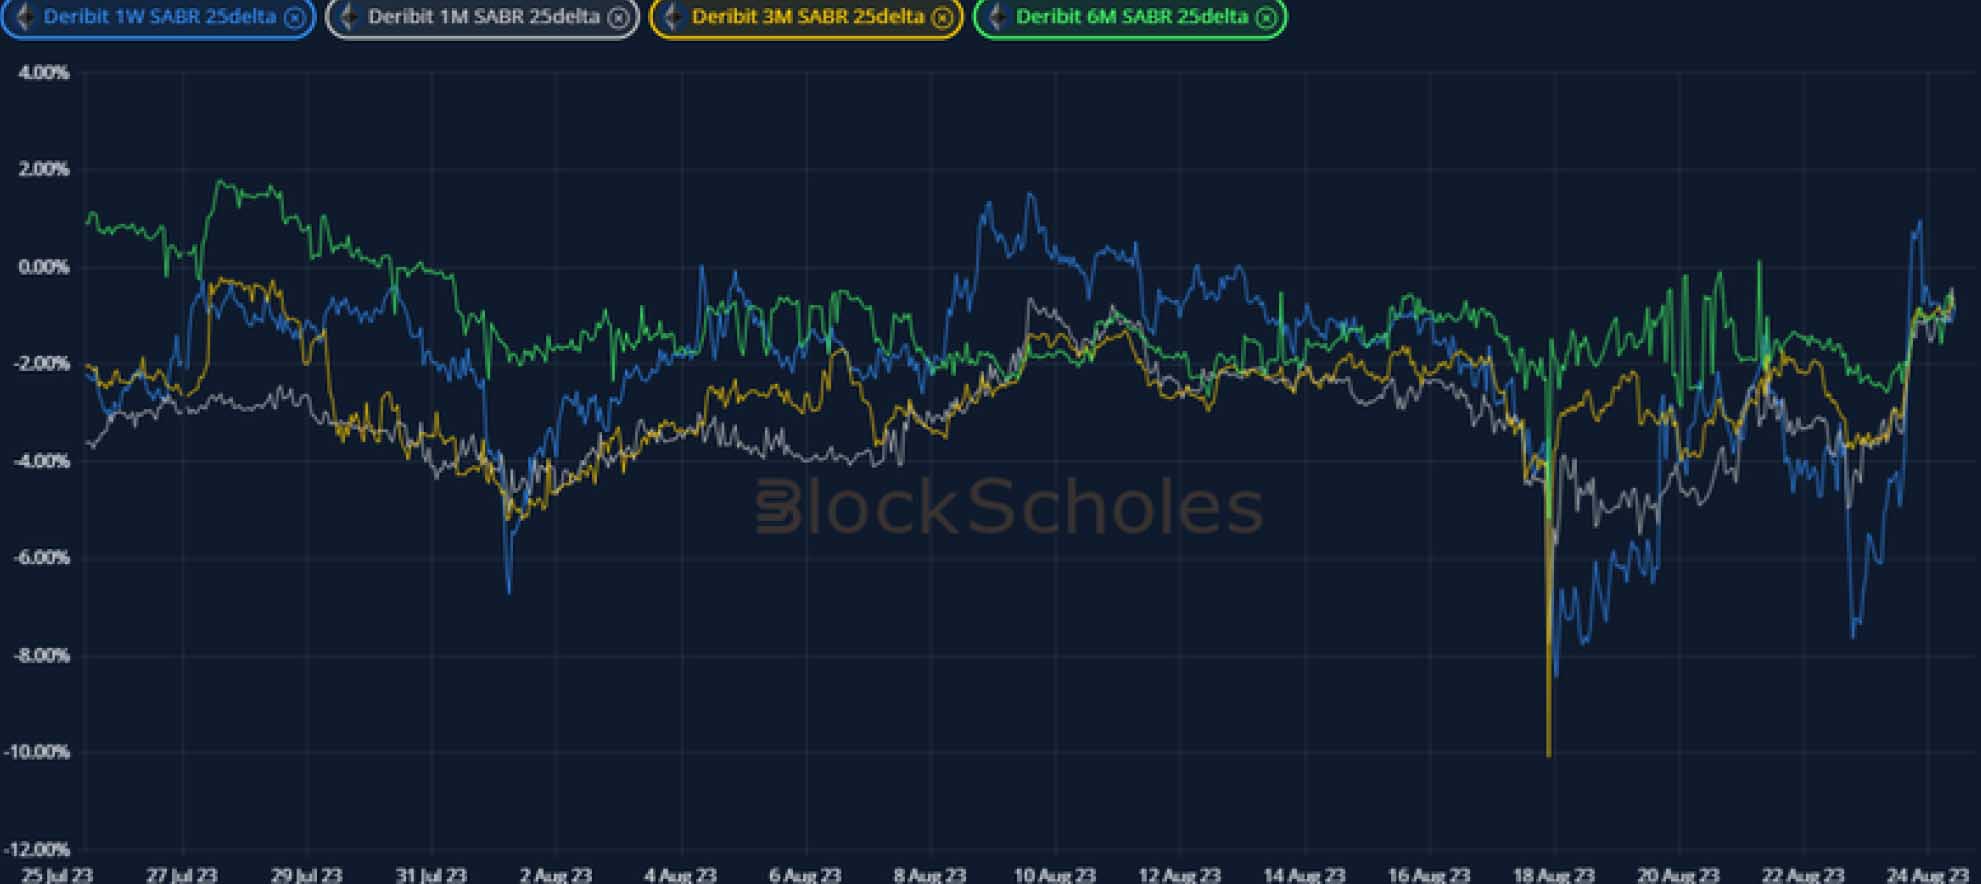
BTC 25-Delta Risk Reversal – shifted towards puts in the hours before the selloff, but has recovered from its negative levels during the last week.
ETH Options
ETH SABR ATM IMPLIED VOLATILITY – spiked at all tenors at the same time as BTC’s but at a noticably lower levels – a high of only 45%.
ETH 25-Delta Risk Reversal – spiked further negative during the selloff and have not recovered to the same positive levels as BTC’s RRs.
Volatility Surface
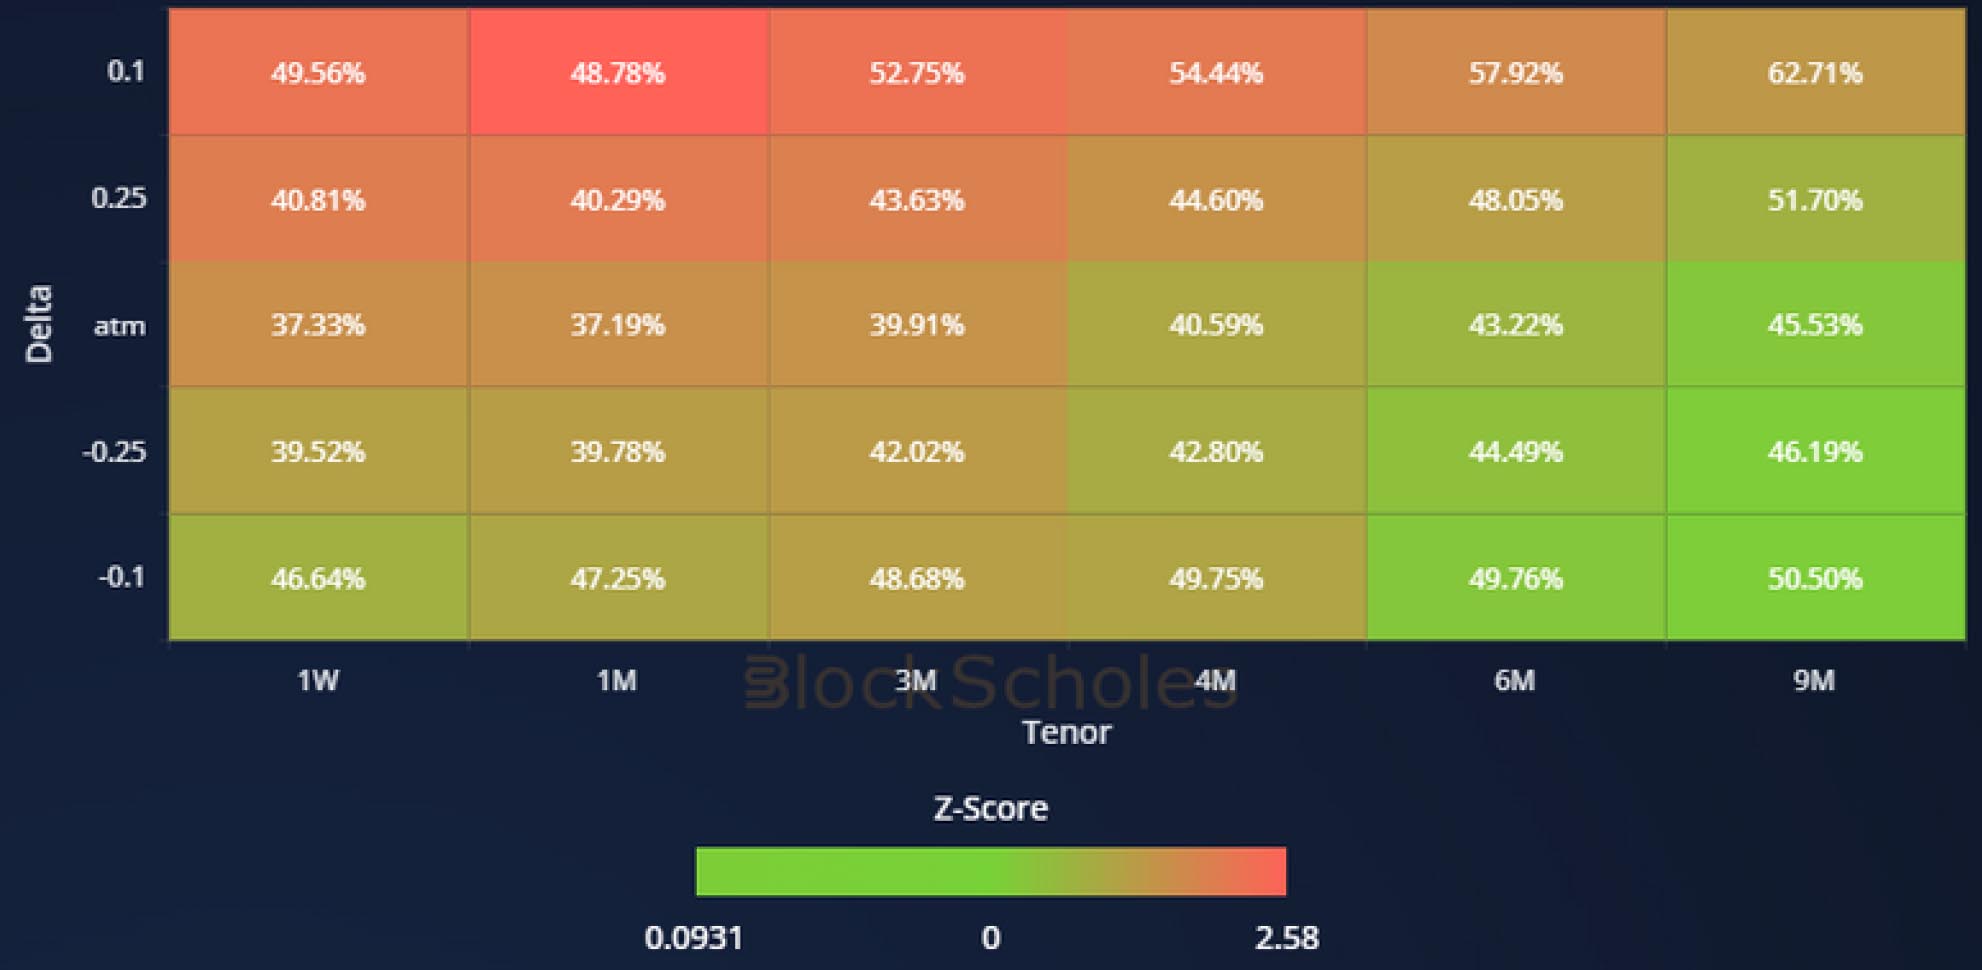
BTC IMPLIED VOL SURFACE – reflects the movement of the skew towards OTM calls, as well as showing an increase in implied volatility across the surface.
ETH IMPLIED VOL SURFACE – shows a stronger performance for short term tenor, OTM calls relative to OTM puts.
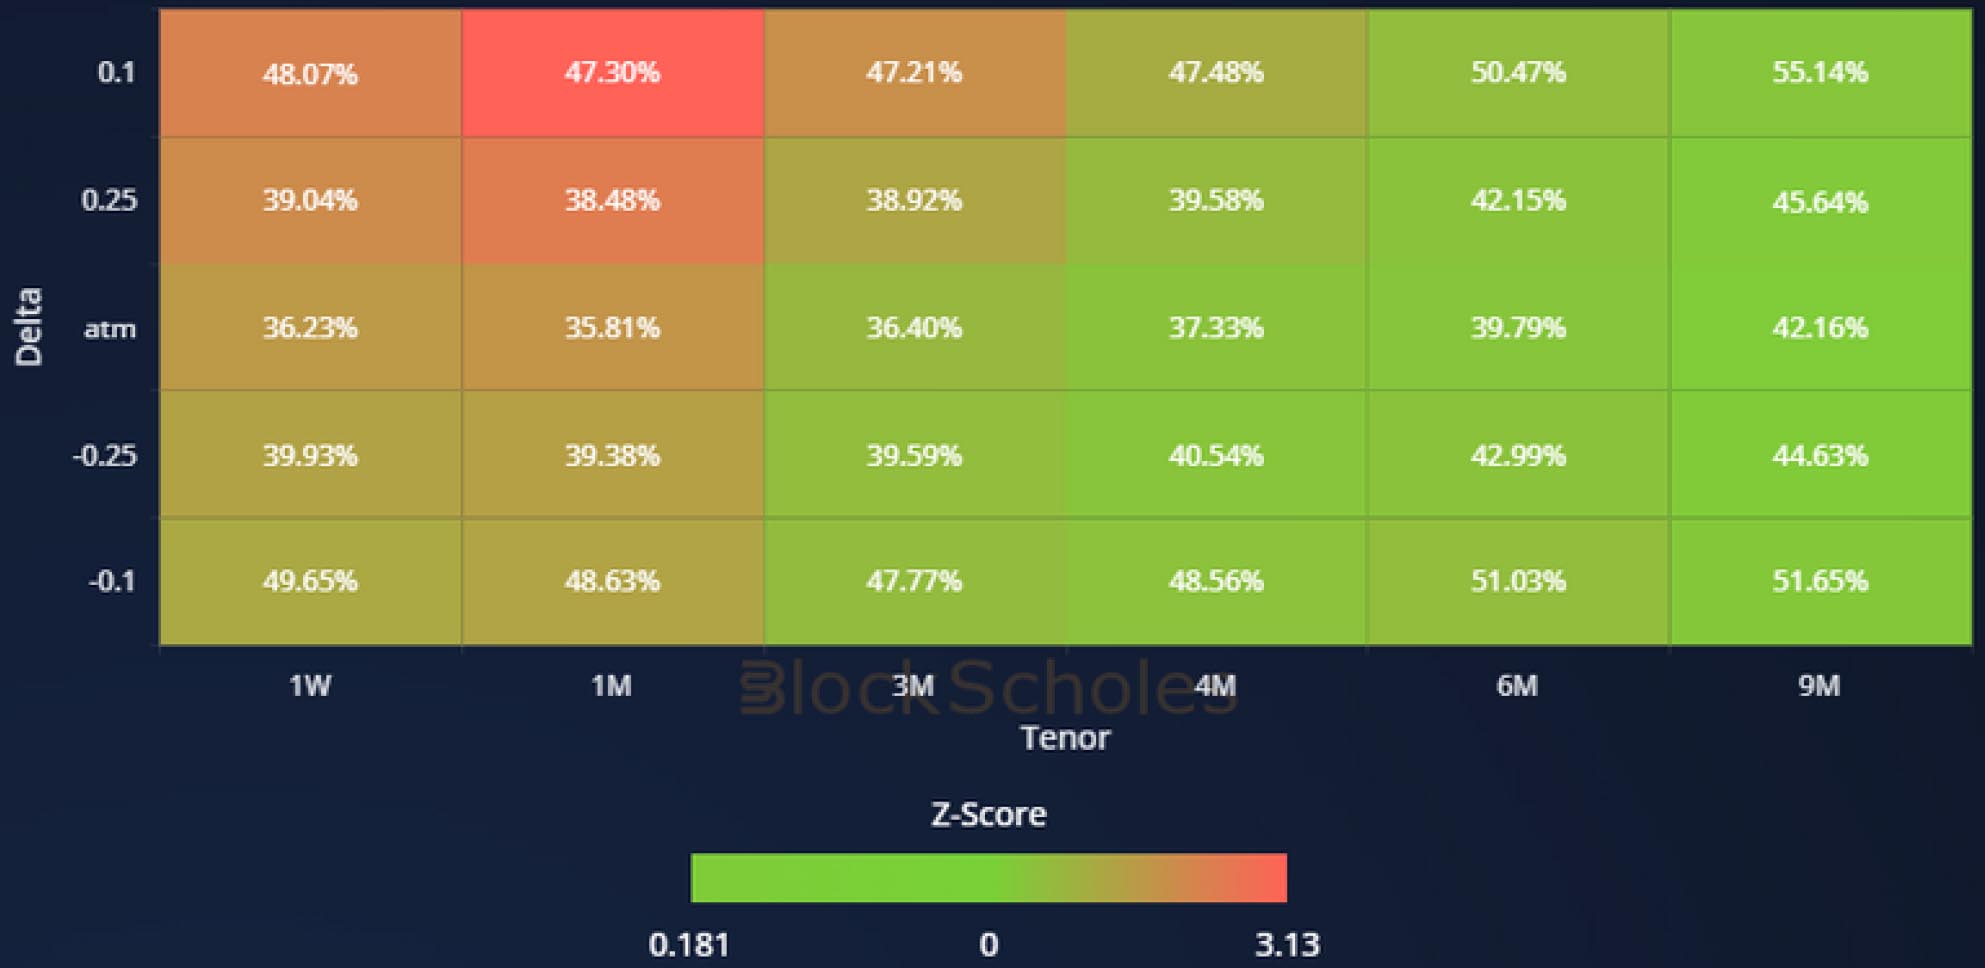
Z-Score calculated with respect to the distribution of implied volatility of an option at a given delta and tenor over the previous 30-days of hourly data, timestamp 10:00 UTC, SABR smile calibration.
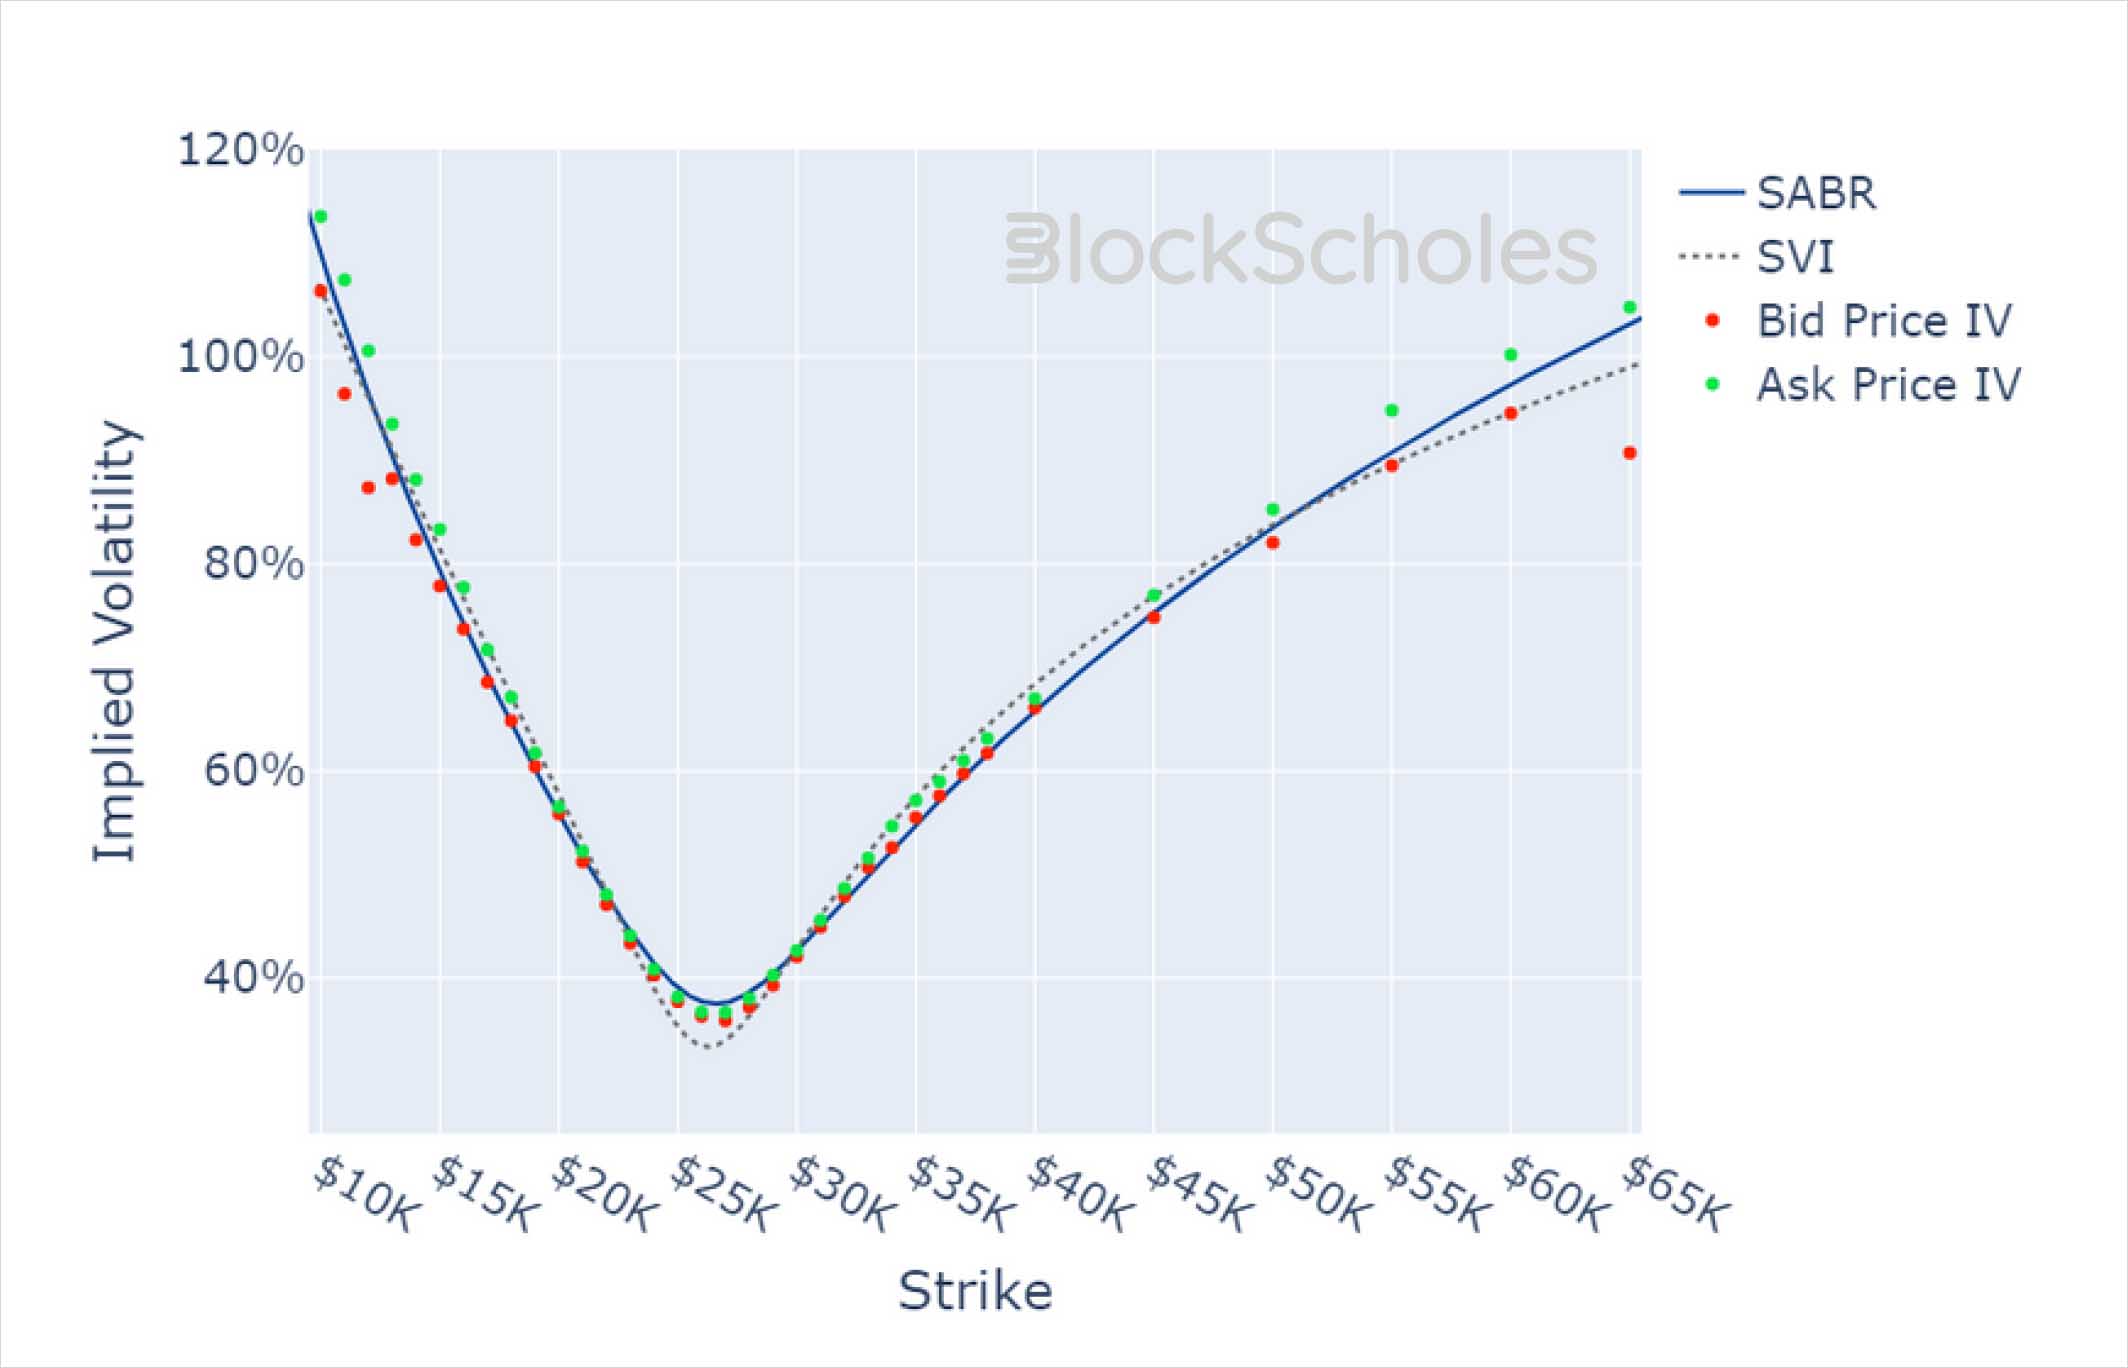
Volatility Smiles
BTC SMILE CALIBRATIONS – 29-Sep-2023 Expiry, 10:00 UTC Snapshot.
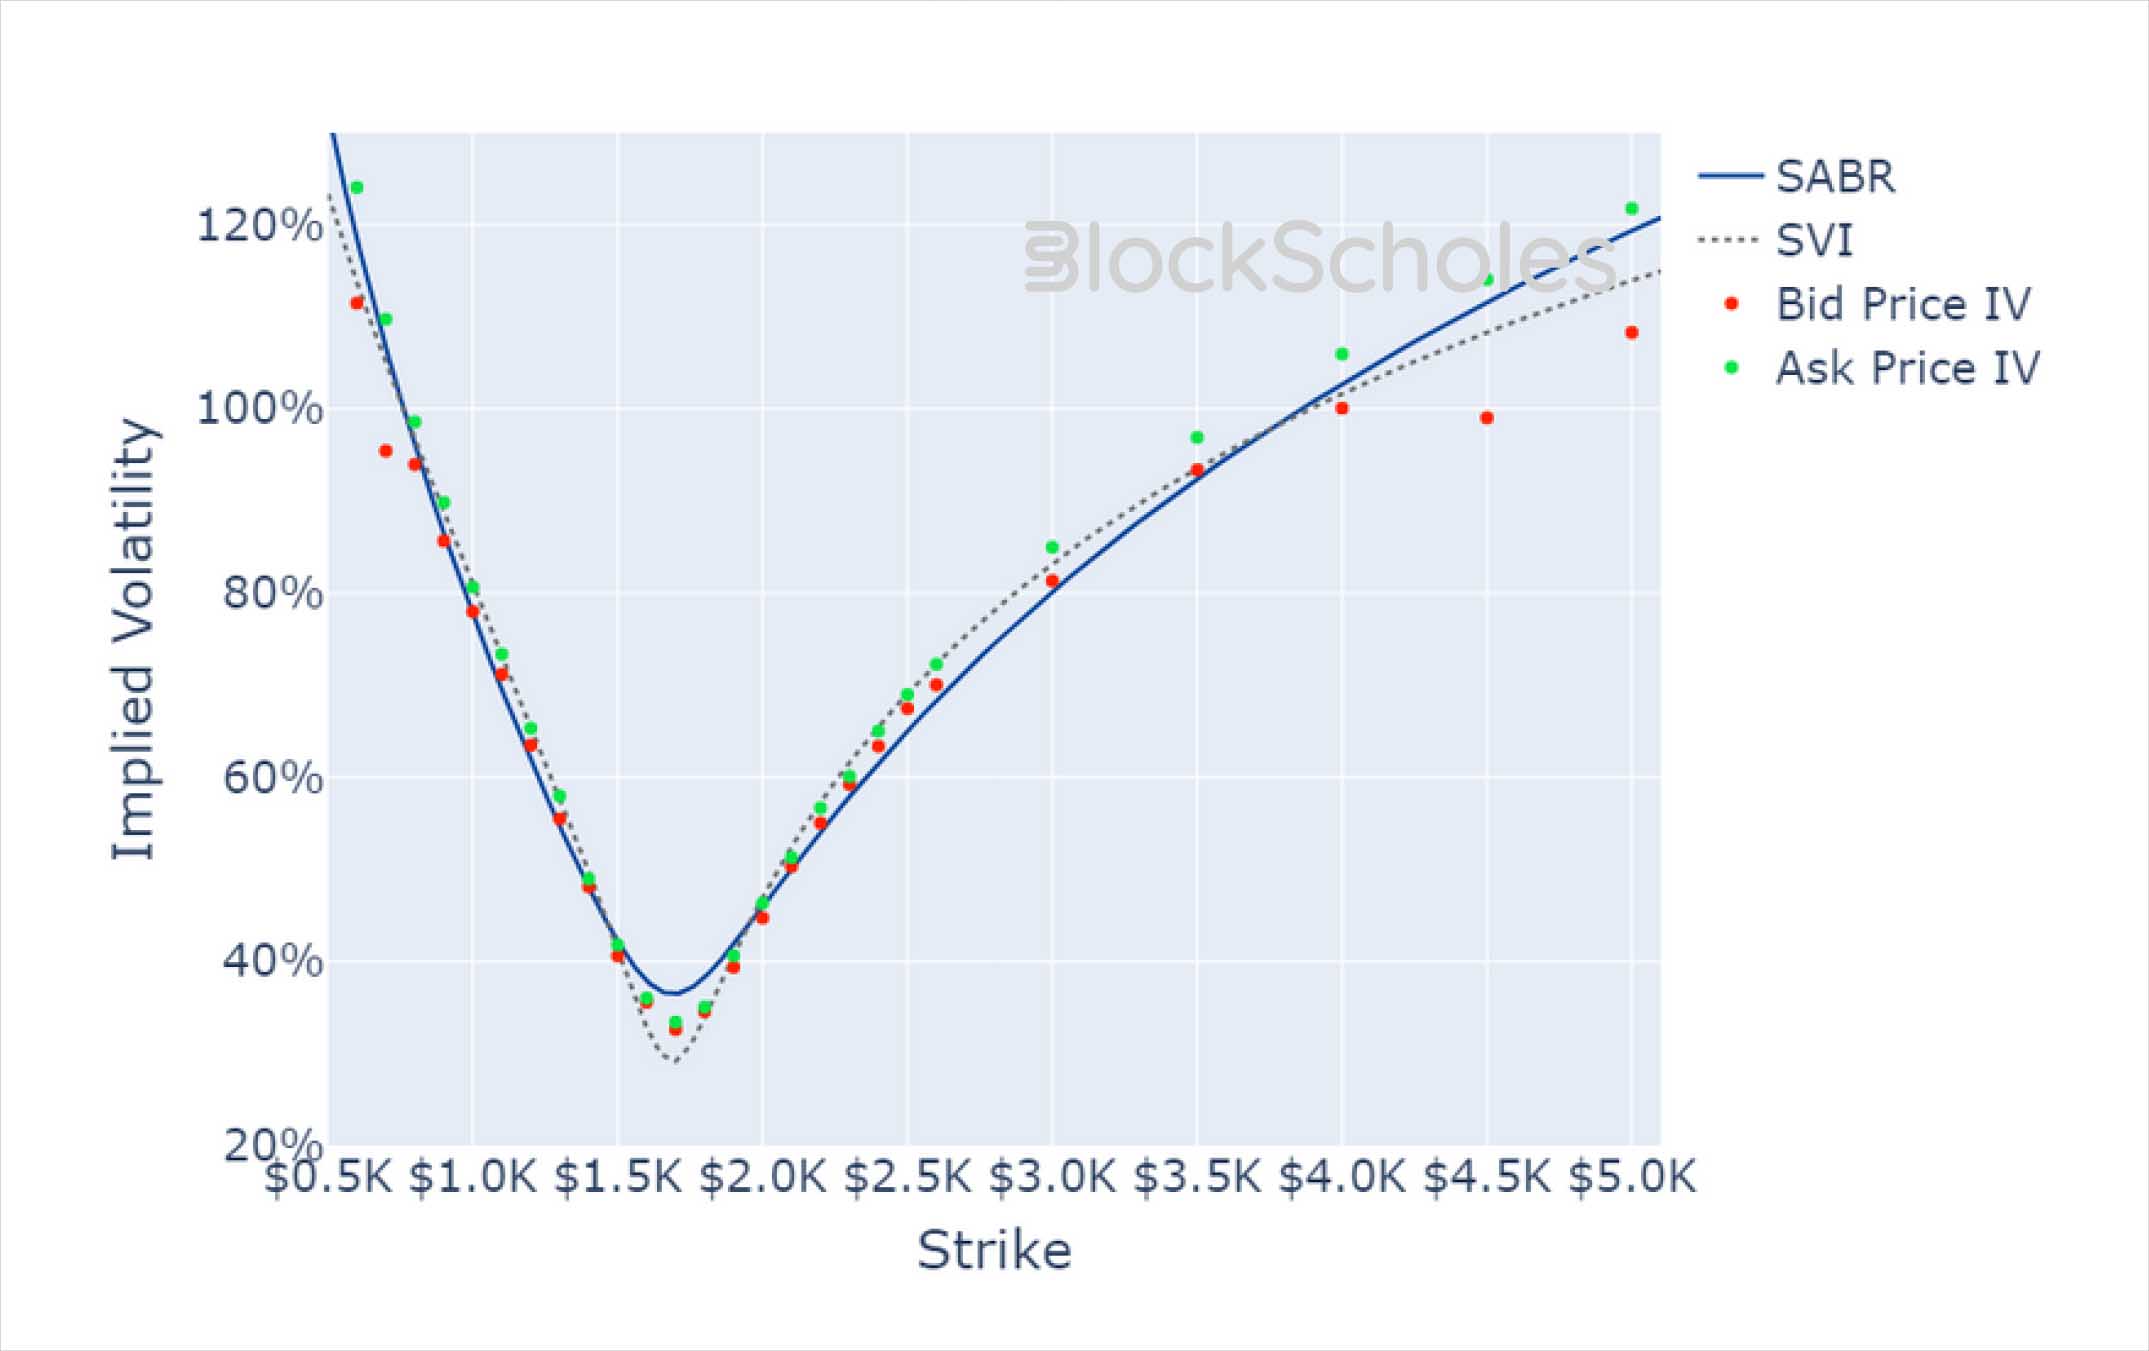
ETH SMILE CALIBRATIONS – 29-Sep-2023 Expiry, 10:00 UTC Snapshot.
Historical SABR Volatility Smiles
BTC SABR CALIBRATION – 30 Day Tenor, 10:00 UTC Snapshot.

ETH SABR CALIBRATION – 30 Day Tenor, 10:00 UTC Snapshot.

AUTHOR(S)
Trading with a competitive edge. Providing robust quantitative modelling and pricing engines across crypto derivatives and risk metrics.