
Weekly recap of the crypto derivatives markets by BlockScholes.
Key Insights:
A Grayscale-inspired retrace of last week’s spot market selloff saw at-the-money volatility rise for BTC and ETH options alike. However, neither event managed to cause a sustained recovery from the historically low range in which volatility has traded throughout the last six months. Neither has this week’s rally seen a return to the strong and positive funding rates paid by long positions in perpetual swap contracts – a fact reflected by the subdued spot-yields implied by Futures.
Futures implied yield term structure.

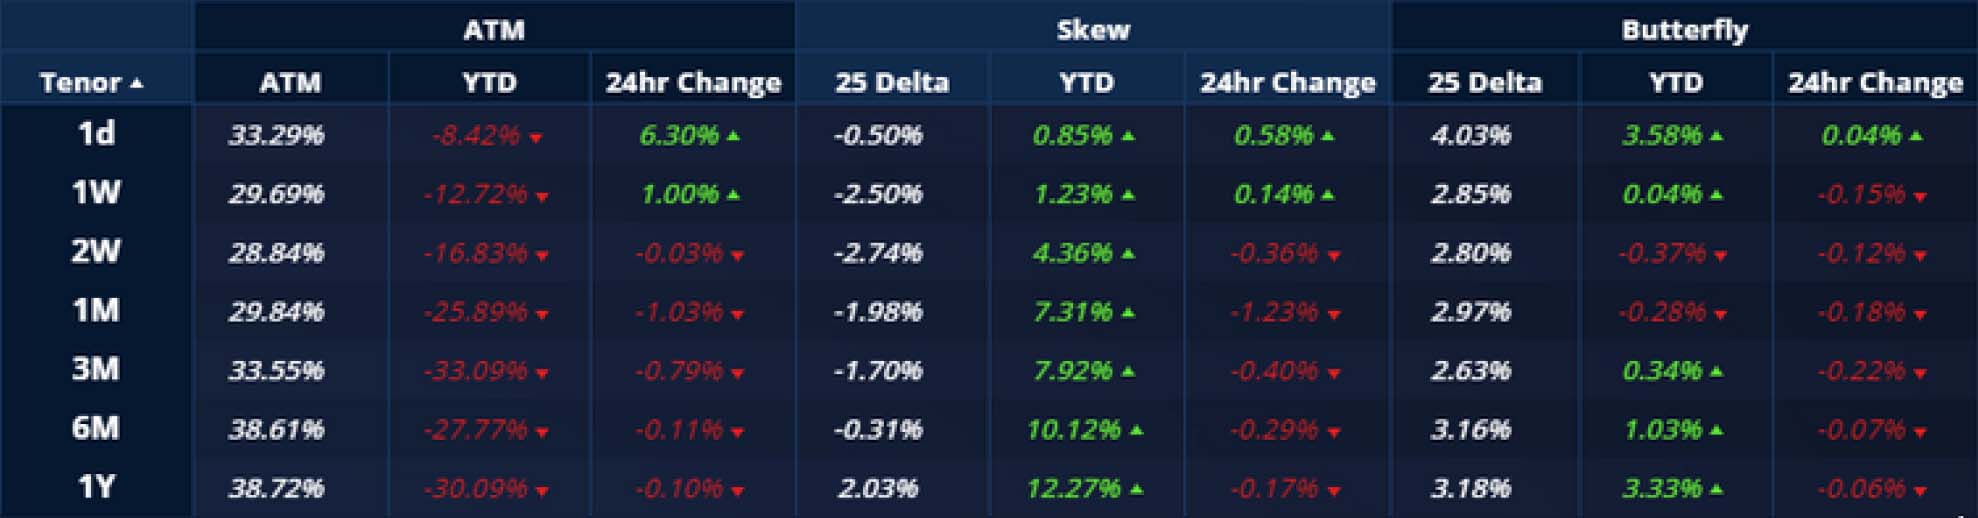
Volatility Surface Metrics.


*All data in tables recorded at a 10:05 UTC snapshot unless otherwise stated.
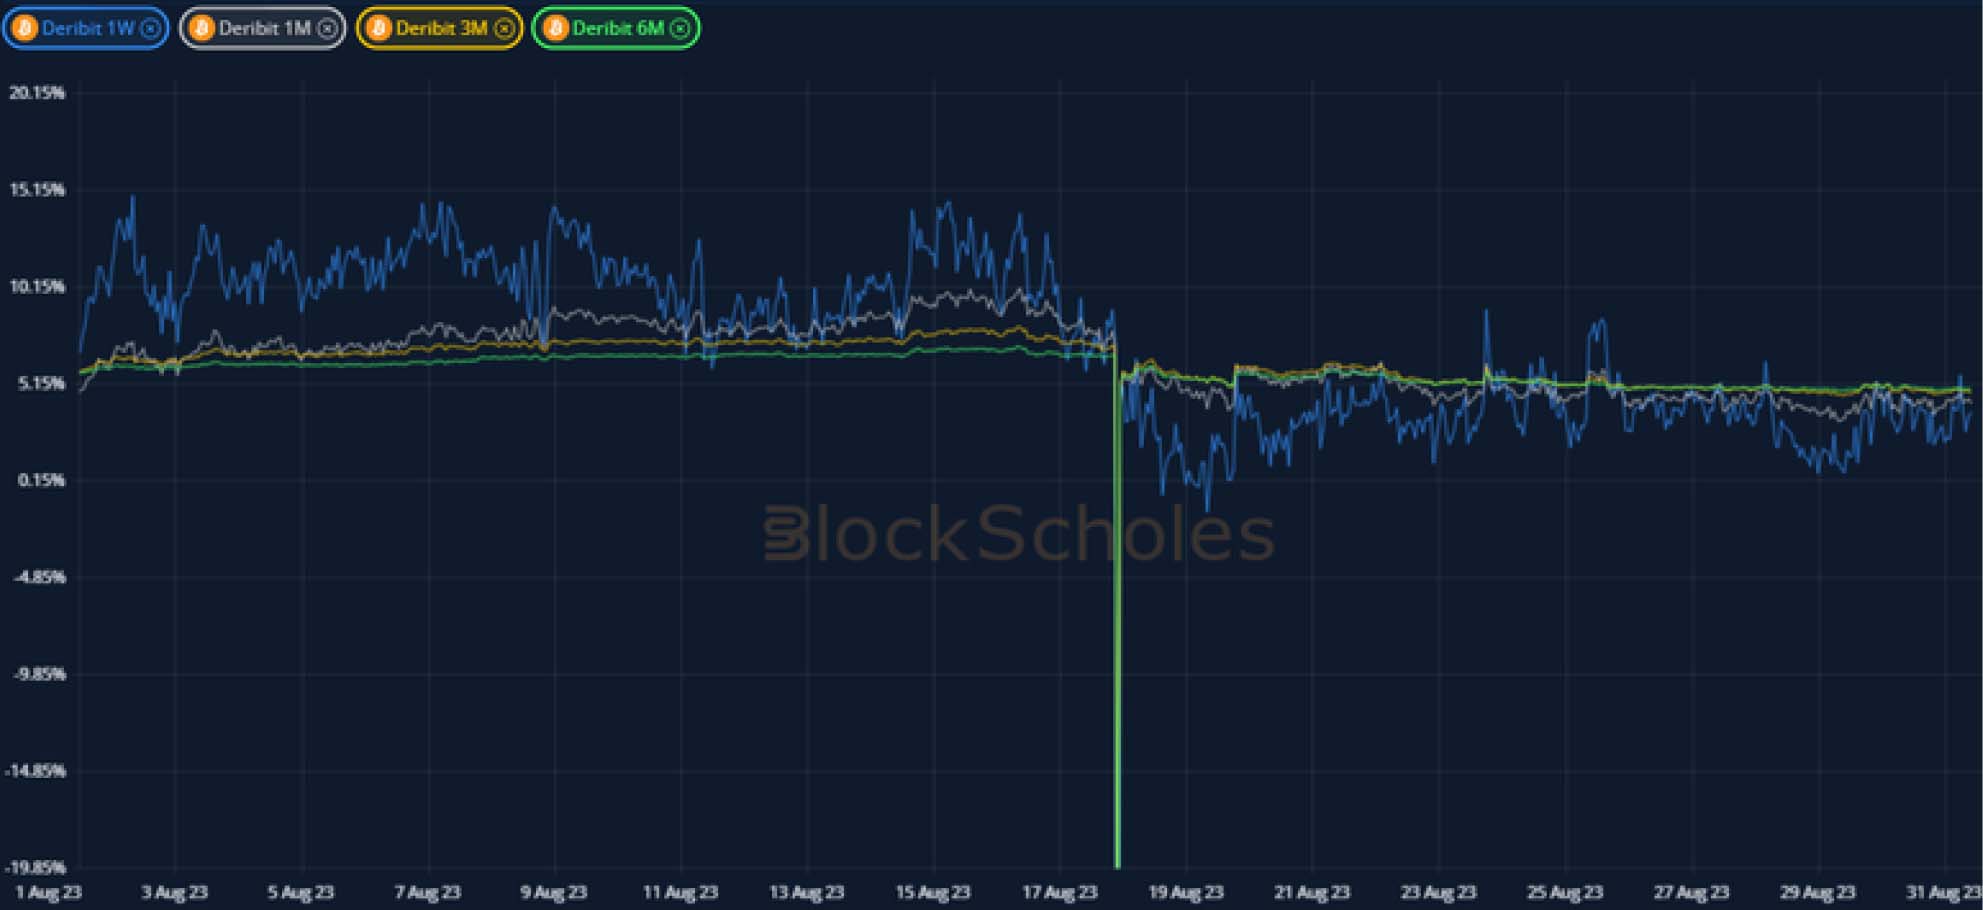
Futures
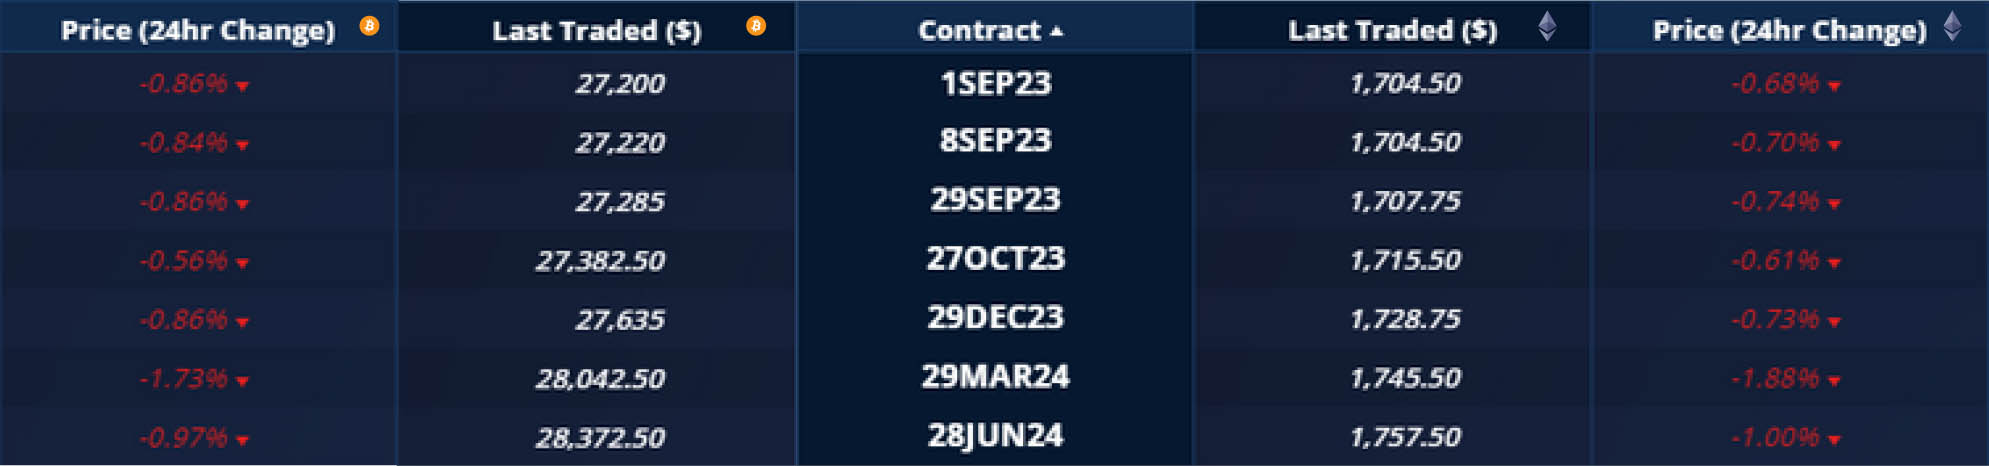
BTC ANNUALISED YIELDS – have repeated last week’s subdued performance despite the retrace in spot prices to the $27K level.
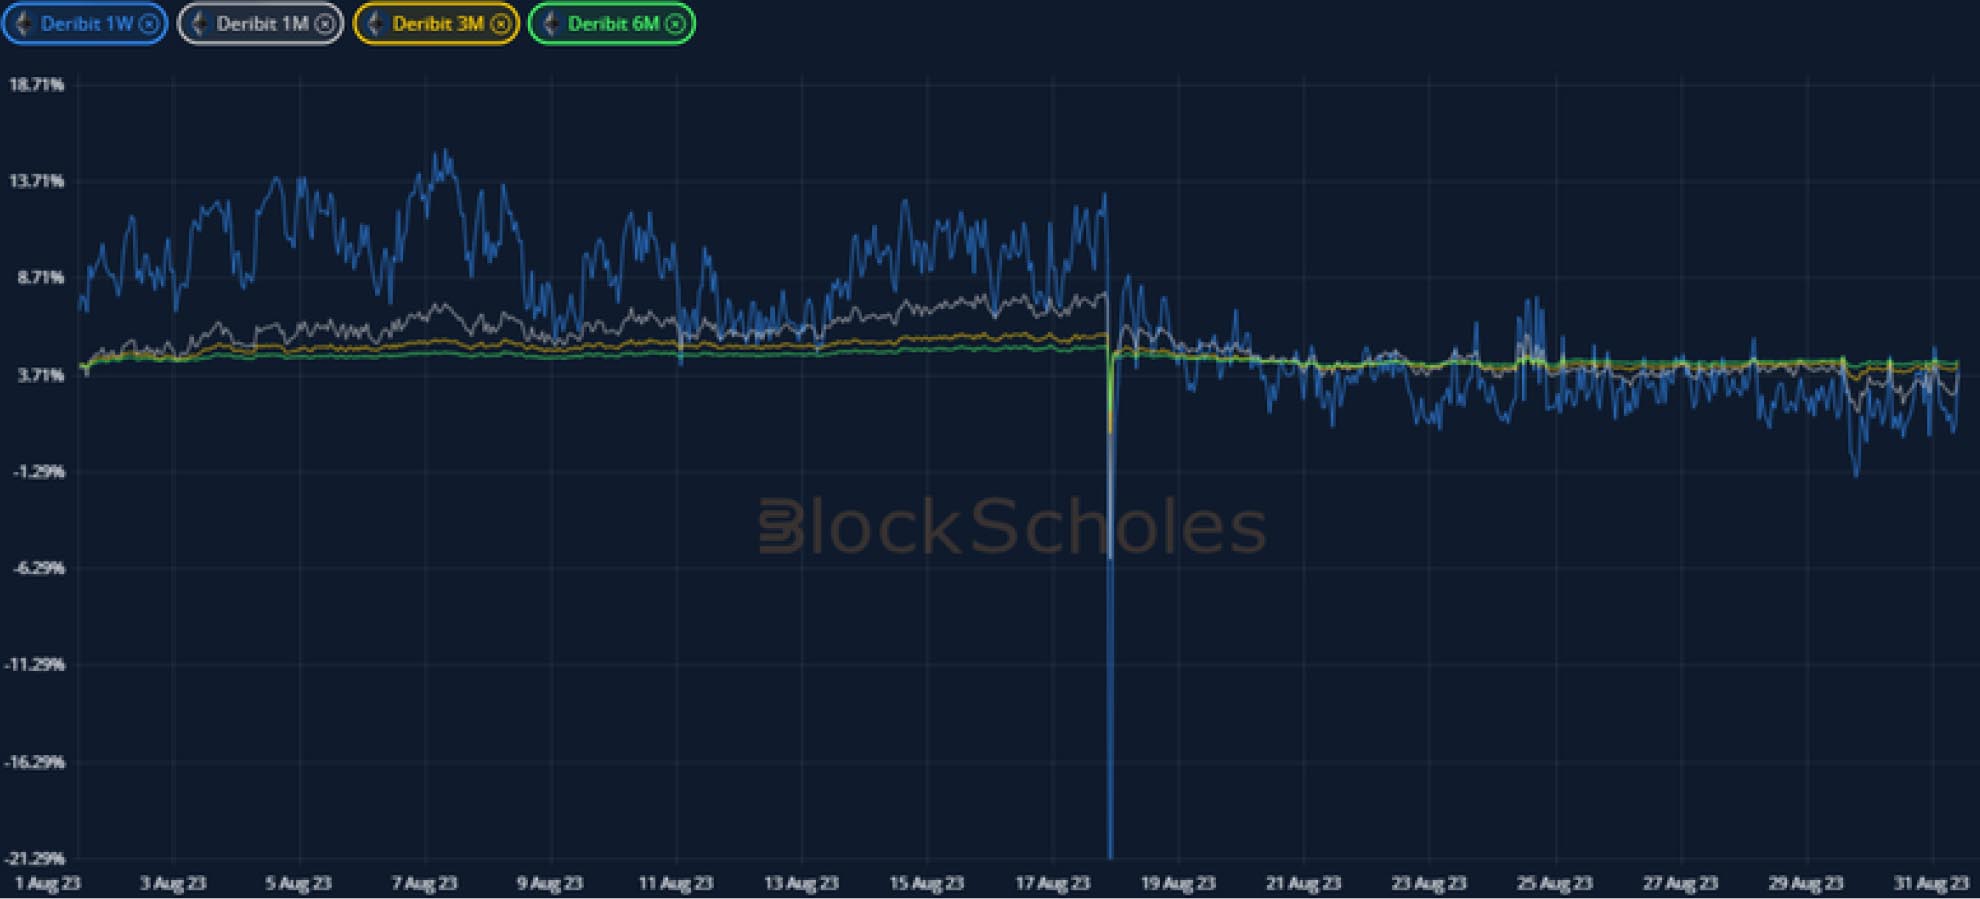
ETH ANNUALISED YIELDS – have also repeated last weeks’s behaviour, trading in a tight, relatively subdued range above zero.
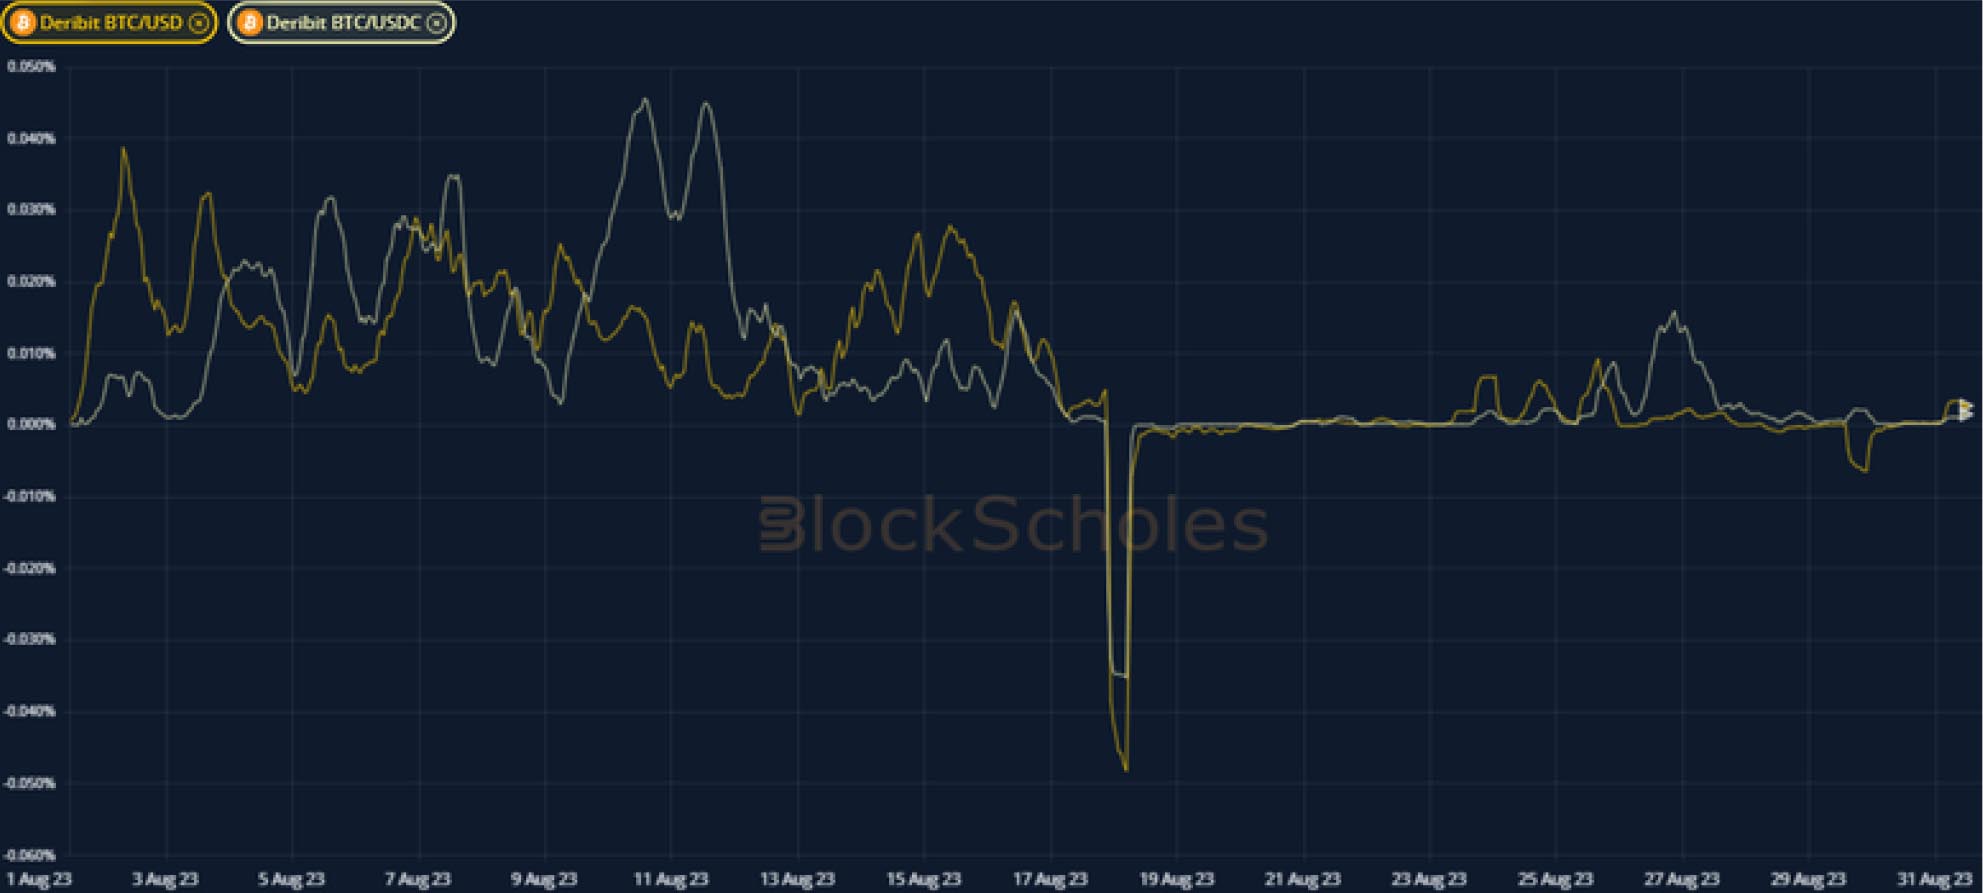
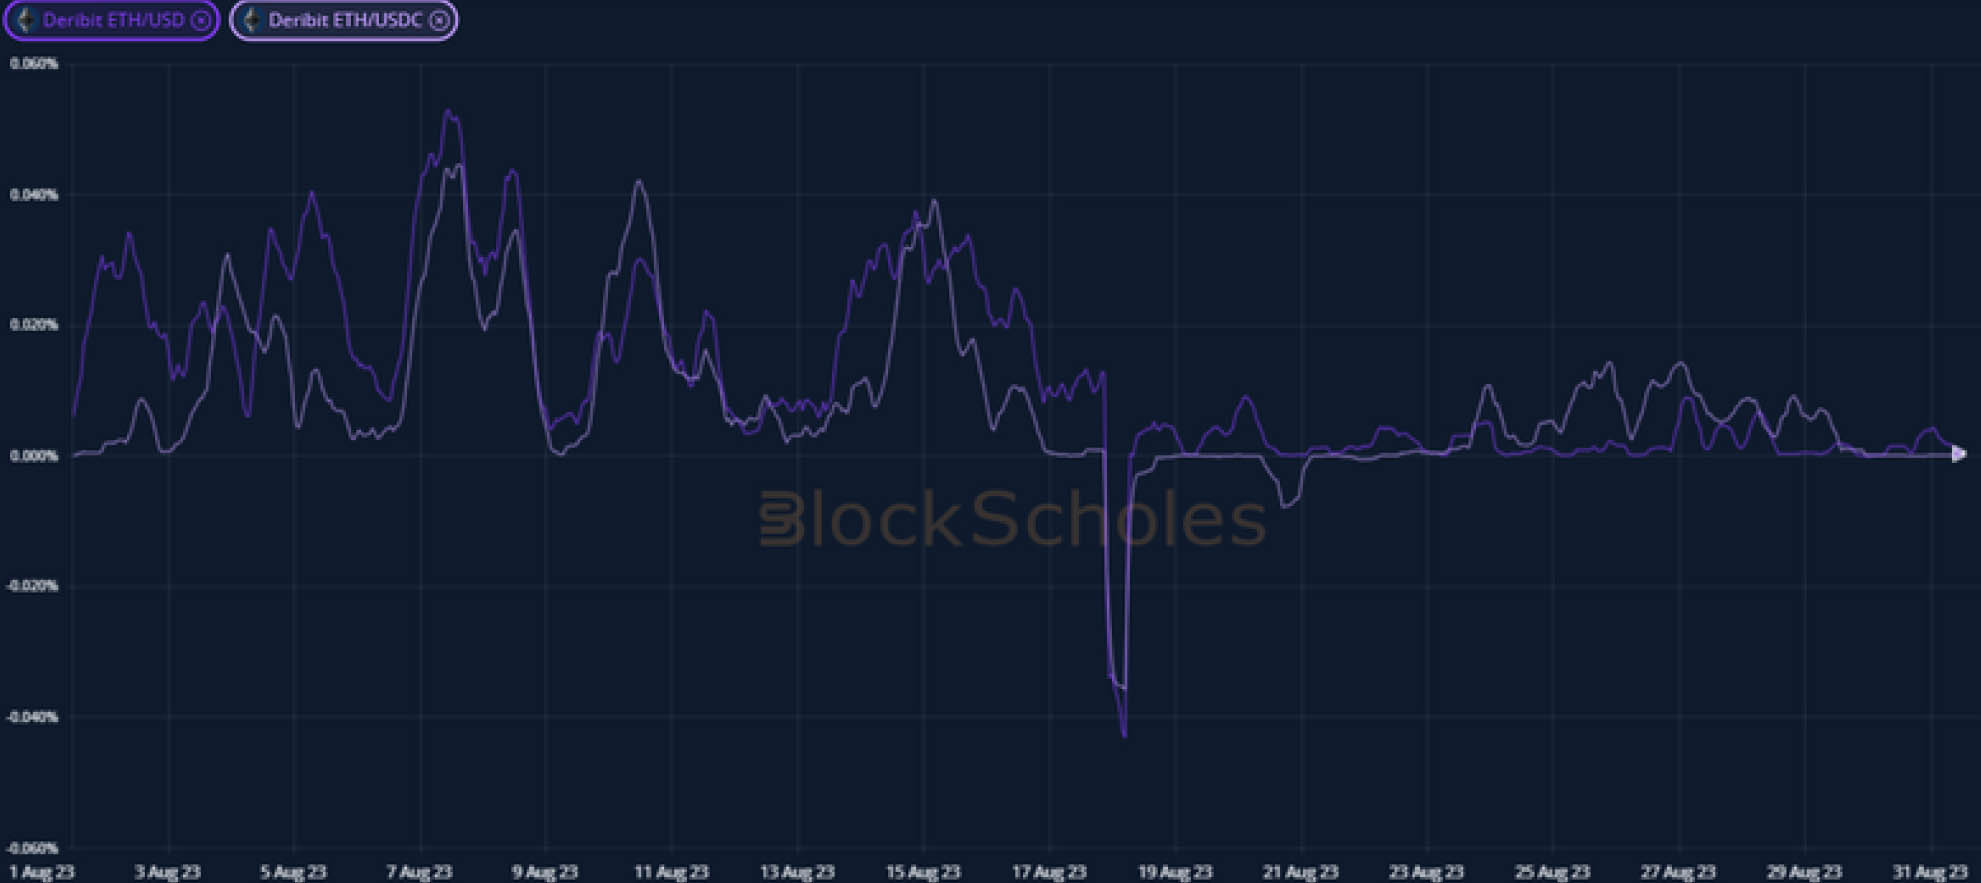
Perpetual Swap Funding Rate
BTC FUNDING RATE – has moved close to zero since the selloff appeared to moderate some of the sentiment that saw high rates paid by longs.
ETH FUNDING RATE – has reported a more consistently positive rate paid by longs than BTC’s, but remains below the levels seen in early August.
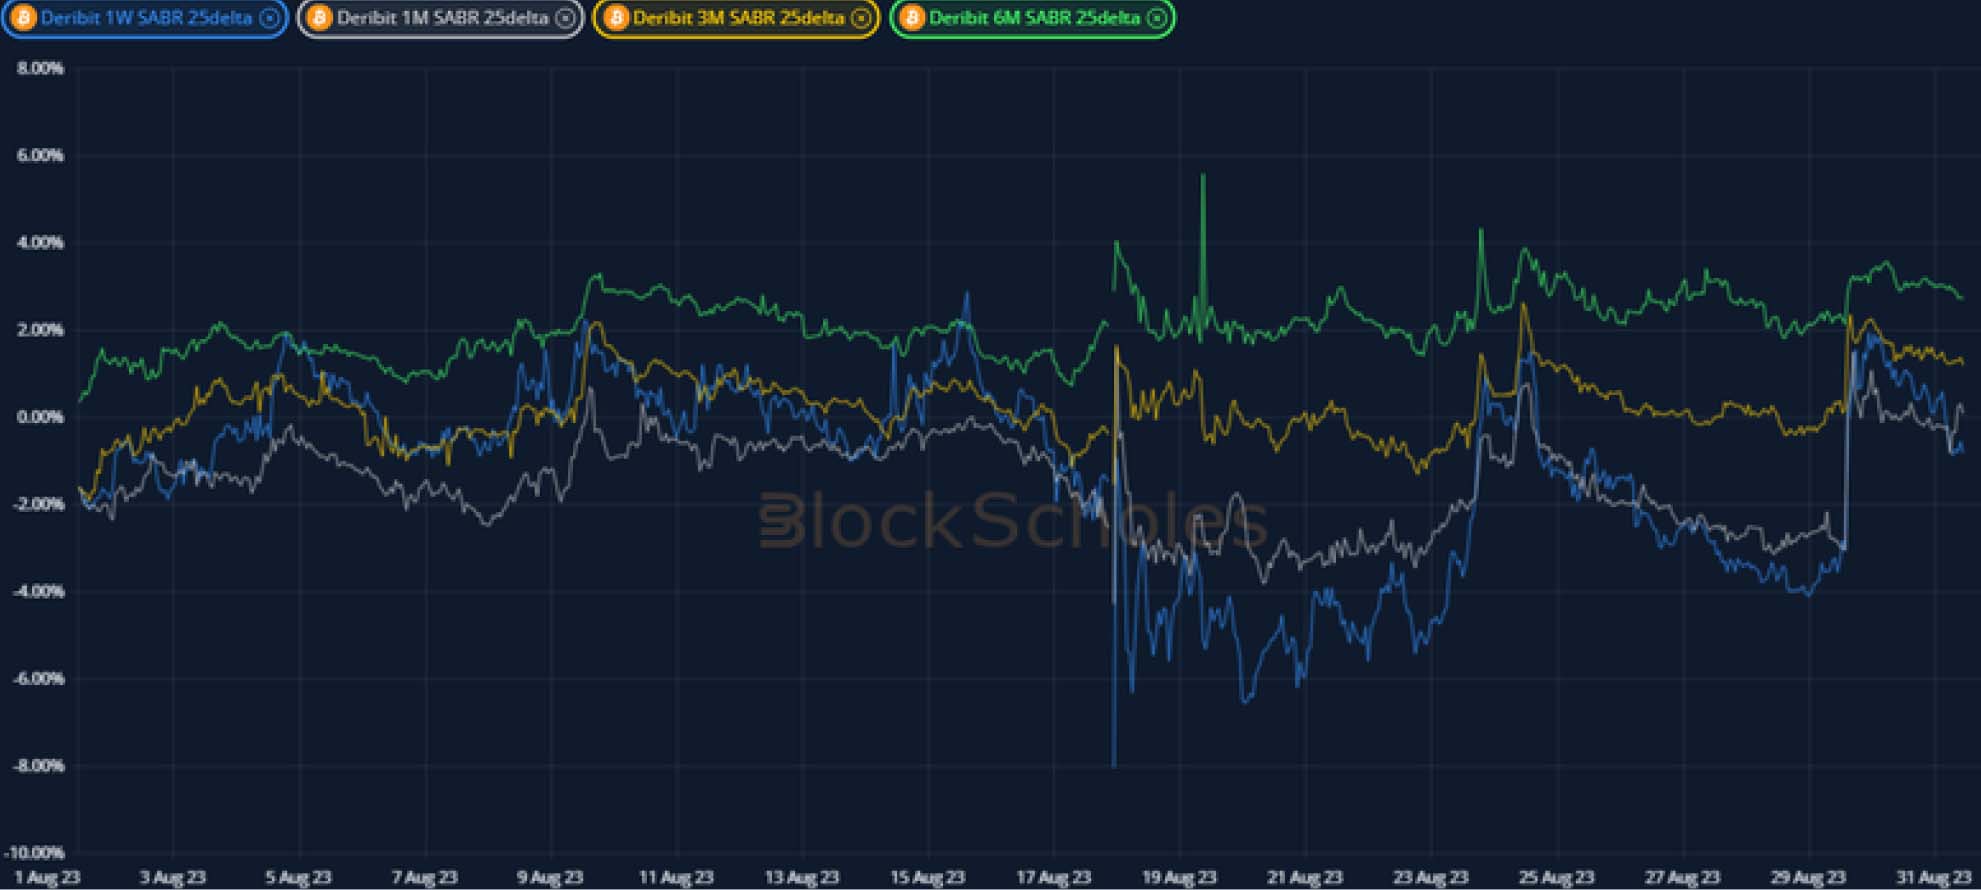
BTC Options

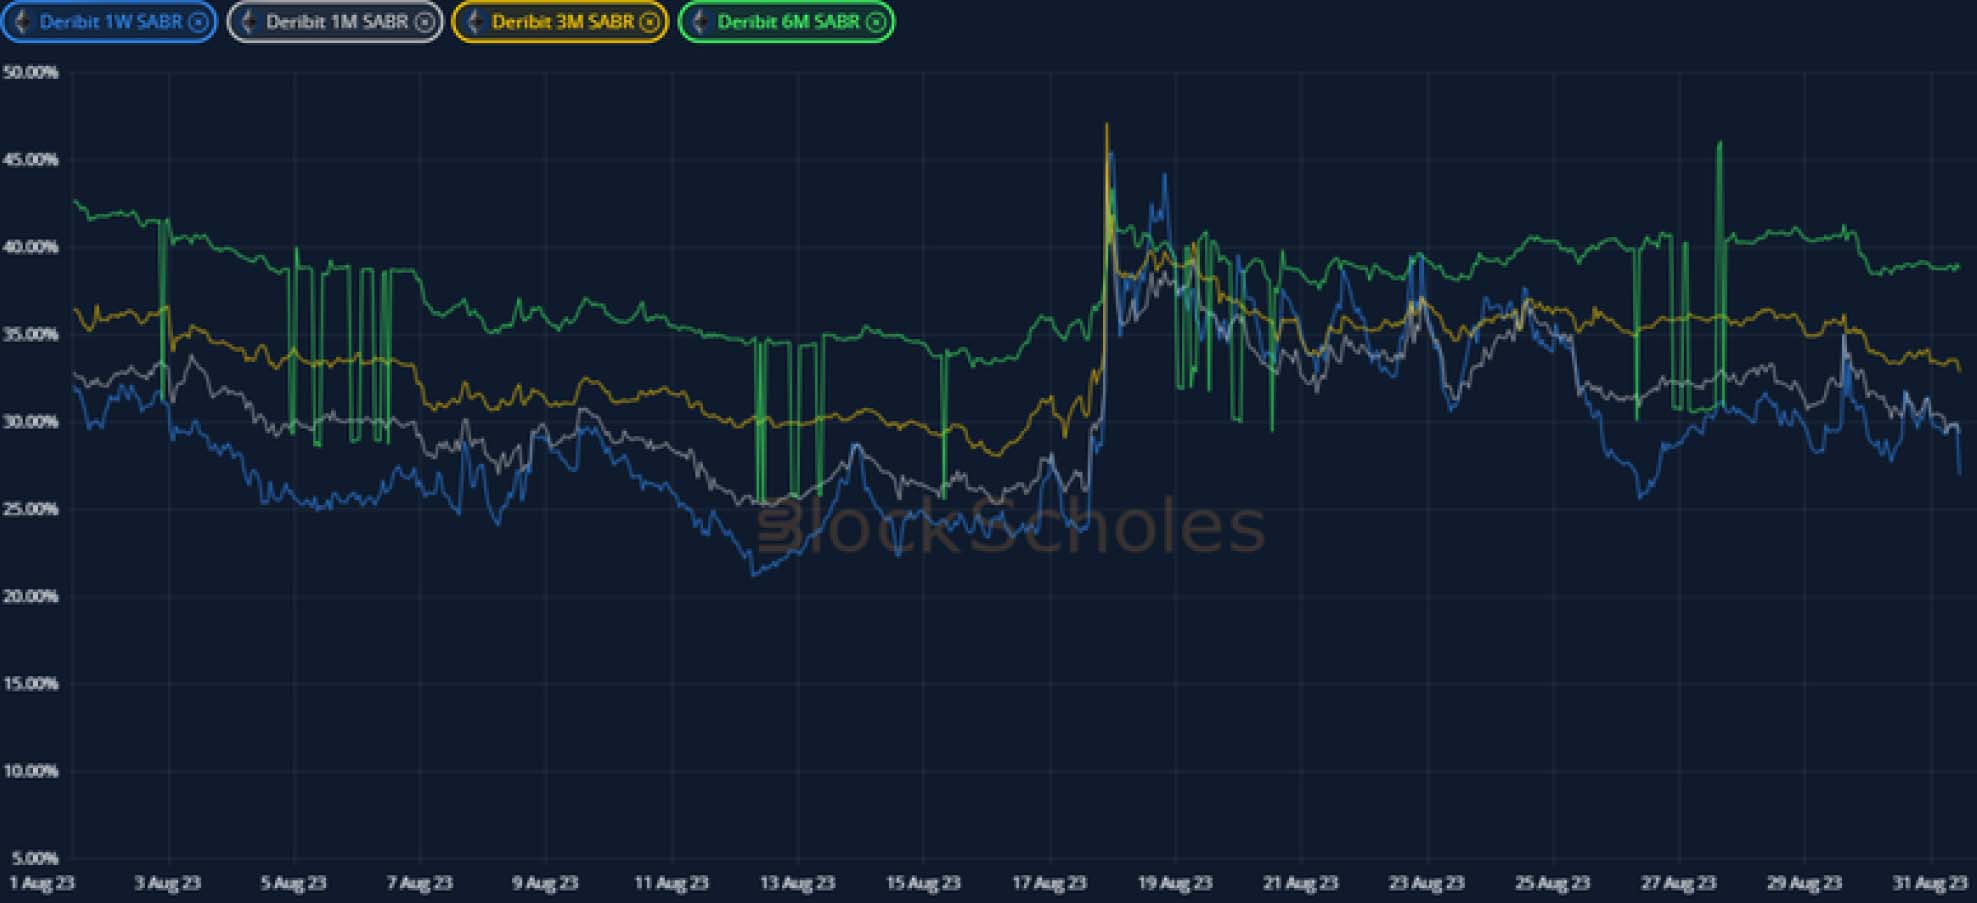
BTC SABR ATM IMPLIED VOLATILITY – has spiked upwards twice this month, but has struggled to sustain a rise above its historically low levels.

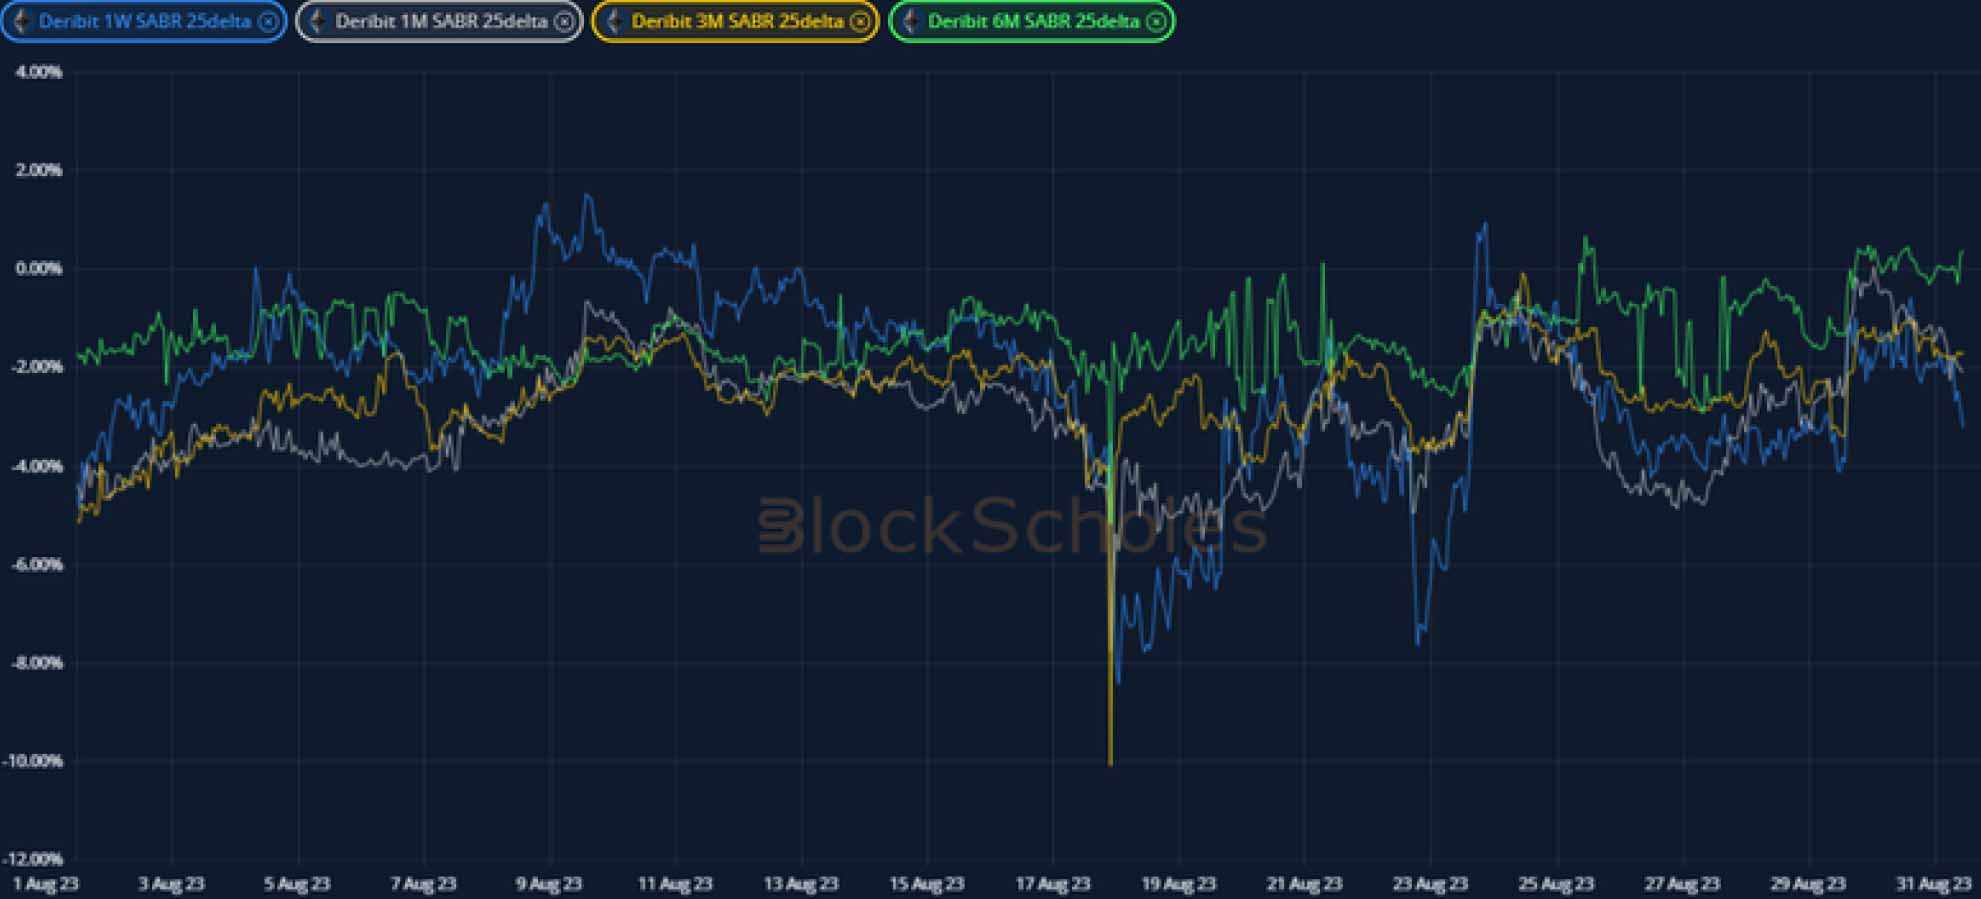
BTC 25-Delta Risk Reversal – has continue to trade with significant volatility, recovering strongly during this week’s re-rally to the $27K level.
ETH Options
ETH SABR ATM IMPLIED VOLATILITY – remains below that of BTC’s options, but has traced similar paths throughout the past month.
ETH 25-Delta Risk Reversal – does not enjoy the same positive sentiment as BTC’s surface and continues to reflect a skew towards OTM puts.
Volatility Surface
BTC IMPLIED VOL SURFACE – Highlights the increase in implied volatility over the last week in response to the retrace of the spot market selloff, with a rise most prominent at longer-dated expiries.
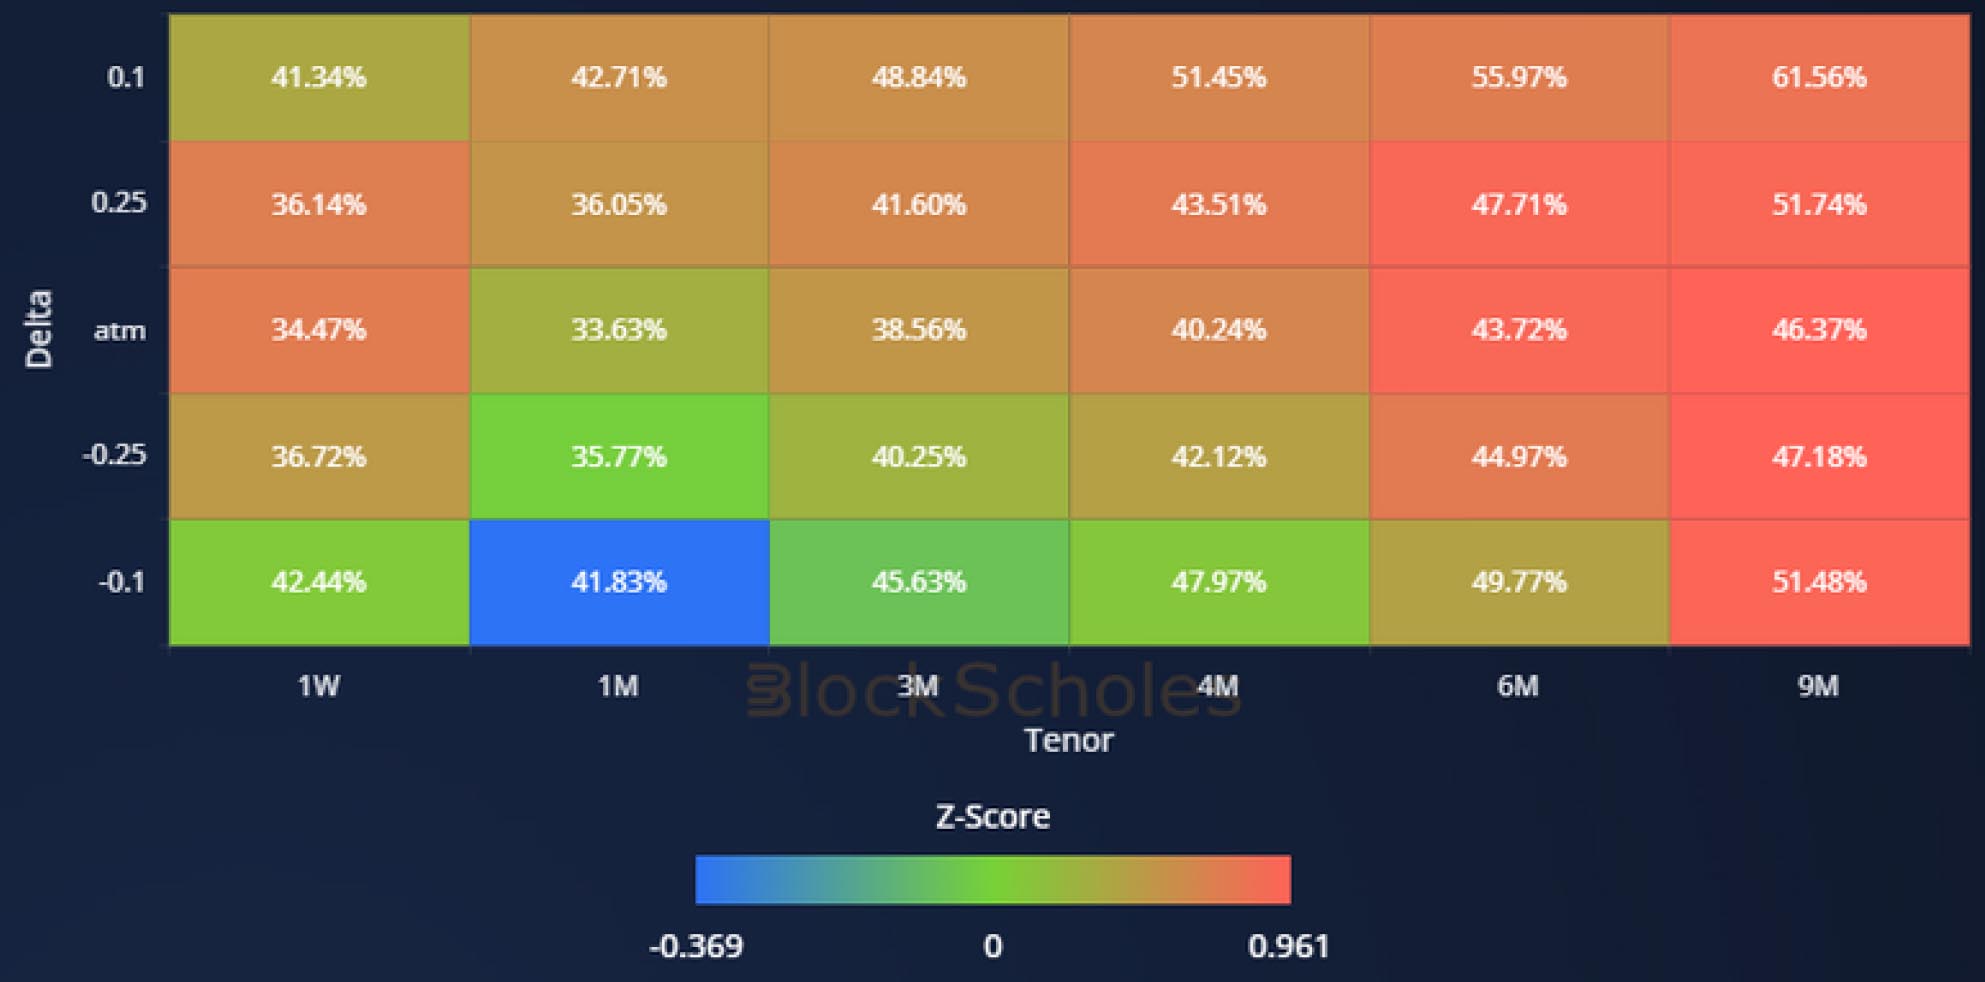
ETH IMPLIED VOL SURFACE – shows a similar but smaller rise in implied volatility that leaves ETH’s surface distinctly below BTC’s.

Z-Score calculated with respect to the distribution of implied volatility of an option at a given delta and tenor over the previous 30-days of hourly data, timestamp 10:00 UTC, SABR smile calibration.
Volatility Smiles
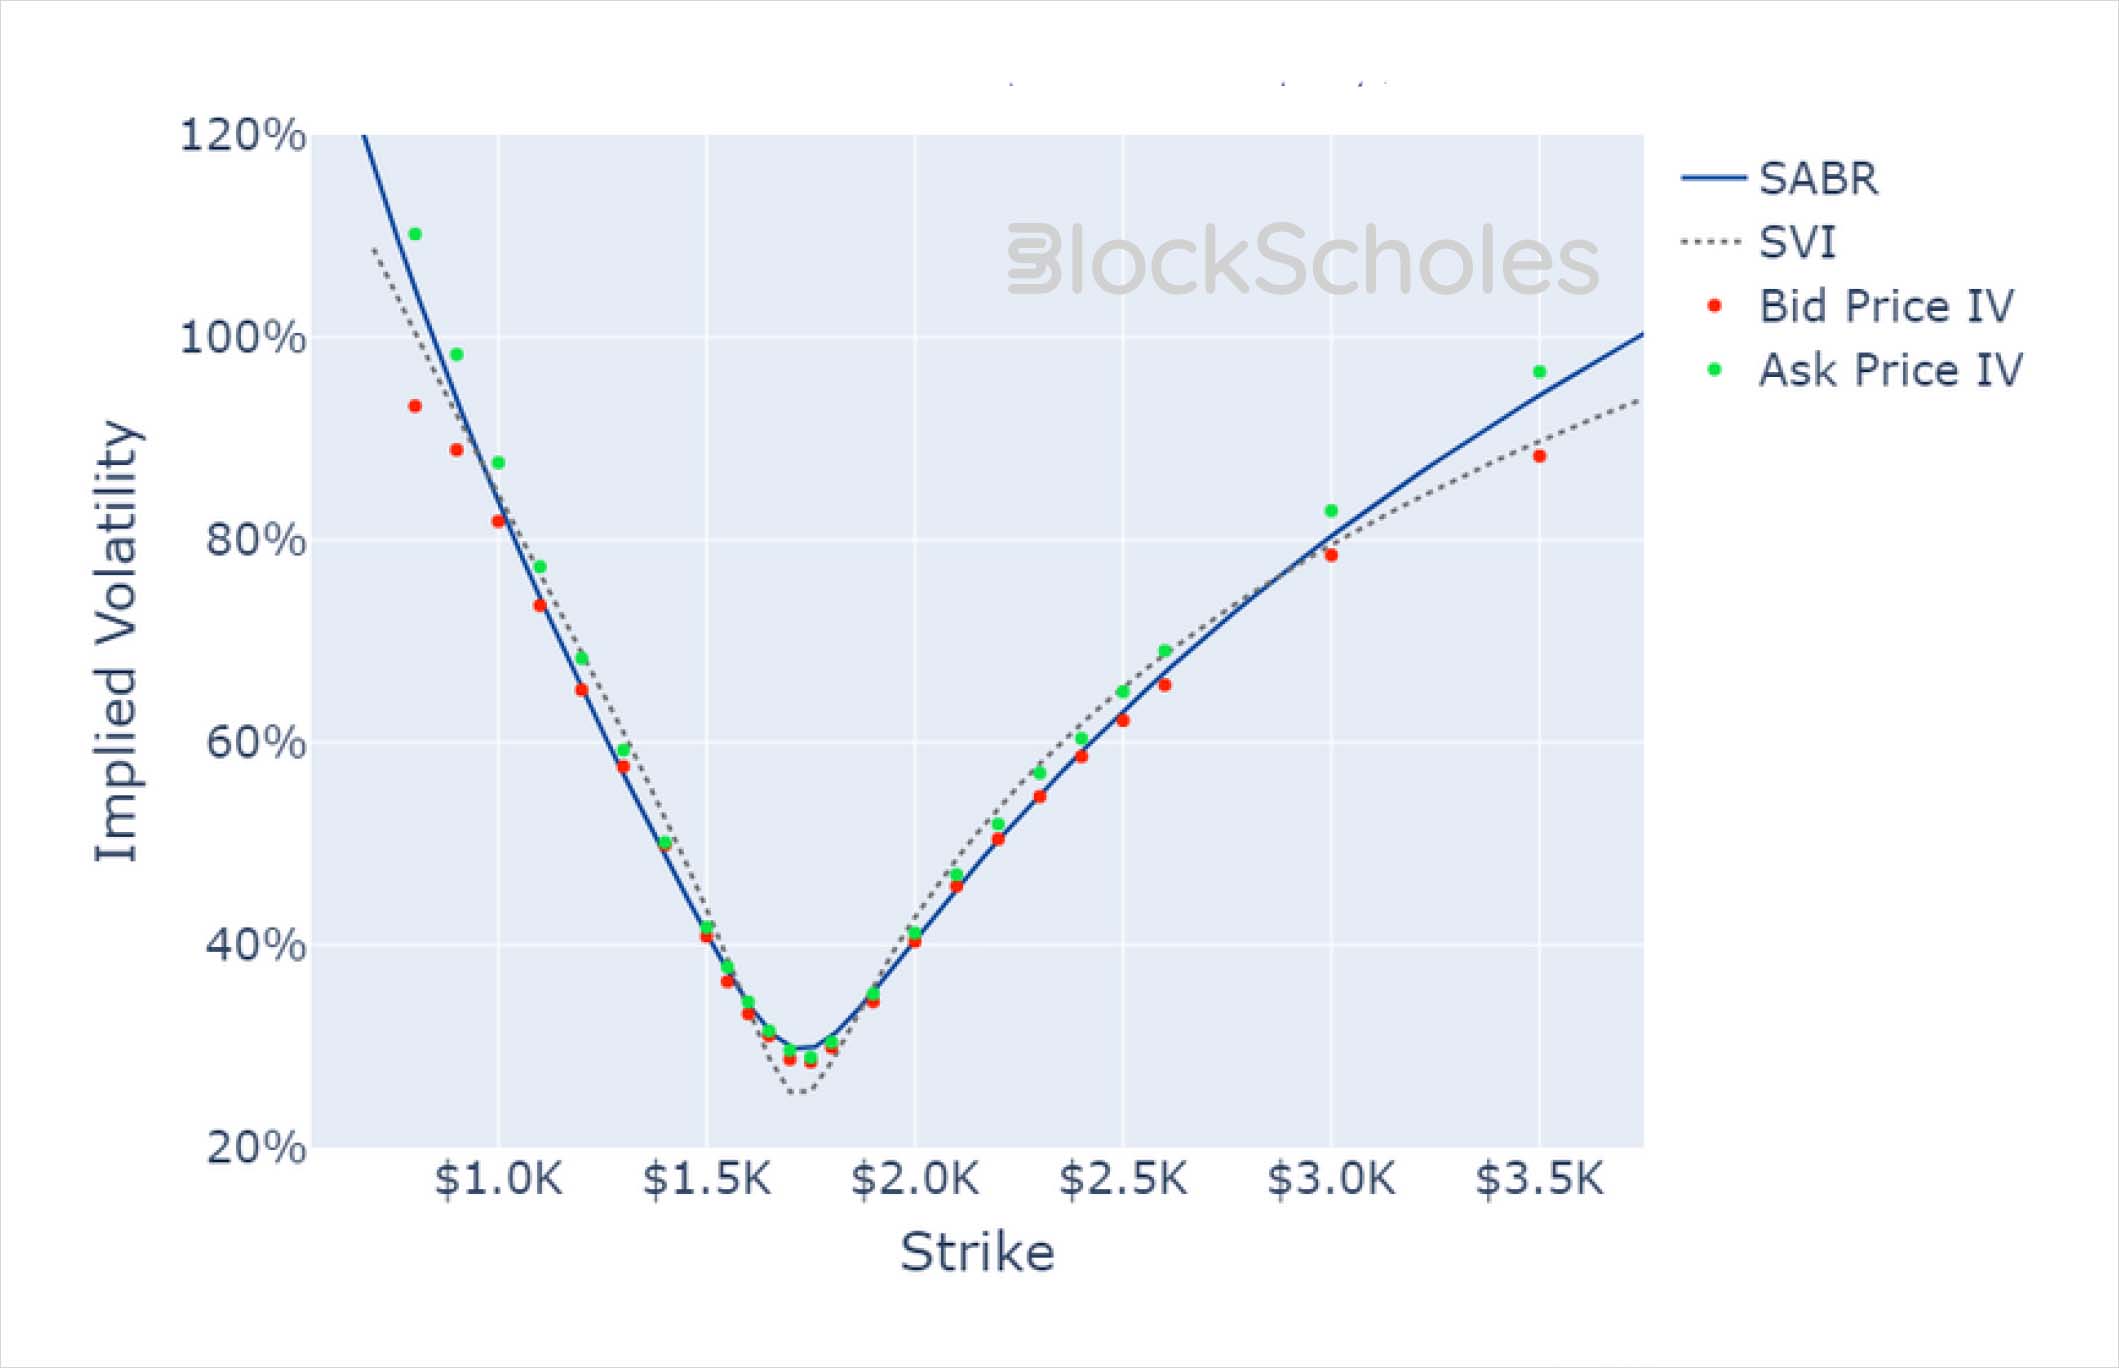
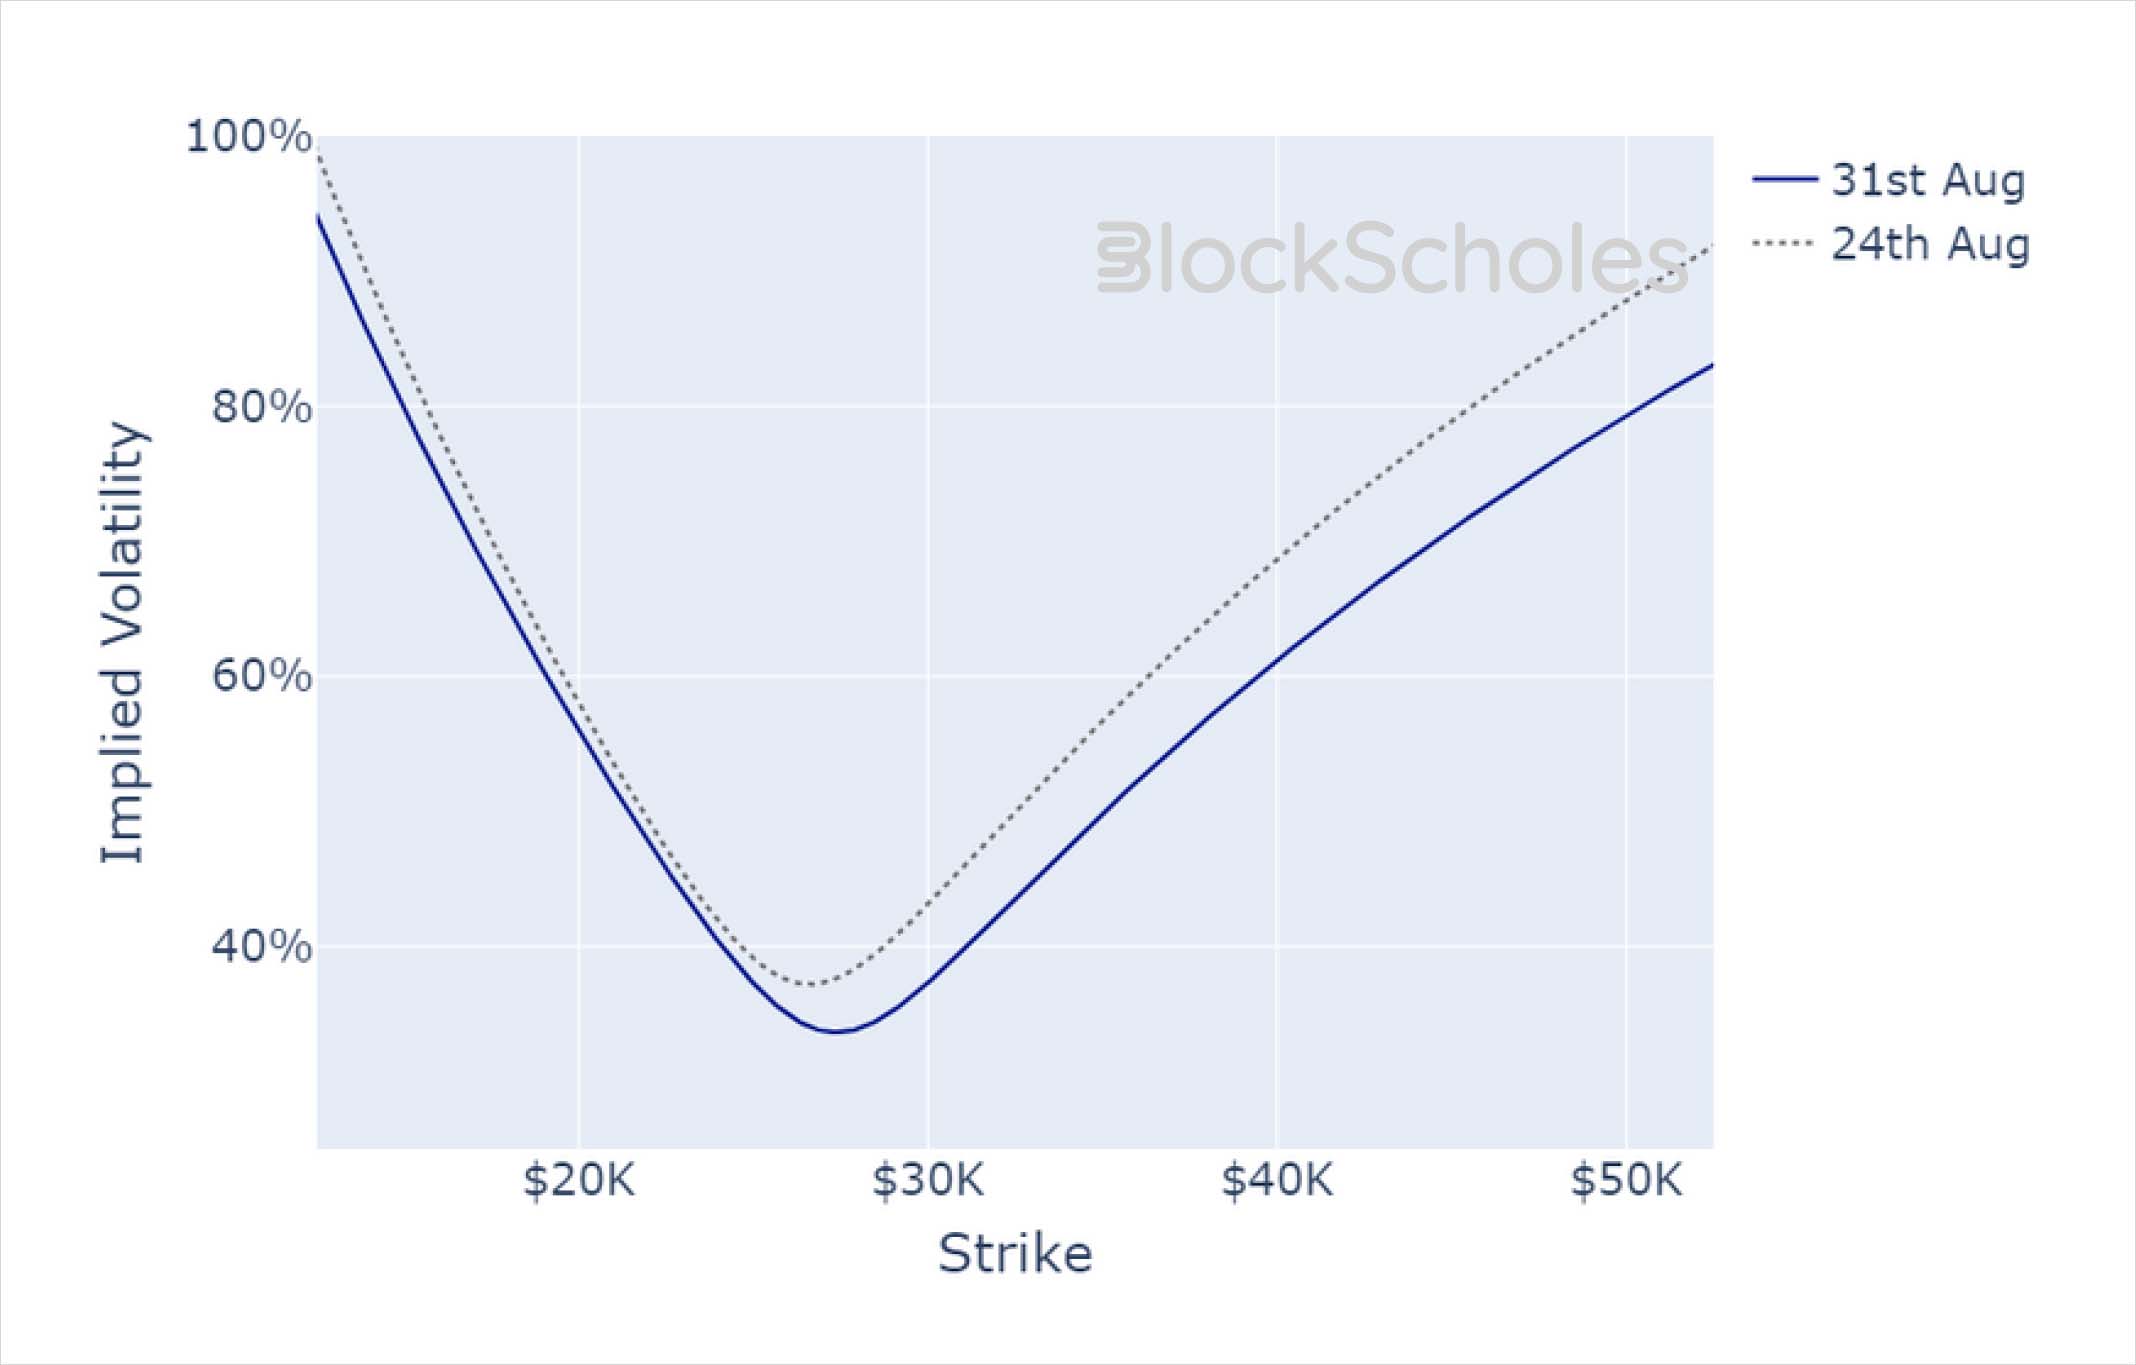
BTC SMILE CALIBRATIONS – 29-Sep-2023 Expiry, 10:05 UTC Snapshot.

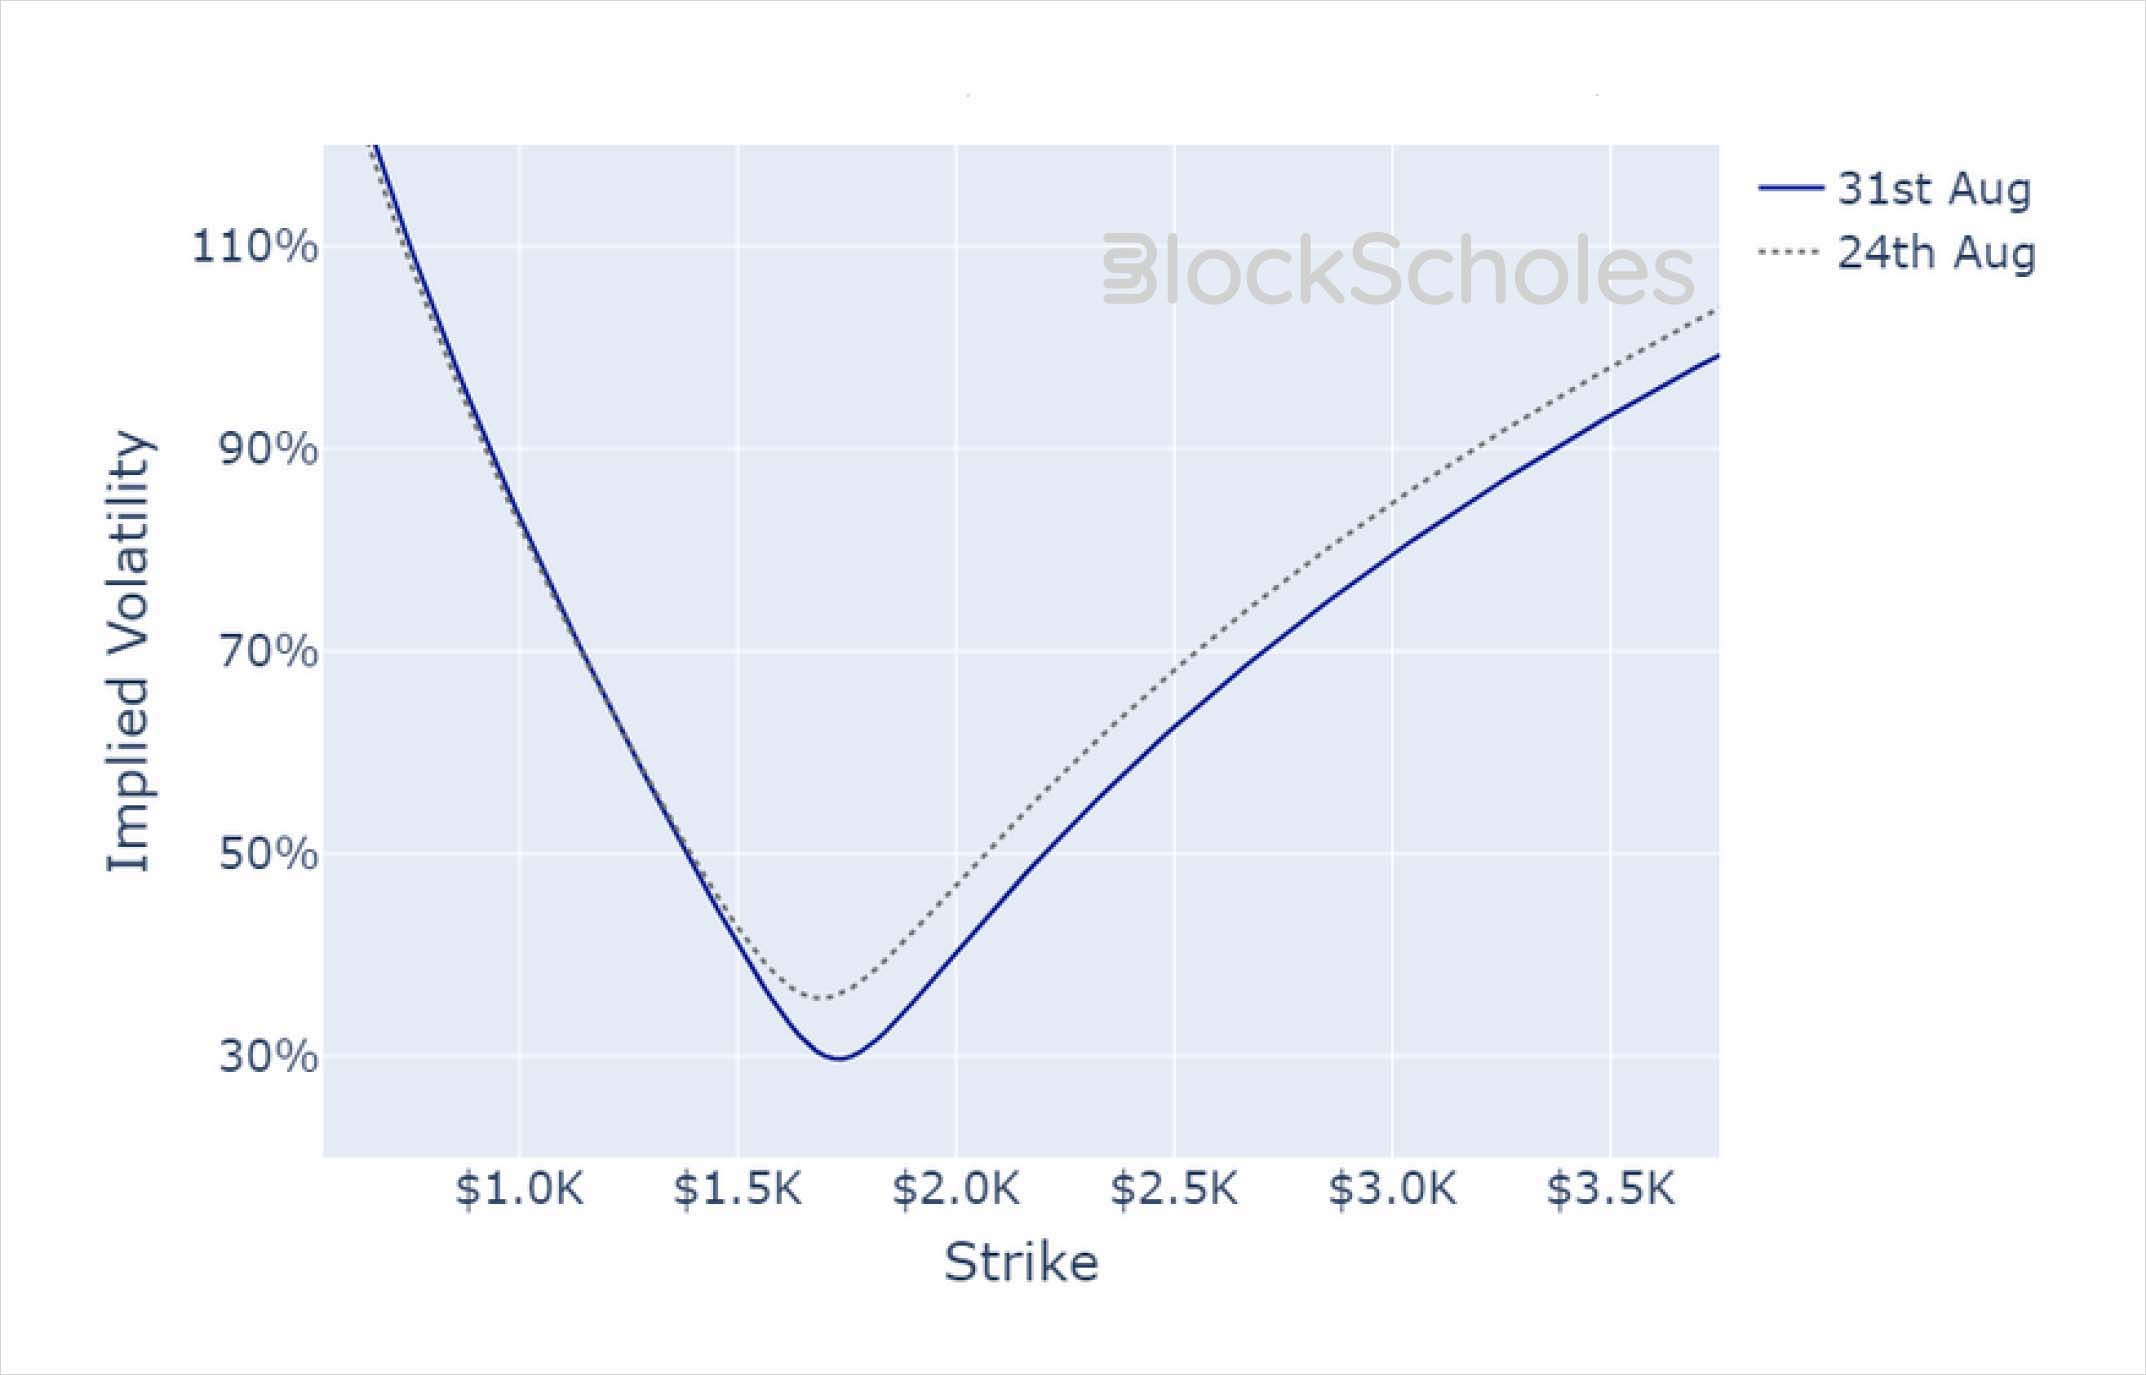
ETH SMILE CALIBRATIONS – 29-Sep-2023 Expiry, 10:05 UTC Snapshot.
Historical SABR Volatility Smiles
BTC SABR CALIBRATION – 30 Day Tenor, 10:05 UTC Snapshot.
ETH SABR CALIBRATION – 30 Day Tenor, 10:05 UTC Snapshot.
AUTHOR(S)
Trading with a competitive edge. Providing robust quantitative modelling and pricing engines across crypto derivatives and risk metrics.