

The delivered volatility of both BTC’s and ETH’s spot prices has collapsed despite a large pickup in the delivered volatility of other risky assets. In turn, the implied volatility of both crypto-assets looks incredibly cheap. That cheap pricing looks even more extreme given the historic relationship between BTC’s delivered and implied volatility.
Risky Assets
Throughout the past year of turbulent market conditions and sharp selloffs, both BTC and ETH have moved in lock-step with equities as all risky assets have reacted sensitively to increased market volatility. This has occurred in both directions, with both asset classes reporting concurrent gains and losses.
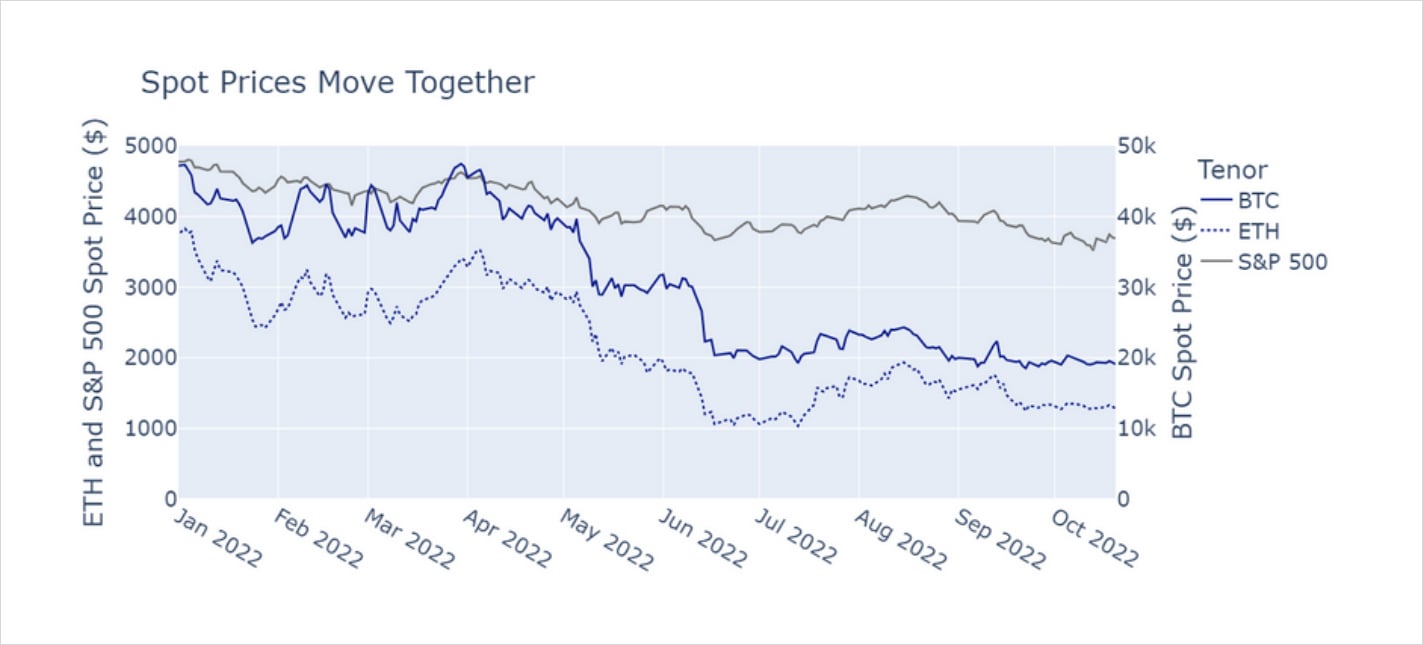
Figure 1 Daily history of BTC (blue solid), ETH (blue dotted), and the S&P 500 (grey) spot prices since Jan 2022. BTC and ETH Source: Block Scholes, S&P 500 Source: yahoofinance.com
Plotting the delivered volatility of both crypto-assets alongside the delivered volatility of the S&P 500 (Figure 2) shows that the standard deviation of crypto-assets returns is also correlated to that of the S&P 500. Here, we measure delivered volatility as the rolling 30-day estimate of the standard deviation of the log-returns of each asset. Not only have crypto-assets often moved in the same direction as equities throughout 2022, they have also moved with similar volatility.
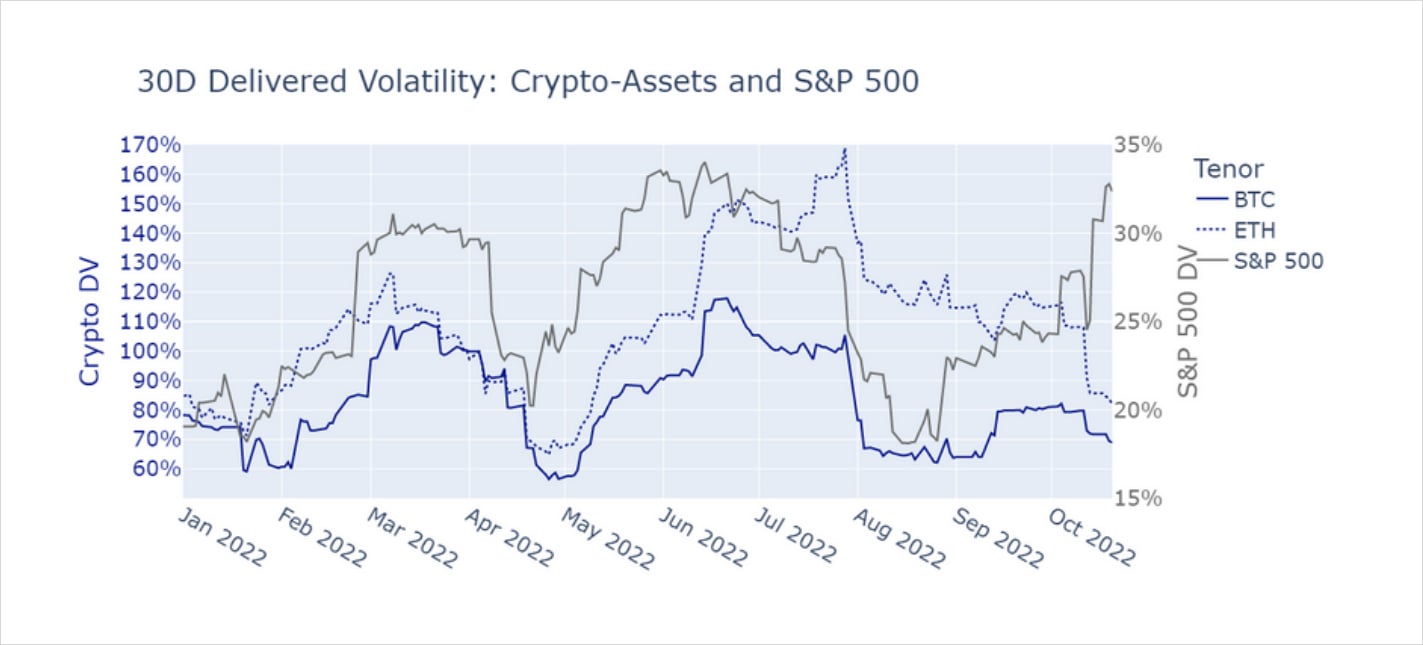
Figure 2 30-day estimate of the standard deviation of log-returns of BTC (blue solid), ETH (blue dotted), and the S&P 500 (grey) spot prices since Jan 2022. BTC and ETH Source: Block Scholes, S&P 500 Source: yahoofinance.com
Crypto’s Low Volatility
Beginning in mid-September, however, the delivered volatility of equities has increased monotonically whilst both BTC and ETH have stayed remarkably range-bound, just as they did in the first three months of this year. That leaves the most recent data point (plotted with a red cross in Figure 3a) far below the trend established since the beginning of 2022. Whilst recording a weaker relationship, Figure 3b shows that the current levels of BTC’s implied volatility is also at incredibly low levels given the current position of the VIX (the S&P 500’s volatility index).
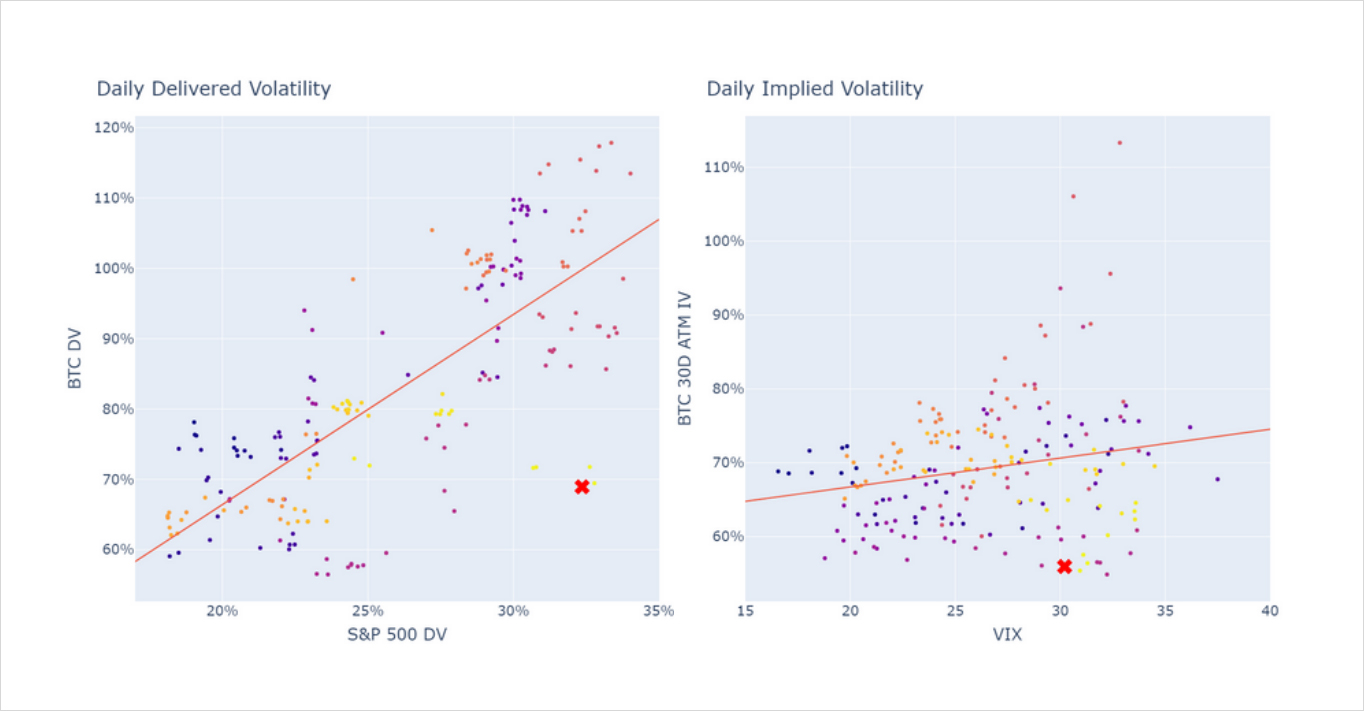
Figure 3a (right): Regression of daily delivered volatility (defined in Figure 2) of S&P 500 and BTC’s spot prices. Figure 3b (left): Regression of daily BTC 30D ATM implied volatility against the VIX. Darker colours indicate older data, with the latest timestamp (20th October 2022) plotted with a red cross. BTC and ETH Source: Block Scholes, S&P 500 and VIX Source: yahoofinance.com
The low levels of crypto-asset’s delivered vol have caused the volatility implied by the at-themoney options of both BTC and ETH to collapse, by nearly 20 and 35 vol points to just 56% and 70% respectively. The fall to year-long lows has happened despite the VIX trading at its highest levels of the year.
Even Lower Still
Whilst figures 3a and 3b show that both the delivered and implied volatility of BTC are remarkably low compared to their S&P 500 counterparts, Figure 4 shows that the options market is pricing BTC implied vol even lower than we would expect compared to BTC delivered vol. This chart highlights the extremity of the current (plotted again with a red cross) low levels of implied vol in the context of its historical relationship to delivered vol.
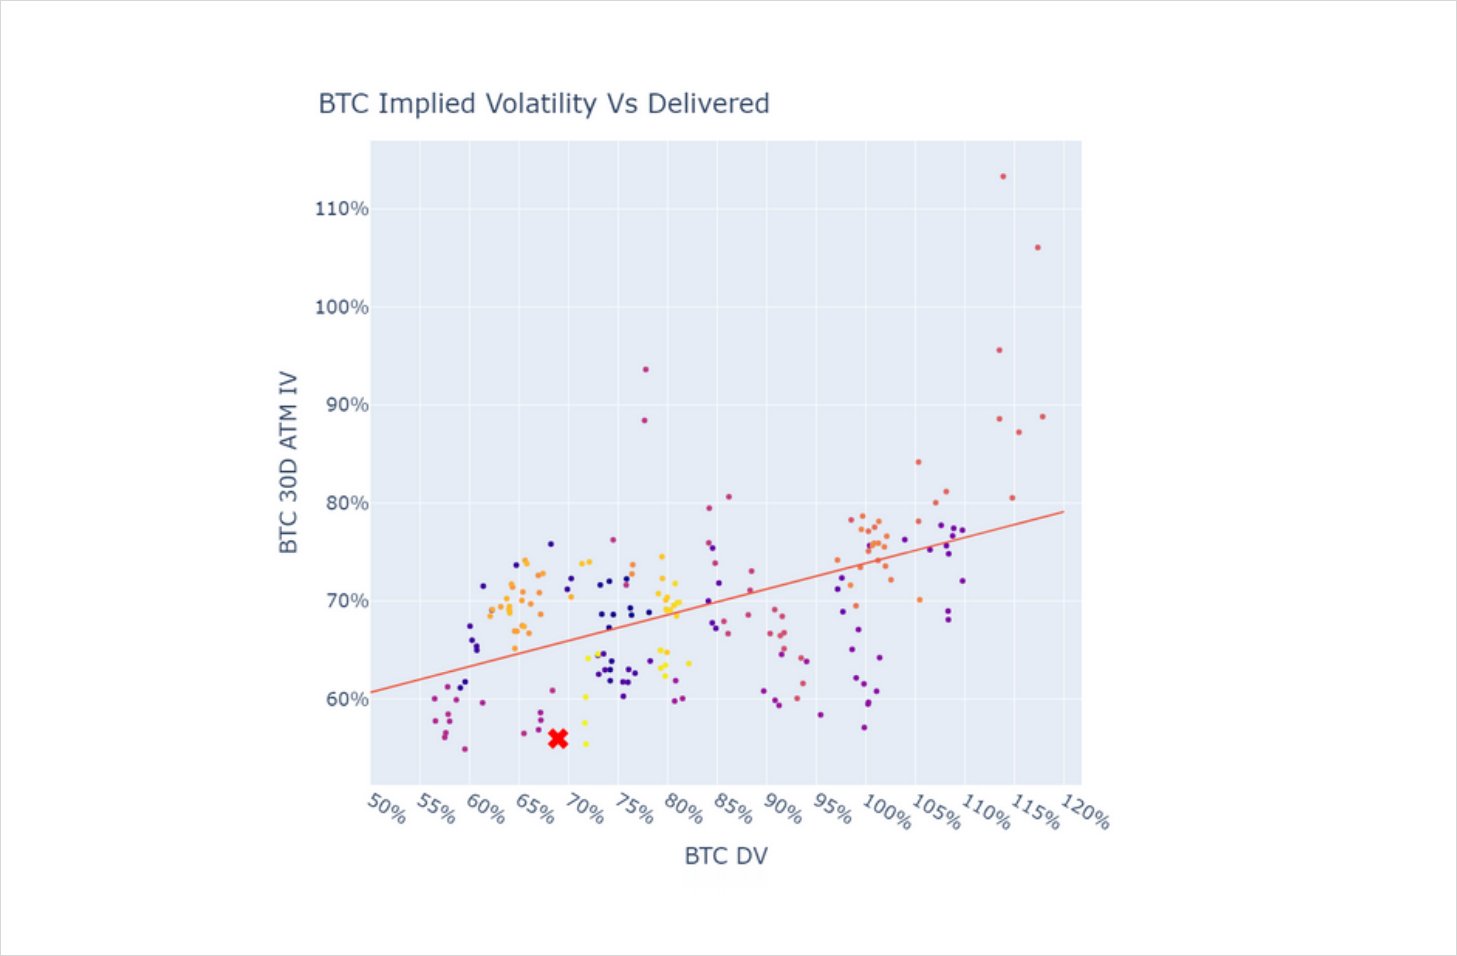
Figure 4: Regression of BTC’s 30D ATM implied volatility against the daily delivered volatility (defined in Figure 2) it’s spot prices. Darker colours indicate older data, with the latest timestamp (20th October 2022) plotted with a red cross. Source: Block Scholes
We find it strange that the volatility of BTC and ETH vols would eschew its correlation and fall so drastically whilst volatility in equities continues to be elevated. We find it stranger still implied vol is now traded even further below a dropping delivered vol. We see this unusual behaviour resolving in one of two ways:
- The correlation of crypto’s delivered volatility to that of risky assets is reinstated and crypto’s implied volatility will rise according to its positive correlation. In this case, the current level of implied volatility looks remarkably cheap.
- Cryptoassets become decoupled from other risky assets (like equities) and are no longer as sensitive to macro drivers as they have been throughout 2022. We believe this case is a strong bullish signal for crypto-asset spot prices as BTC and ETH begin to forge their own narratives independently from equities once again.
AUTHOR(S)
Trading with a competitive edge. Providing robust quantitative modelling and pricing engines across crypto derivatives and risk metrics.