

Options are one-way bets with a set expiration date, which leads to a set of variables known as the “Greeks” affecting the value of the options.
- Delta: Measures the effect on options prices due to changes in the underlying price.
- Gamma: Measures the change in Delta itself, due to changes in the underlying price.
- Rho: Measures a change in option value due to changes in interest rates.
- Theta: Measures a change in option value due to time decay.
- Vega: Measures a change in option prices due to changes in implied volatility.
Even though we have all these “Greeks” what truly determines option prices are supply and demand.
The way this supply and demand effect is reflected in options prices is through implied volatility (IV), the only variable that is market determined.
Since implied volatility is market determined and directly comparable to options with different strike prices and expiration dates, it is often studied by traders to find relatively cheap and expensive options.
Realized volatility is the actual price volatility that BTC or ETH exhibits. Since options are one-way bets more volatile assets should have more expensive options, due to the higher chances the undelying will become far in the money (ITM).
As both Ethereum and Bitcoin have rallied in the past 30 days, we’ve seen an explosion higher in both implied volatility and realized volatility.

(ATM implied volatility chart for ETH Sept. 25th, 2020 expiration)
Although implied volatility has drastically increased, as seen above, not all option implied volatilities are affected by the same proportionality. This disproportionality is especially true when market participants exhibit strong biases, such as expecting a sharp and extended rally.
Looking at the volatility skew for Sept. 25th, 2020 expiration, measured as IV for out of the money (OTM) calls that have ~(+25) delta minus IV for OTM puts that have ~(-25) delta, we can see that OTM calls were much more in demand. This excess demand for OTM calls translates into a skew that prices Sept. calls about 15 IV points higher than puts with a similar delta.
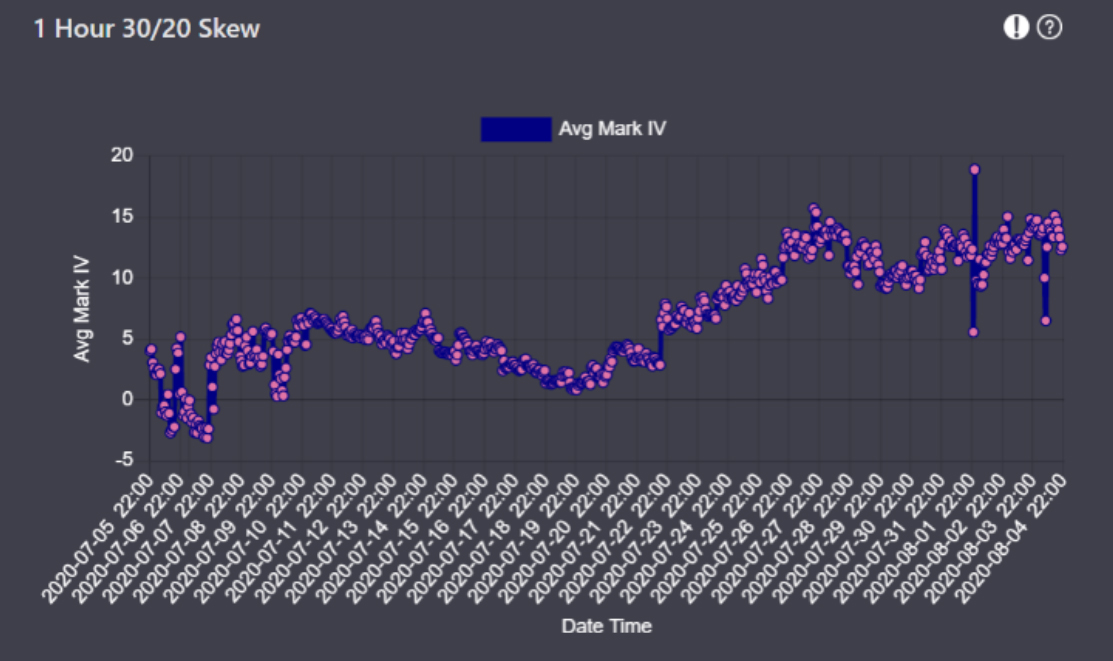
(Skew chart for ETH Sept. 25th, 2020 expiration)
This pheonomenon can be even more pronounced for far OTM options. Continuing with our Sept. 25th, 2020 expiration cycle we can see that 880 calls, the farthest strike out, saw a huge explosion of open interest during the ETH price rally.
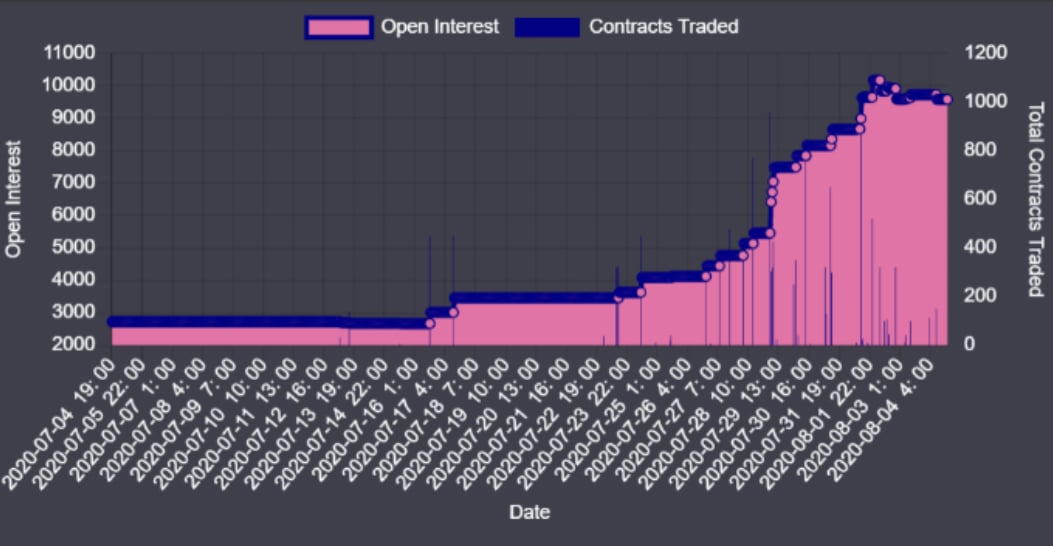
(Open interest chart for ETH Sept. 25th, 2020 expiration 880 call)
Lastly, using the implied volatility trading profile, a trader can inspect the distribution of implied volatilities this particular contract traded during this time period. This will give a trader a good idea of what IV has been the recent equilibrium.

(IV trader profile chart for ETH Sept. 25th, 2020 expiration 880 call)
Combining all these elements together a trader can understand the extent of the current move and gauge which levels are interesting to participate in.
Options provide traders a lot of flexibility.
Using multiple options together can isolate a statistical edge by combining cheap and expensive options into one multi-legged position.