

“Good expectations within the market” is one of the important reasons for the latest rebound in the crypto market. However, in the absence of significant improvement in liquidity conditions, especially in the case that the “crypto balance sheet reduction” has not ended, the overall sound performance of crypto assets may not be sustainable, and “sector rotation” may be the main feature of the crypto market in 2023H2. Fortunately, BTC’s performance may be more robust under macro factors, regulation, and institutional preferences.
Is the Dawn Coming?
BTC’s rally seems a bit unexpected. In theory, investors should not have more optimism at a time when the SEC regulatory turmoil has just passed and the macro environment has not improved. However, investors in the crypto market have waited too long for good news, and any news could be a catalyst for a rally.
Under the low liquidity, pushing up the price does not cost much. Therefore, under the influence of good news such as “giants are preparing to enter the crypto market” and “BTC spot ETF may be approved,” the price of BTC quickly rose. For HODLers, the simple “buy and hold” strategy has brought them gains several times higher than holding S&P 500 bulls. At the same time, Delta 1 bulls have also profited much from the rally. Even for the bears, due to the bullish mood, although the bear liquidation scale is more significant, did not reach a new high since Mar.
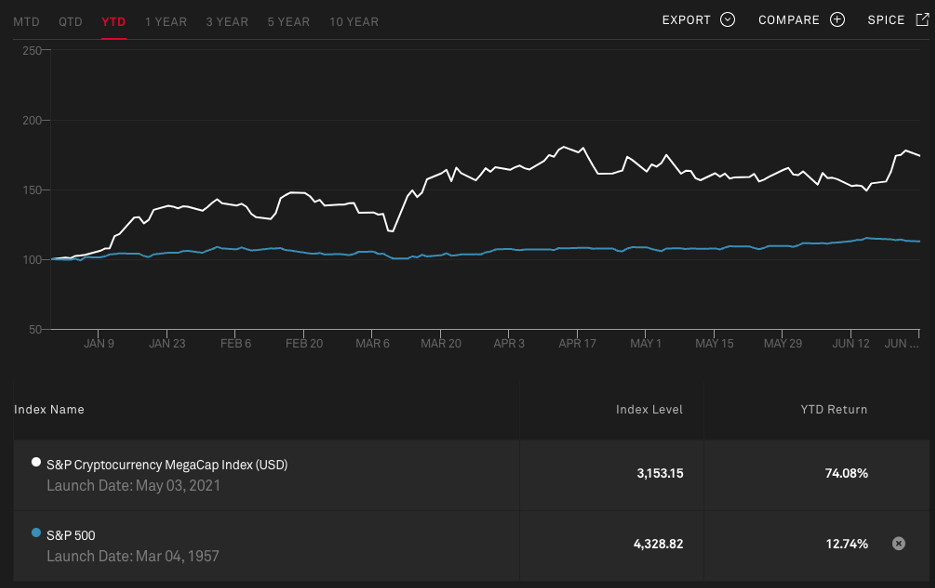
Movement of the S&P Cryptocurrency MegaCap Index and S&P 500 Index since 2023, as of Jun 28, 2023. Source: S&P Global
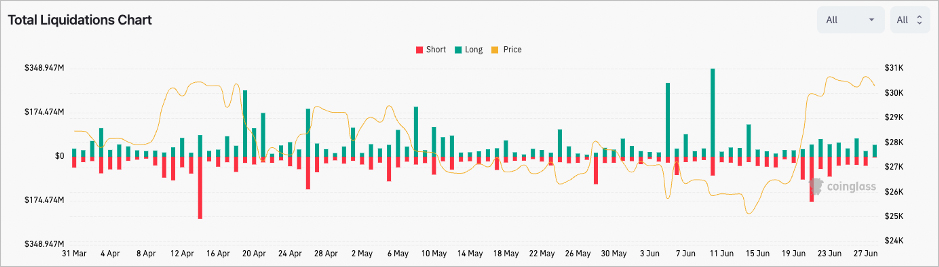
Change in the Delta 1 derivatives liquidation scale during 2023q2, as of Jun 28, 2023. Source: Coinglass
Investors’ optimism also flooded the options market. Driven by the price increase, the preference for call options has pushed the skewness of almost all BTC and ETH options above 0, especially for BTC. As the price rises, option sellers have become the most stressed group in the crypto market: many call options have become ATM, meaning they must continue to buy underlying assets as the price rises to hedge against price changes. Option sellers have become catalysts for price increases. Subsequently, more follow-up investors bought call options, increasing hedging pressure and prices.
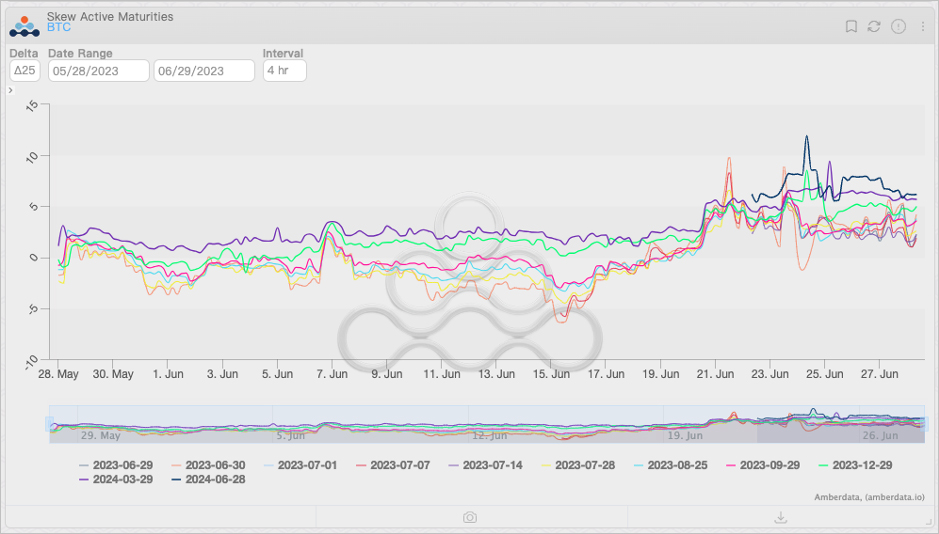
Change in skew of BTC options by maturities, as of Jun 28, 2023. Source: Amberdata Derivatives
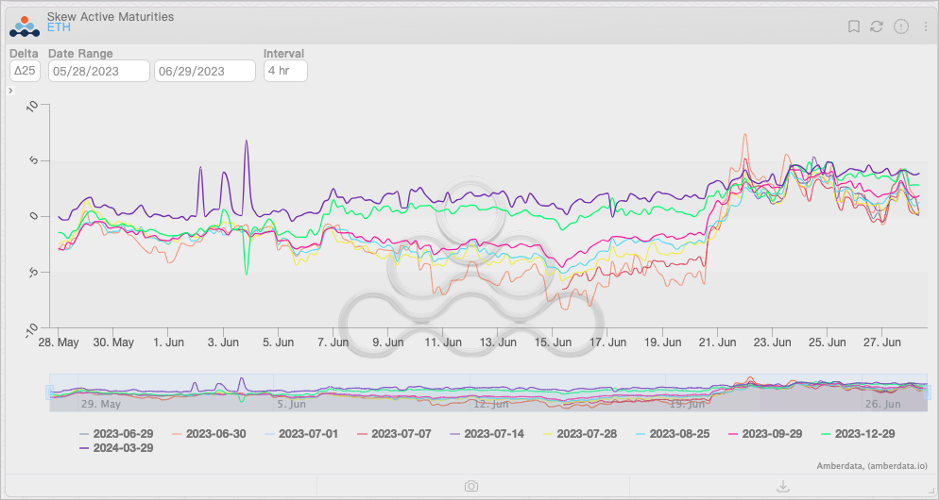
Change in skew of ETH options by maturities, as of Jun 28, 2023. Source: Amberdata Derivatives
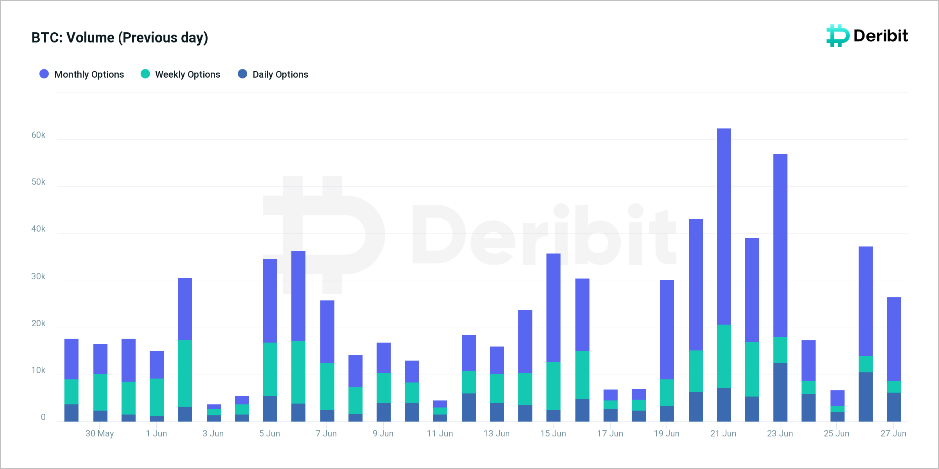
Daily trading volume of BTC options on the Deribit exchange, as of Jun 28, 2023. Source: Deribit Metrics
Many people are already anticipating the return of the bull market. Interest rates should be no longer higher than expected; inflation has fallen and is about to approach the Fed’s stated target of 2%. The endorsement of the world’s top asset managers is about to bring new liquidity to the crypto market. At the same time, the impact of regulation has made liquidity more concentrated in mainstream crypto assets such as BTC and ETH, which may push BTC and ETH to enter the “technical bull market” earlier.
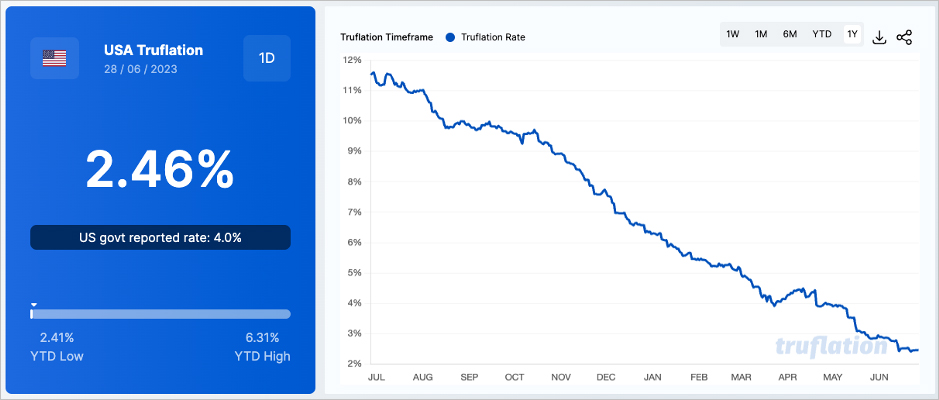
US real-time inflation, as of Jun 28, 2023. Source: truflation.com
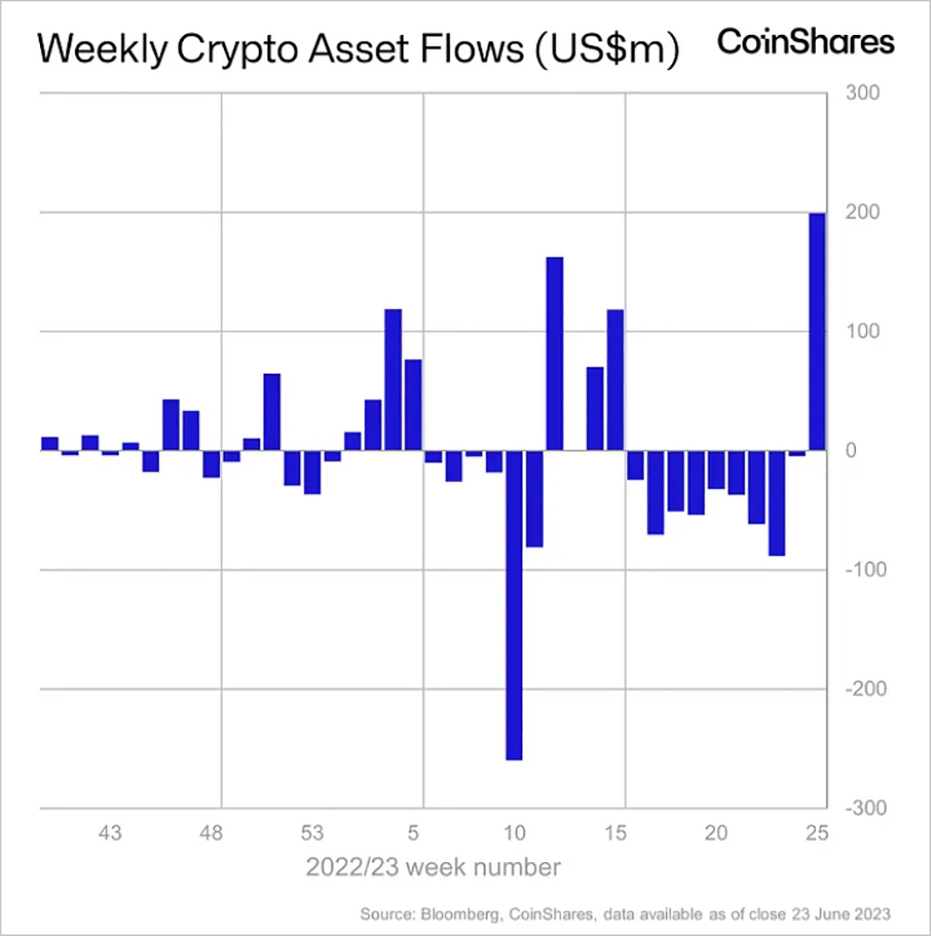
Weekly net inflow/outflow of funds from crypto asset management institutions, as of Jun 28, 2023. Source: Coinshares
However, the “return of liquidity” seems to be a debatable issue. Since the start of the bear market in 2022, the crypto market has experienced several brief price rallies but then slipped to lower price levels due to lower expectations and event shocks. So, will the latest rally be like previous recovery cycles, “like a meteor”?
“Crypto Balance Sheet Deduction” and Liquidity Redistribution
Let’s first take a look at stablecoins in the crypto market. As a medium of exchange between crypto assets and fiat currencies, stablecoins are regarded as “cash” within the crypto market. For any asset, cash liquidity is crucial: the overall amount of cash tied to the asset is directly related to the asset’s value, while changes in active cash liquidity directly affect the asset price, and the use of leverage further amplifies its influence.
For traditional markets, statistics on cash liquidity are more complex. In most cases, we can only get a rough estimate. Fortunately, due to the transparency of blockchain, we can relatively accurately measure the level of cash liquidity in the crypto market.
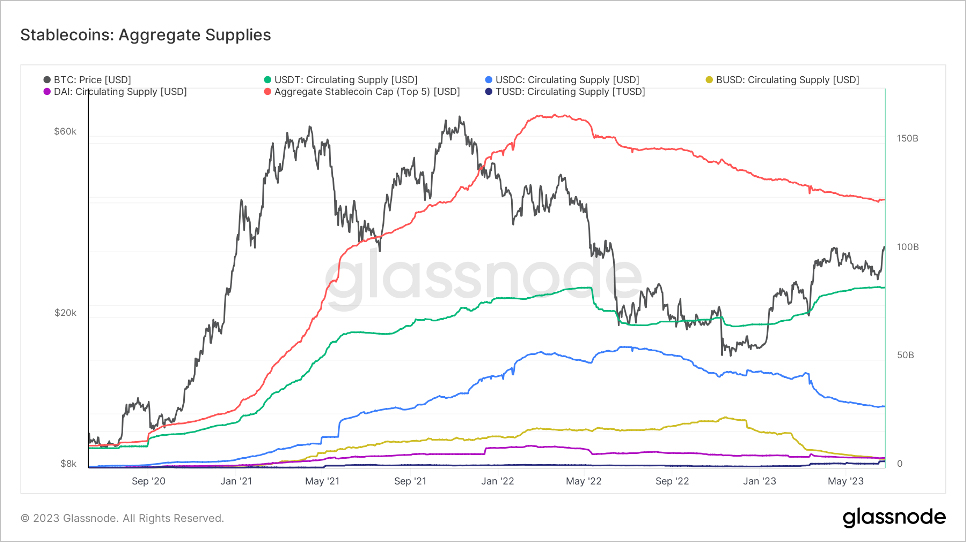
Changes in the aggregate supplies of stablecoins in the crypto market, as of Jun 28, 2023. Source: glassnode
It seems that the facts reflected in the chart of the overall cash liquidity level of the crypto market have deviated somewhat from investors’ expectations. In fact, the process of declining cash liquidity in the crypto market (also known as “crypto balance sheet reduction”) that began in Apr 2022 has not been interrupted by a brief rally in prices, meaning that the current price level lacks sufficient liquidity support, and any shock may lead to profit-taking.
So, where did the impetus for the latest rally come from? Internal liquidity redistribution, rather than external liquidity entry, is the more likely source of “rally power.” The reserves of stablecoins on exchanges reveal this secret to us. Generally speaking, a decline in in-house stablecoin reserves means that investors are more inclined to exchange crypto assets for cash liquidity, driving down the price of crypto assets. In contrast, a rise in stablecoin reserves means a possible buying flow and a price rise.
Since mid-Jun, the reserves of stablecoins in major crypto exchanges have rebounded significantly, and at the same time, they have brought about a rebound in the market. Unlike in Mar, the inflow of safe-haven funds in Mar did not affect the downward trend of internal liquidity in the crypto market, which external funds mainly drove the rally. Meanwhile, the market in Jun was most likely caused by internal funds in the crypto market. Their buying promoted the rise in the prices of crypto assets such as BTC and ETH.
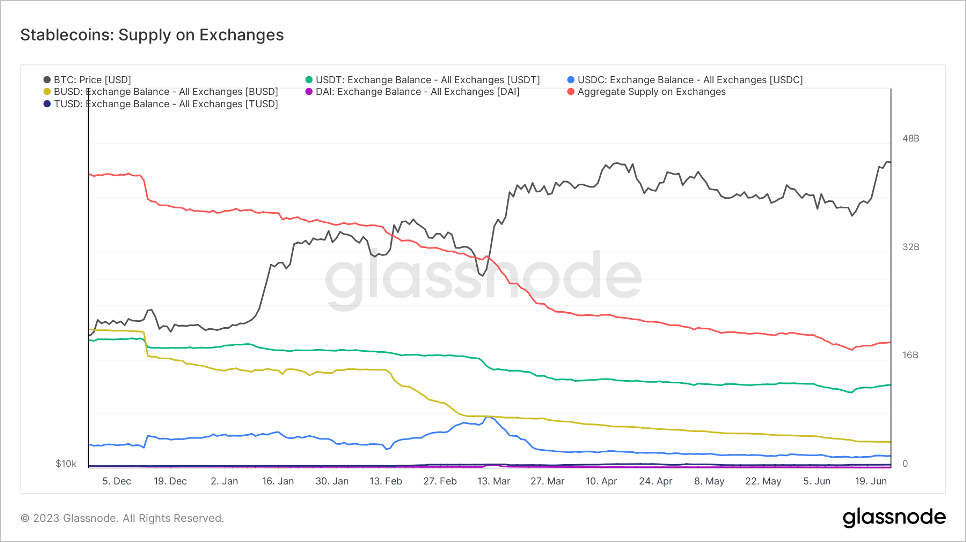
Change in the supply of stablecoins on exchanges, as of Jun 28, 2023. Source: glassnode
In addition, the change in the proportion of coins’ market capitalization also reflects the change in the proportion of liquidity allocation. At present, BTC occupies 50% of the crypto market cap. At the same time, the proportion declined to vary degrees in mid-Jun for other cryptos, whether ETH, stablecoins, or altcoins. Considering that external liquidity has not yet returned to the crypto market on a large scale, from a compliance perspective, BTC is undoubtedly more compliant than other crypto assets, which promotes investors to convert other crypto assets into BTC.
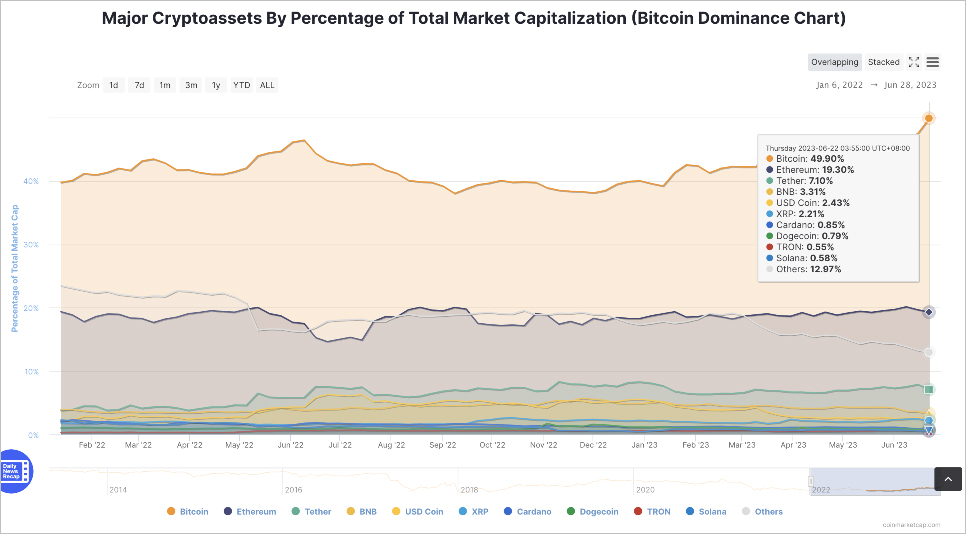
Bitcoin dominance chart, as of Jun 28, 2023. Source: CoinMarketCap
To sum up, BTC’s rise has come at the expense of the liquidity of most other crypto assets, which also partly explains why ETH and even many altcoins have not performed as well as BTC since the beginning of this year.
However, the rebound from liquidity redistribution is not a “free lunch.” What is the cost?
Pin Risk
In the short term, BTC’s rally appears to be one of the signs that the market is starting to turn around. But the good long-term performance of any market cannot be separated from sufficient liquidity support. Internal liquidity redistribution provides limited support; moving money back and forth between two bank accounts does not increase your total wealth. However, given that most assets in the crypto market are tied to one or more derivatives, the redistribution of internal liquidity is still a source of risk, for it may affect trading behavior in risky markets.
The “Pin risk” is one of the risks implied by liquidity redistribution. Market makers have sold many call options around the strike of $30k, which have become ITM. It doesn’t seem to matter; most market makers will use delta hedging tools to control their directional exposures.
But we can’t ignore that the speed of delta movement, or gamma, also significantly impacts the hedging behavior of market makers. Recall the basics in the Options 101 course: Gamma is the rate of change of delta; it’s highest for at-the-money options. As the expiration date gets closer, the gamma increases non-linearly, which means that the delta will change faster and faster as the option expiration date approaches. When the delta changes slowly, the hedging size of the market maker within a certain frequency is relatively small. Still, when the delta changes rapidly, the market maker’s hedging frequency and size will increase accordingly.
In situations where liquidity levels are low, frequent buying and selling by market makers can significantly impact prices. Of course, market makers don’t sit still; they control gamma exposure lower than risk control thresholds through strategies such as synthetic futures (in fact, they are already doing so). But market makers may have no choice in a sudden price move (such as crypto whales’ sell-off); they can only follow whales’ steps to reduce gamma exposure.
Since gamma exposure will become extremely large before the expiration date, the scale of the sell-off caused by hedging gamma risk will be considerable. More than 40% of options are about to expire on Jun 30, and the current dollar gamma of BTC options has reached over $100m and is concentrated around $30k. This means that once the price of BTC falls below $30k, with every 1% downward movement in the price, market makers even need to add shorts worth $100m, which will undoubtedly put enormous pressure on the price performance of BTC.
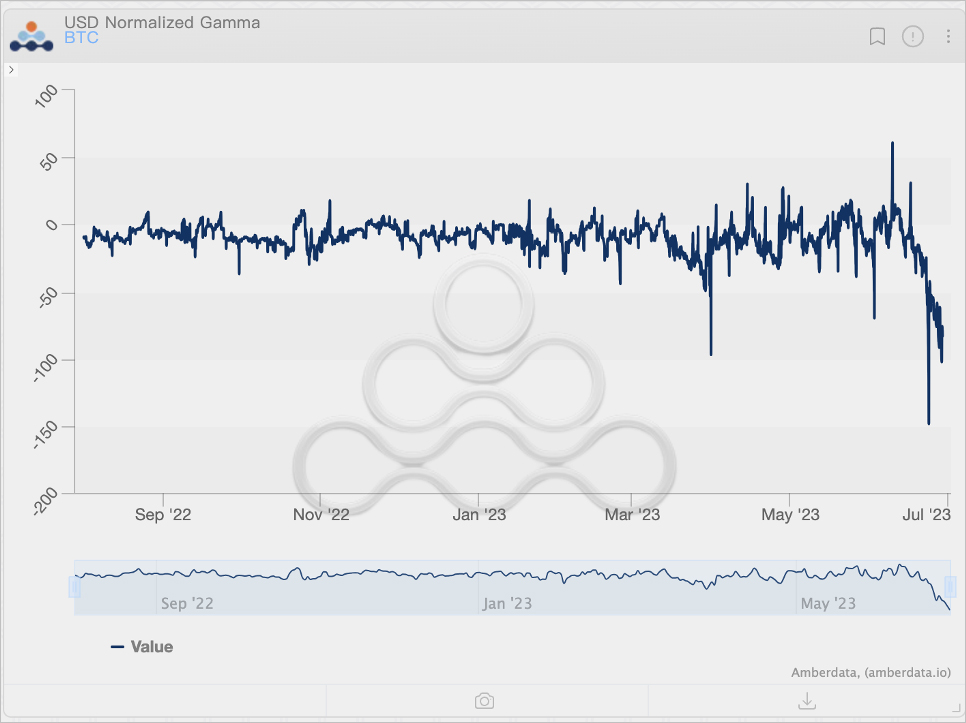
BTC options dollar gamma level movement, as of Jun 28, 2023. Source: Amberdata Derivatives
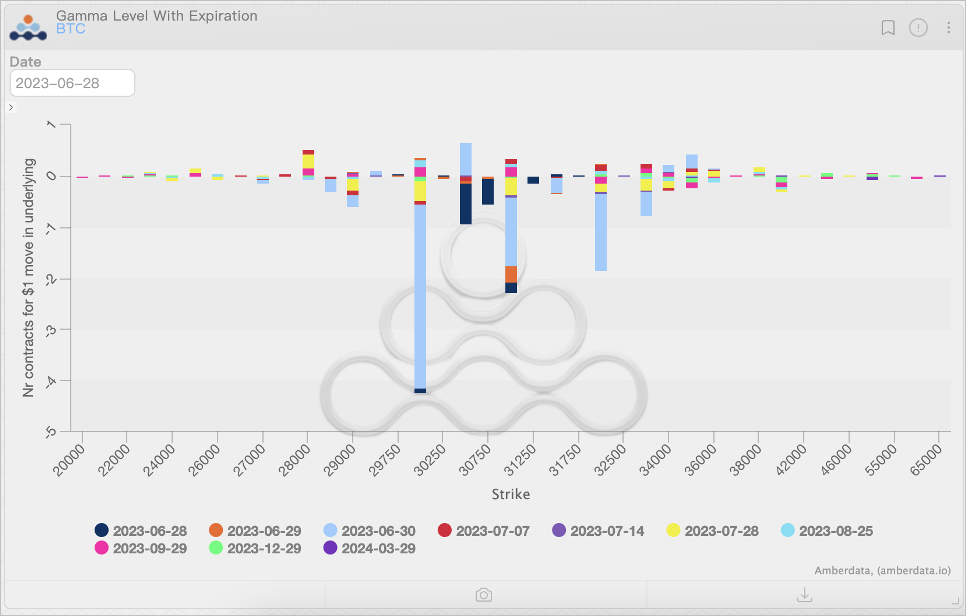
BTC options gamma exposure distribution, as of Jun 28, 2023. Source: Amberdata Derivatives
Fortunately, “pin risk” usually doesn’t happen. “Maintaining market stability before quarterly settlement” seems to have become a consensus. However, nothing is impossible in the crypto market; we still need to be careful.
After the Settlement…
After the semi-annual derivatives settlement, the 2023H2 will officially begin. Judging from the movement of gamma exposure, the positions of investors in the options market reflect some interesting implied expectations:
- The decline in the price of BTC will be more limited, with a relatively small probability of falling below $28k, while the upward space is relatively large, and there is even hope for a rebound to $35k and above.
- The price performance of ETH will improve compared to May and Jun, but the rebound will be limited compared to BTC. The price of ETH is more likely to be “stuck” around $1.9k. Even if there is a breakout, ETH will encounter significant resistance above $2k. However, in the event of a breakout fall, ETH will struggle to gain sufficient price support before reaching $1.6k.
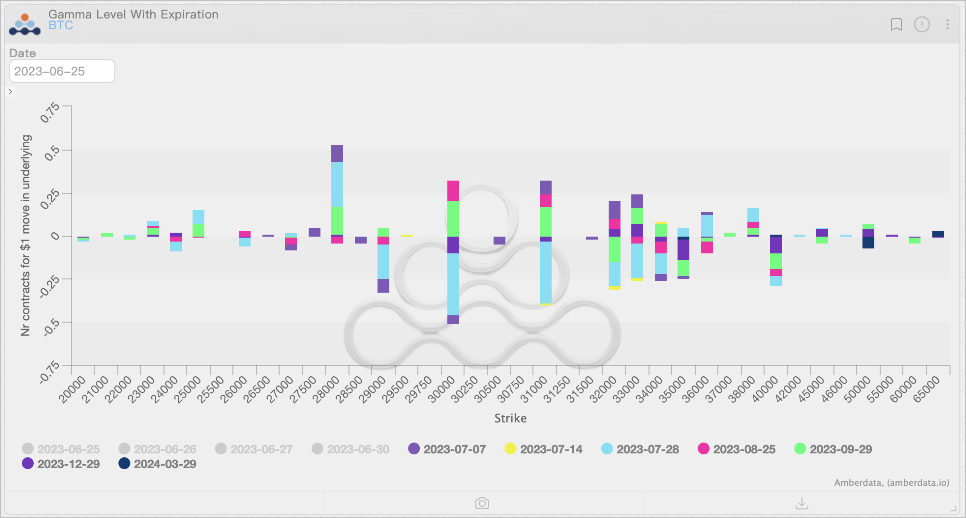
Distribution of BTC options gamma exposure after settlement, as of Jun 28, 2023. Source: Amberdata Derivatives
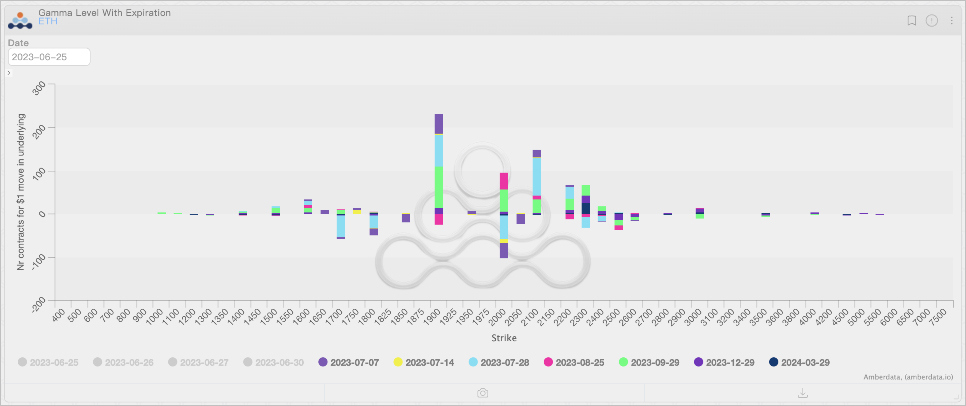
Distribution of ETH options gamma exposure after settlement, as of Jun 28, 2023. Source: Amberdata Derivatives
If we further interpret the above expectations, it is not difficult to find that under the influence of macro factors, supervision, and institutional preferences, the allocation of liquidity has changed, and the expectations for liquidity allocation have changed. The compliance attribute of BTC has been widely recognized. Whether it is the existing liquidity within the crypto market or the new liquidity entering the crypto market in the future, the preference of institutions and retail investors for BTC may significantly surpass other crypto assets.
However, before the Fed releases liquidity again, investors’ preference for BTC means there will be less liquidity for other assets. In the liquidity “zero-sum game,” the emergence of some new narratives may also get liquidity from BTC and cause BTC’s short-term sluggish performance.
Given the current level of market depth, the shift in liquidity may bring about a “sector rotation” effect similar to that in the stock market. Some crypto assets will perform well in the short term, while others will underperform due to the withdrawal of liquidity. But what can be expected is that the good performance of each part is temporary – like a meteor; this may be one of the new characteristics of the crypto market that we will face and adapt to. Let’s follow the changes in liquidity together and welcome the arrival of 2023H2.