

The gradual separation of correlation between BTC and ETH indicates that the overall change in the narrative of the crypto market is nearly complete. As a widely recognized “liquidity container,” BTC has become one of the essential macro underlying assets, gradually approaching the status of FX and precious metals. In contrast, the narrative of ETH is turning to mega stocks. Unless there is a grander narrative and widespread application, the attractiveness of ETH for liquidity may continue to be weaker than that of BTC, especially in the era of lack of liquidity.
“Time, forward!”
In just 15 years, the crypto market, which has one of the fastest-changing microstructures in the world, has become very different. In 2010, BTC was little more than an “experimental toy” for a group of geeks to exchange for pizza or handle small private transfers. In 2023, from BlackRock to Goldman Sachs, BTC and related derivatives have entered their product lists, and according to a survey by PwC and AIMA, Cryptocurrencies have also become an essential part of nearly one-third of hedge funds’ portfolios.
At the same time as the microstructure changes, the macro narrative is also quietly changing. “Decentralized distributed ledger” was the design goal at the beginning of the birth of crypto. In traditional markets, cross-border transfers are a time-consuming and laborious thing: to ensure “safety and credibility,” banks need to confirm the identity of users and the source of funds and then complete the whole process through the complex SWIFT system, the time is measured in days, and the cost cannot be ignored.
Cryptos represented by BTC solve this problem. With the blessing of blockchain technology, people link liquidity to the BTC network and complete transfers in the form of Bitcoin through the network. The transfer process has been shortened to seconds.
As a result, liquidity began to enter the crypto market one after another. This brings a new feature to the crypto market: volatility. On the coin standard, 1 BTC is always equal to 1 BTC; when converted to the fiat standard (such as the USD standard), the rapid liquidity changes bring considerable price fluctuations.
In the early history of BTC, it was not surprising that the 10% level fluctuated up and down, and even the price halved occasionally. High volatility makes risk hedging a “hard demand” in the crypto market and brings many speculation opportunities. Coin-margined derivatives began to appear, constituting the current crypto derivatives market prototype.
Cryptocurrency operates based on blockchain, and the characteristics of blockchain that cannot be forged and tampered with make people begin to explore more uses of blockchain. Commercial contracts can be notarized through blockchain. Blockchain-based programs can complete funds transfers and other complex operations without trust. Game drops and artworks can also be authenticated and traded through the blockchain network. The addition of smart contracts turns all the above possibilities into reality and thus opens the second narrative of the crypto market: projects and applications.
As one of the first public chains to introduce smart contracts, Ethereum’s first-mover advantage at the application level has made it the core of the Crypto 2.0 narrative. Whether it is DeFi, NFT, or GameFi, most applications are built on Ethereum; the distinction between “application” and “liquidity container” begins here.
However, during the bull market, the widespread influx of liquidity made this distinction less obvious – investors’ preferences for BTC and ETH did not differ according to different narratives. At the same time, because ETH can also be used for payment, transfer, and other purposes, the differences between BTC and ETH are further concealed.
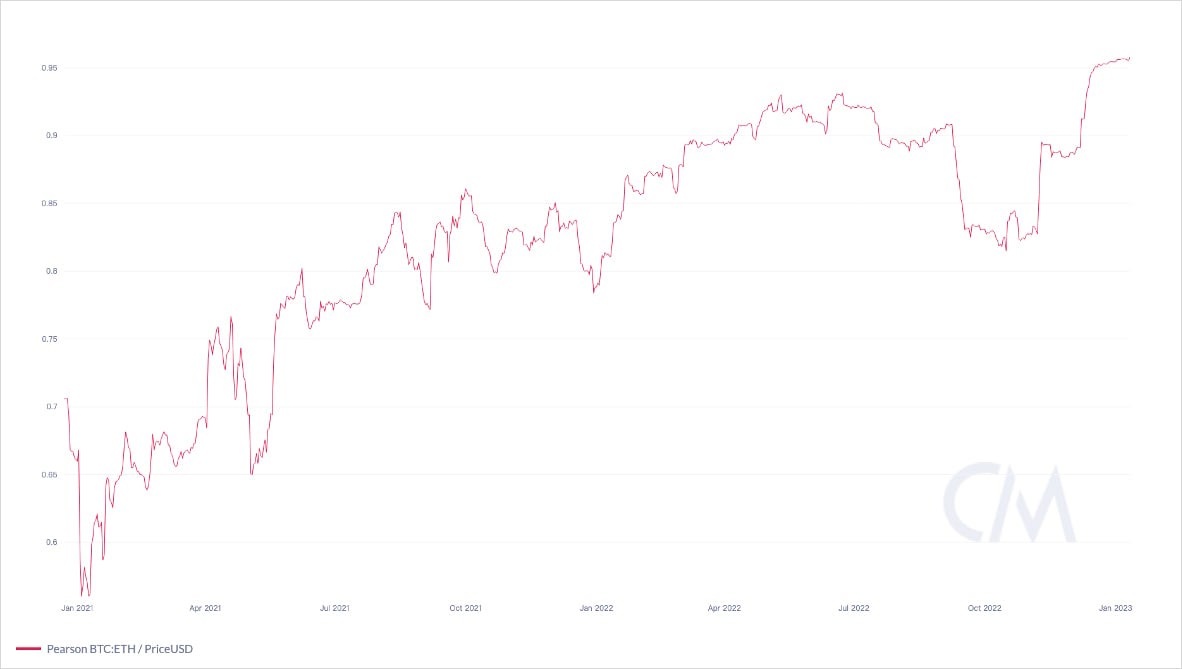
90-day price correlation between BTC and ETH from 2021 to 2023. Source: CoinMetrics
From 2021, BTC and ETH were once regarded as “hard currency” representatives in the crypto market. Cash liquidity in the form of fiat currency and stablecoins will first be exchanged for BTC and ETH, and then used to buy NFTs, project investments, etc. On the contrary, investors will first exchange the altcoins for BTC and ETH, then exchange them for cash and leave the market. Before 2023, backed by the “hard currency” attribute, the correlation between BTC’s and ETH’s performance gradually rose and became closer with the market cycle changes.
Crypto 3.0
In fact, the change in the crypto market narrative in 2023 was already foreshadowed in the last bull market round. In early 2021, not many people cared about the Fed’s interest rate decision, and not many cared about what Powell said every time. In 2022, investors in the crypto market began to pay attention to changes in economic data, and analysis of macroeconomic factors started to appear in AMAs, crypto media columns, and crypto blogs.
Why 2023? Let’s take a look at what has happened in the last 6 months:
- Continuous liquidity outflows caused by internal turmoil in the crypto market (Luna, 3AC, FTX collapse, etc.)
- The banking crisis has pushed safe-haven liquidity into the crypto market, and more institutions have begun to buy in cryptocurrency.
- AI is becoming a new trend. In contrast, the scale of primary investment and financing in the crypto market has hit a new low since 2021.
- Regulators are trying to adopt stricter regulatory measures for cryptocurrencies other than BTC and ETH.
Based on the above situation, a new Crypto 3.0 narrative has emerged. We call it “macro + AI + other.”
Macro: Under the combined effect of existing liquidity preferences and external liquidity preferences (mainly institutions), the macro attributes of BTC have been continuously strengthened. As a global liquidity network, the Bitcoin network, like gold and the US dollar, directly reflects the economic changes in its liquidity changes, meaning that BTC has become a natural macro underlying asset.
In addition, BTC is a fully compliance asset. Although ETH is not recognized as a security by the SEC, the SEC’s ambiguous attitude implies risk, while BTC has been clearly identified as a “commodity” rather than a “security.” Institutions will not easily take risks on compliance, and BTC is the best choice at this time.
AI: The artificial intelligence revolution has begun to trigger profound societal changes. AI is gradually replacing simple but repetitive tasks, and the financial system supporting AI needs to become simple, automated, and ready to use. At the same time, rights and obligations can be confirmed in a “simple and direct” way during disputes.
Blockchain-based smart contracts can fully meet the above needs: Financial rules are clearly written into smart contracts for automatic execution. The blockchain system will not be on vacation and is available anytime. Any transaction record exists permanently in the blockchain network, which is theoretically immutable and can be queried at any time with sufficient credibility.
It is not difficult to imagine that the blockchain represented by Ethereum and a series of applications based on it will be deeply integrated with AI in the future. In addition, the simultaneous favor of investment institutions for AI and blockchain also promotes the combination of the two to some extent.
Others: In addition to macro trading and AI, sentiment, speculation, digital art collections, and other needs will also exist in the crypto market for a long time, but the influence of these demands is much smaller than that of macro and AI. Crypto 3.0 has actually been launched. Due to the shift of BTC to a store of value and ETH to applications, the ecological niche of the two is gradually separating and ultimately affecting investor preferences. At the moment of lack of liquidity, macro traders tend to buy and hold BTC. In contrast, AI investors tend first to prefer US stocks and then cryptos such as ETH, which has caused the correlation between BTC and ETH to decline since the beginning of 2023.
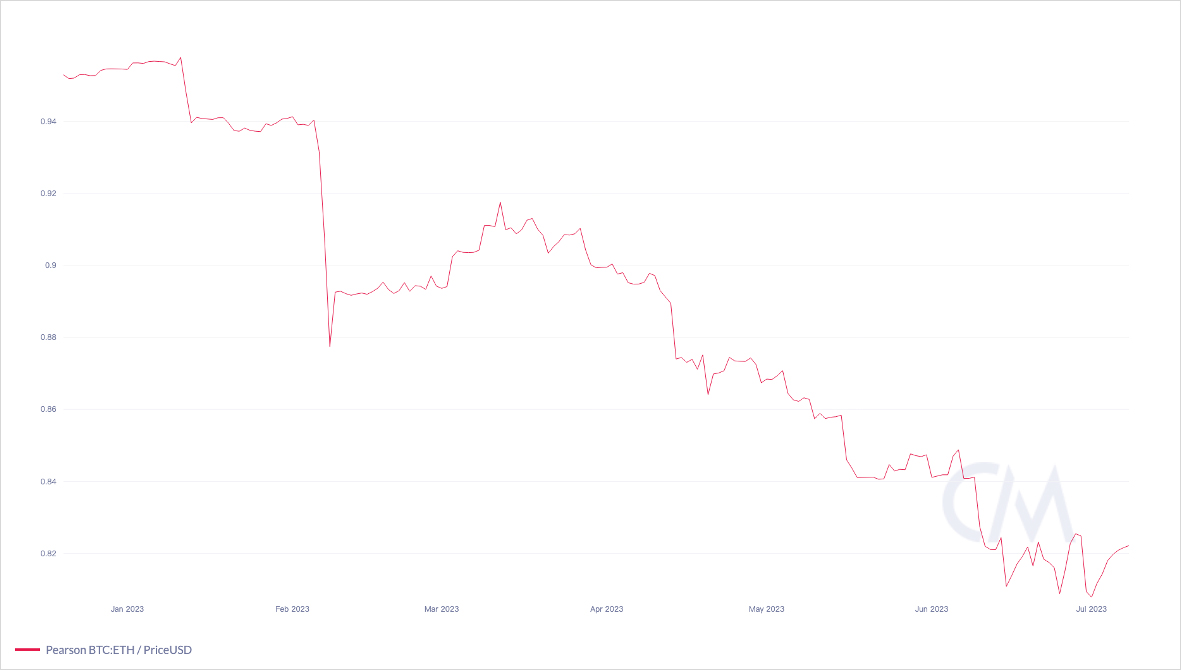
90-day price correlation between BTC and ETH since January 2023. Source: CoinMetrics.
So, what profound impact will the Crypto 3.0 narrative have on BTC, ETH, and other cryptos? Let’s take a bold look at their future together.
“Darling of Intitutions”: Why BTC?
In the contemporary financial system, the central bank is the source of liquidity for the financial market. When the central bank begins to release/contract liquidity, the changes in liquidity are reflected in real-time in the price changes of bonds, commodities, FX, and financial derivatives, as well as in the changes in stock indices. Bitcoin has not been a new “macro club” member for a long time. However, the US government holds the largest amount of Bitcoin, and the number of ETFs that include Bitcoin in their portfolios has gradually increased, with top asset management institutions such as Fidelity among the publishers of these ETFs.
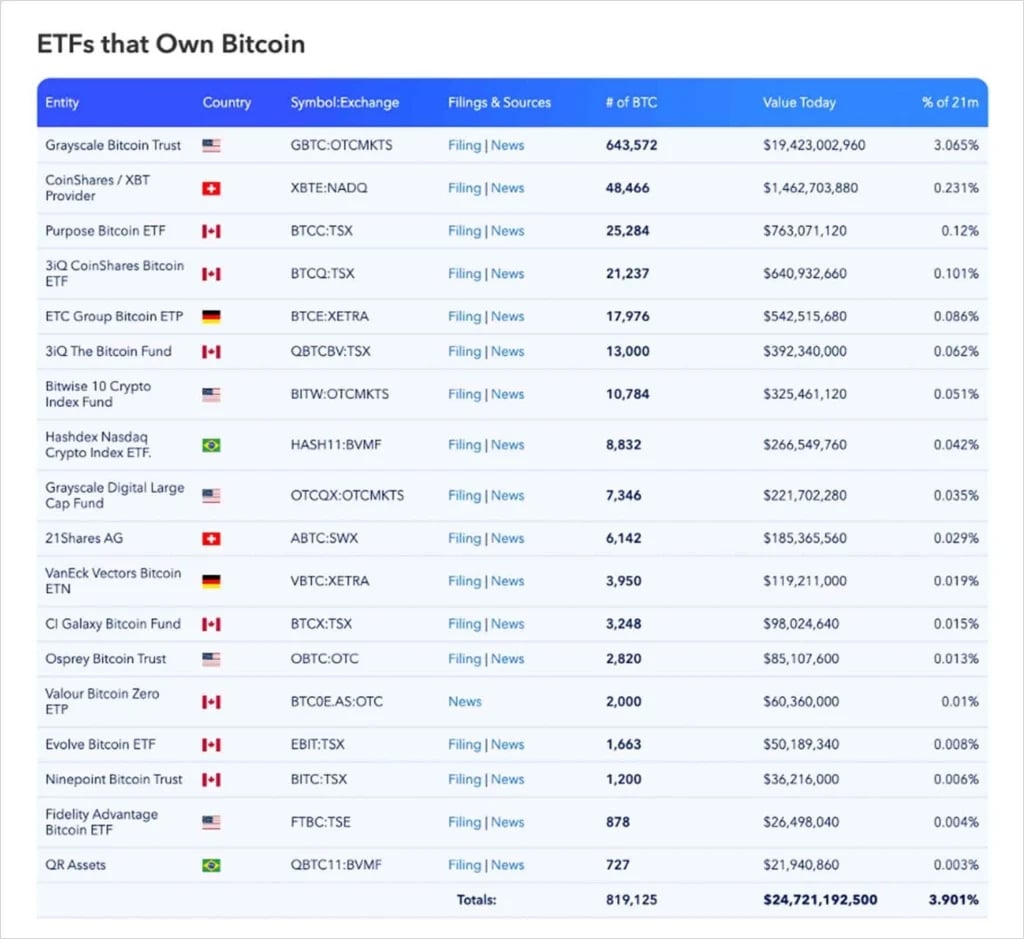
List of Bitcoin ETFs, as of Jul 17, 2023. Source: Bitcoin Treasuries.
Compared with other cryptos, BTC is genuinely decentralized. The deeds of His Excellency Satoshi Nakamoto are widely known, but no one knows “who he is.” However, “who he is” may no longer matter; the Bitcoin network has matured, and anyone’s influence on the Bitcoin network is negligible – this “truly decentralized” attribute is also one of the characteristics of qualified macro assets. Gold and minerals are generated from the universe, agricultural products are produced by nature, and Bitcoin comes from the cyber universe of algorithms and information.
Since BTC is a product of the cyber universe, the liquidity manipulation magic of central banks does not affect it. The dollar price of BTC changes, but 1 BTC is always 1 BTC. Native crypto investors use BTC as an investment and store of value to combat inflation under the fiat standard.
For fund managers from traditional markets, they value BTC’s role in Risk Diversification more. The price performance of BTC and gold has never reached a “strong correlation” level, and the correlation with the US stock indices has fallen to near 0 in 2023. At the same time, BTC belongs to a completely different asset class, which can somewhat diversify the portfolio’s overall risk. The compliance of BTC is also widely recognized, significantly reducing the legal risk of investing in BTC.
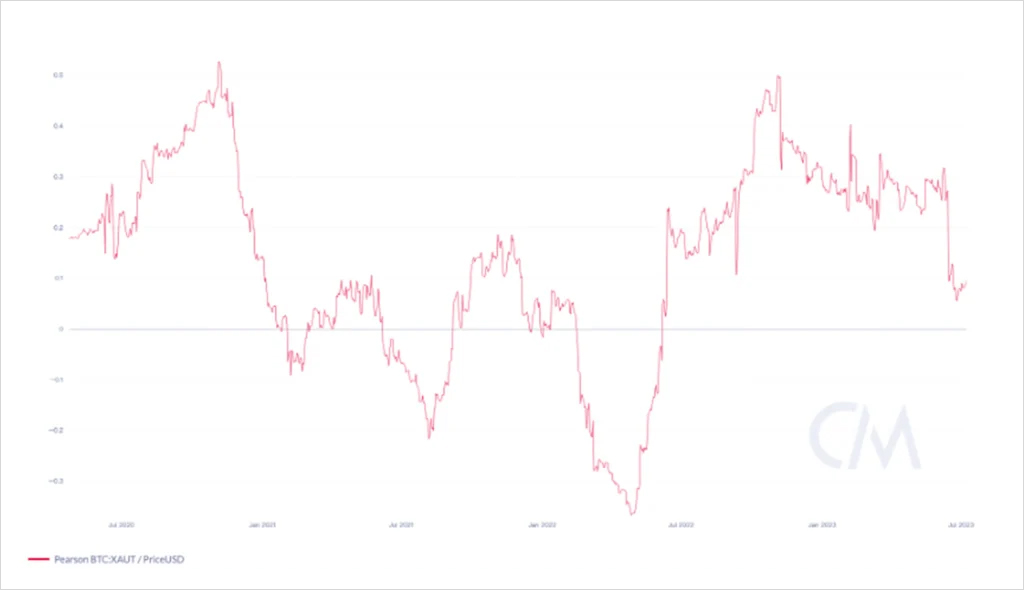
Changes in the 90-day price correlation between BTC and gold from Jul 2020. Source: CoinMetrics
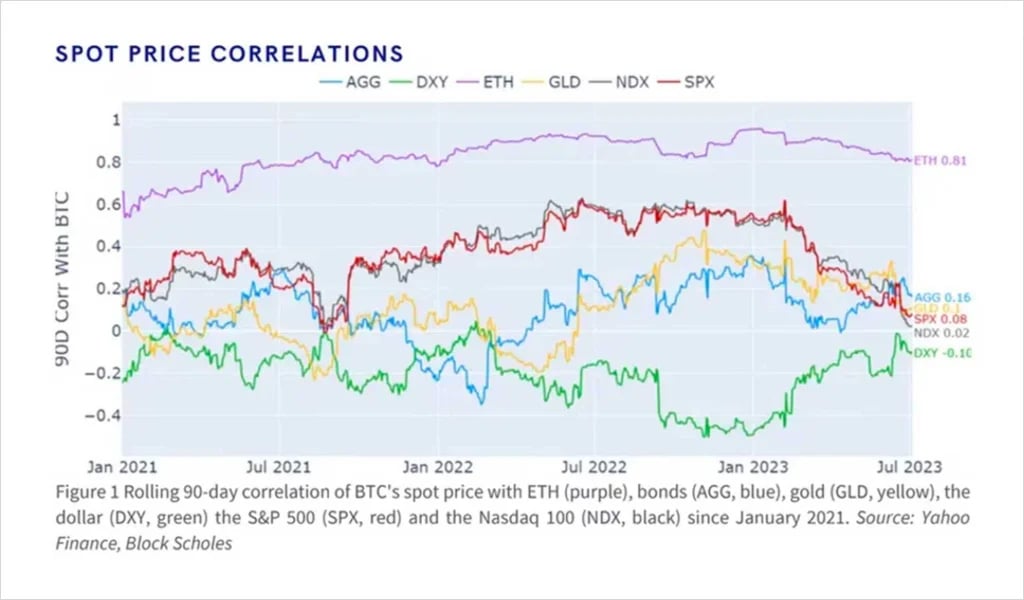
The correlation between BTC price and US stock indices since January 2021. Source: Block Scholes
Macro hedge fund managers pay more attention to liquidity. Their strategies usually invest in bonds, FX, commodities, stock indices, and other assets, and they prefer to trade through derivatives rather than spot; “liquidity” is the core. Macro trading requires accurate timing of liquidity movements and “entry and exit” at the fastest speed and lowest cost. As an emerging asset, with the global liquidity of the Bitcoin network and abundant derivatives, the liquidity of BTC can be comparable to that of FX.
More importantly, due to the high speed and low transaction costs brought about by the Bitcoin network and crypto infrastructure, traders can complete the deployment and exit of liquidity in seconds without constantly negotiating with numerous third-party institutions on the phone or waiting for bids to be accepted in the over-the-counter system with poor liquidity. These advantages above make BTC more sensitive to market sentiment and macro events, reflected in its price fluctuations and volatility movements.
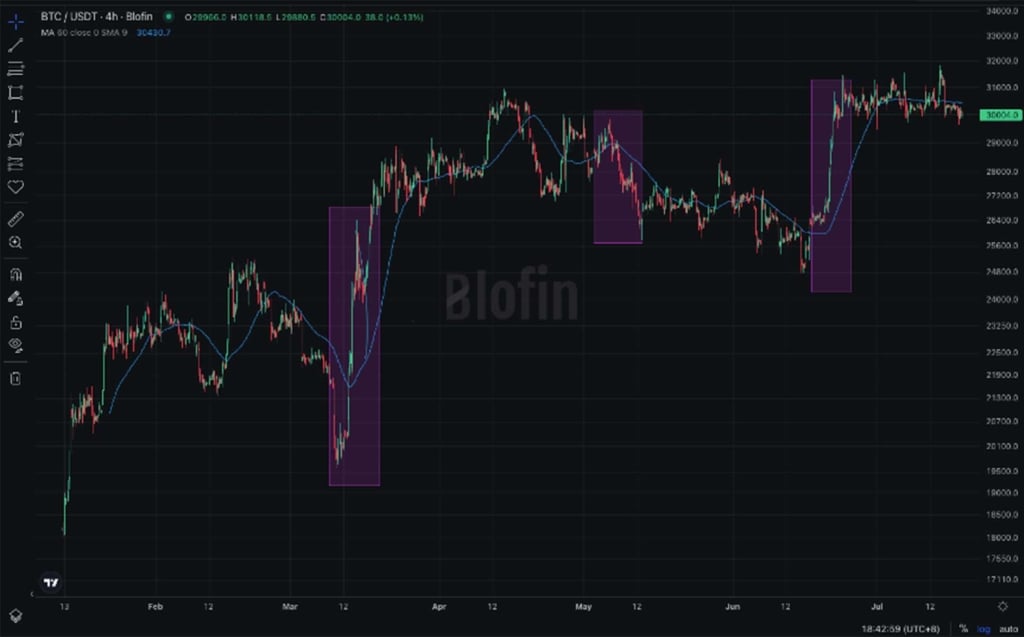
BTC price movement from January to Jul 2023. Note the purple parts in the graph, which correspond to the banking crisis in March, the Fed rate hike in May, and the spot Bitcoin ETF submissions around Jul. Source: blofin.com
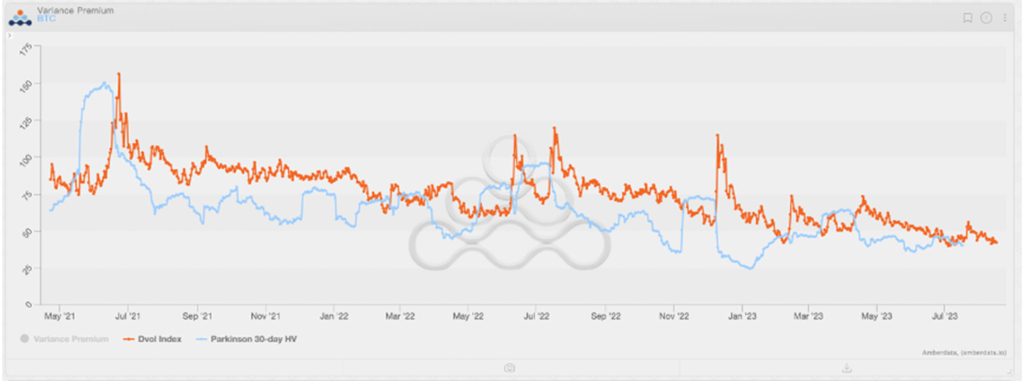
Changes in BTC DVOL Volatility Index and realized volatility levels since May 2021. It is not difficult to find that BTC’s Volatility Index is more sensitive to macro changes. Source: Amberdata Derivatives
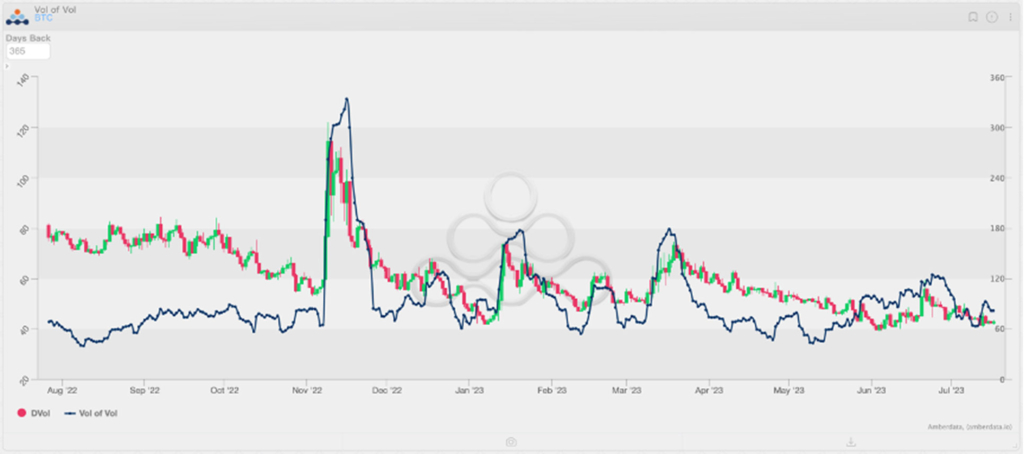
Changes in BTC DVOL Volatility Index and “Volatility of Volatility” since Aug 2022. The vol of vol in BTC moves more rapidly and sensitively compared to the volatility index. Source: Amberdata Derivatives
In short, whether it is a crypto believer, a fund manager in the traditional market, or a trader in the macro Hedge Fund, BTC meets the requirements of almost all types of investors in terms of functionality, compliance, risk management, liquidity, and trading. It is difficult to have a macro target that can meet these needs at once; in other words, BTC is a natural macro trading target.
Ethereum: A “Software Company” whose P/E Ratio Is 312.58
Crypto market investors like to compare BTC and ETH together. Regarding market capitalization, BTC and ETH rank first and second in the crypto market cap rankings, and every crypto trader will know both.
Investors in traditional markets are not. They are more cautious about ETH: leaving the possible compliance risks of ETH aside, considering the influence of Ethereum founders and developers on the development of the Ethereum blockchain, as well as Ethereum’s “smart contract as a service” model, it is more like a “software company” similar to IT giants such as Amazon and Microsoft, rather than a “pure liquidity container” like the Bitcoin.
In fact, some researchers and traders have interpreted ETH using a corporate finance-based framework:
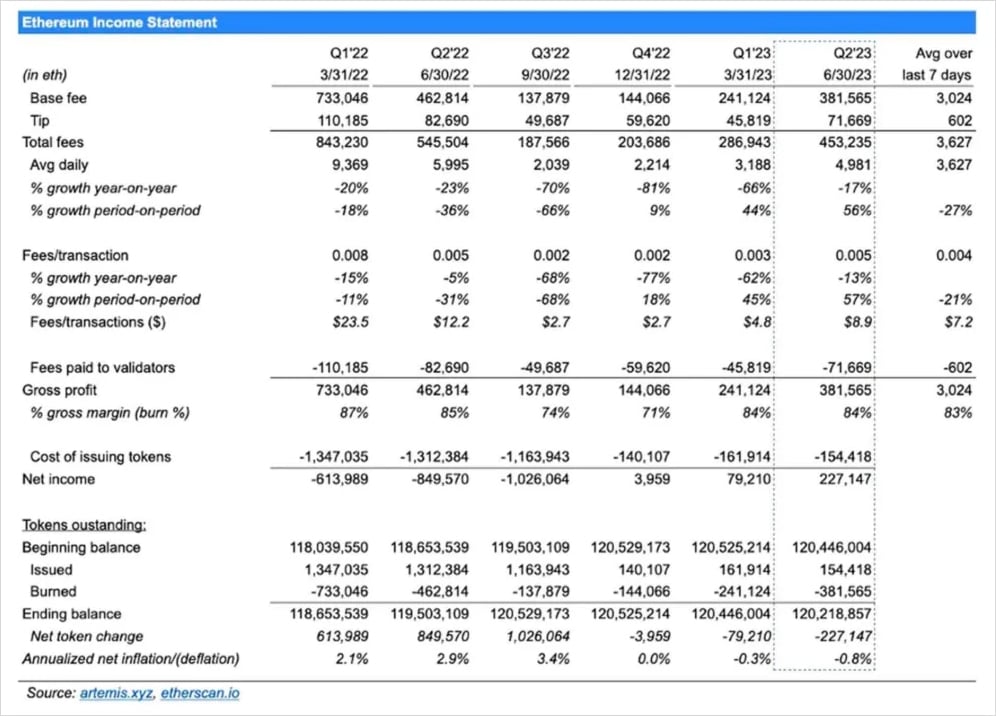
Ethereum Income Statement. Source: artemis.xyz
Then, it seems reasonable to use an analytical framework based on stock fundamentals to analyze ETH. Fortunately, due to the transparency of the blockchain itself, it is not difficult to obtain real-time supply and real-time price of ETH. Similarly, with the efforts of researchers such as Sam Andrew, we have also obtained the financial situation of the Ethereum network in a more feasible way. Let’s estimate the current P/E Ratio (P/E Ratio) of Ethereum together:
Calculated from the time of official introduction of ETH into PoS, from 2022q4 to 2023q2, the total net income (USD) of the Ethereum network is: (3,959 * 1,301) + (79,210 * 1,589) + (227,147 * 1,861) = $553,735,916, equivalent to an annualized net income of approximately $738,314,555; The average spot price of ETH (Jul 17) is around $1,920; The real-time total supply of ETH (Jul 17) is about 120,201,013; Therefore, the P/E Ratio for ETH = 1,920/(738,314,555/120,201,013) = 312.58.
312.58! This is an amazing P/E Ratio number. We have attached the P/E Ratio for Magnificent 7 (the seven largest tech stocks by market capitalization) in the US stock market as a comparison*:
AAPL: 32.38
AMZN: 164.24
ETH:312.58
GOOGL: 27.93
META: 38.32
MSFT: 36.92
NVDA: 207.62
TSLA: 82.76
*The price for the P/E Ratio calculation is based on the Jul 14 closing price for stocks. The price for the ETH P/E Ratio calculation is based on the Jul 17 intraday average price.
Undoubtedly, Ethereum, as a “software company,” has significantly exceeded our original expectations. Considering that it does not pay dividends and is still in the stage of rapid growth after turning to PoS, its high P/E Ratio is similar to NVDA under the blessing of AI. Compared to AMZN’s P/E Ratio, as the core infrastructure provider of the crypto industry, ETH’s high P/E Ratio is not difficult to understand. In summary, investors have given a high valuation to ETH and look forward to the infinite possibilities of ETH’s future development.
However, while Ethereum can be completely self-consistent under corporate logic, BTC and ETH have officially gone down different paths.
Parting Ways
Where will BTC and ETH go under the narrative of “Crypto 3.0”?
BTC: Crypto is Macro
There is no doubt that the price of BTC will depend on macroeconomic conditions and changes in macro conditions within the crypto market. Therefore, interest rates and market share will be important influencing factors for BTC. Interest rates affect expectations, while market share affects market cap size.
- From the interest rate market, the Federal Reserve will not cut interest rates in the next 6 months, while the European Central Bank will not show weakness under the threat of high inflation. The above situation means that high interest rates will continue to weigh on BTC’s performance. However, some potential positive factors also support BTC price, such as the possible listing of spot Bitcoin ETFs.
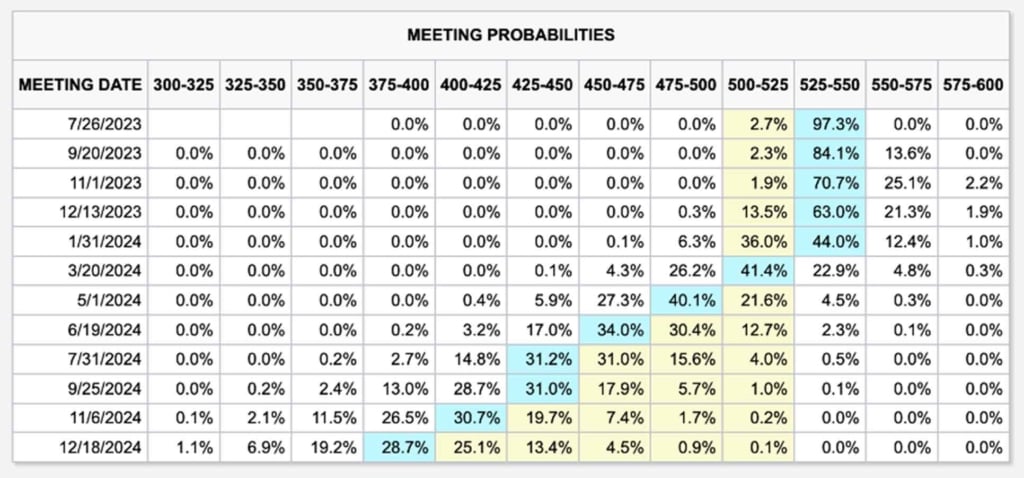
The Fed’s latest interest rate path forecast, as of Jul 17, 2023. Source: CME Group
- In addition, the internal allocation of liquidity in the crypto market will also affect BTC price and market cap. From the beginning of 2021 to the end of 2022, due to the impact of the bull market and the “alts season,” the market share of BTC gradually decreased from more than 60% to between 40% and 45%. Then, benefiting from institutional buying and liquidity return, BTC’s market share rebounded from Jan 2023. By Jul 2023, BTC’s market share was about 50%.
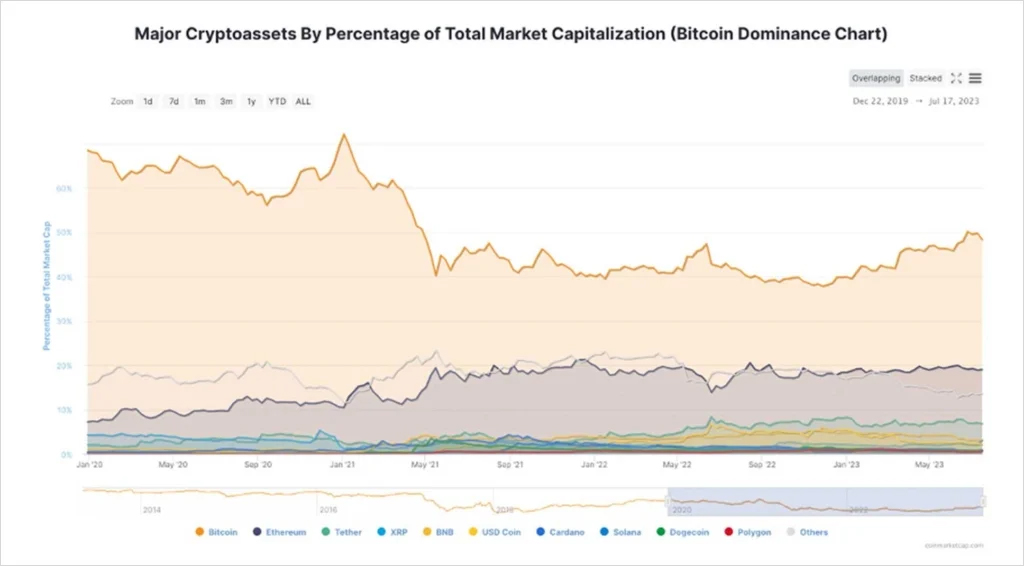
Market Share change of mainstream cryptocurrencies, as of Jul 17, 2023. Source: Coinmarketcap
- At the time of 0% interest rate, the total market capitalization of the crypto market is about $3T. At a time with a 5.25% interest rate, the total market cap of the crypto market has fallen to about $1.20T, about 40% of the highest point. Between Nov 2021 and Mar 2022, the crypto market lost nearly $1T in market cap due to the Fed’s expectations management. In Mar, the Fed raised interest rates by 25 bps, at which time the total market cap of the crypto market was about $2T, 67% of the highest point.
- Considering that the Federal Reserve is not expected to adopt the unlimited QE policy like 2020-2021 in the next few years, the total market cap of the crypto market due to expectation changes will not exceed $1T.
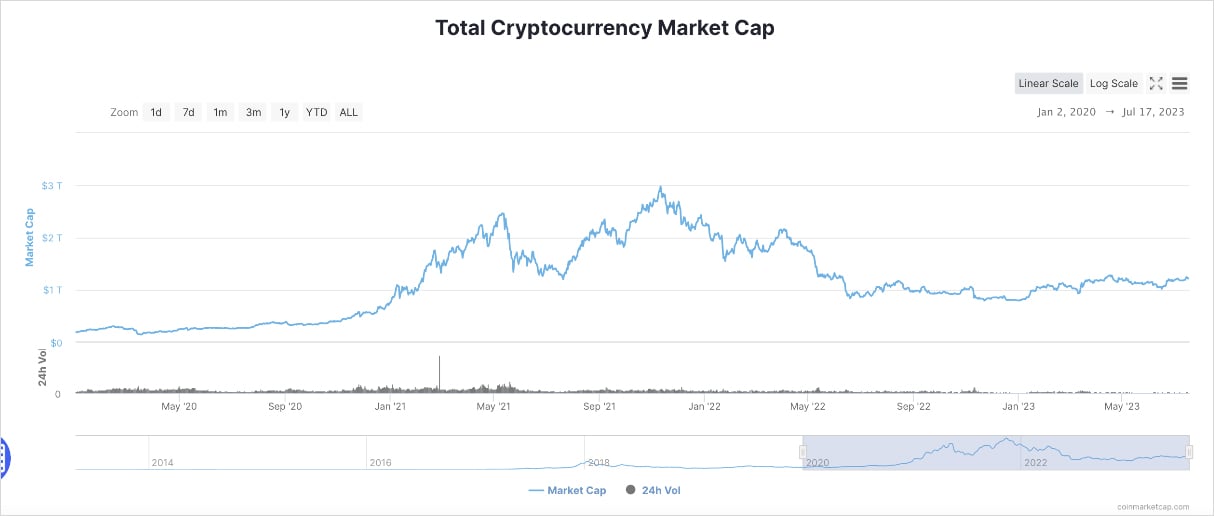
Changes in the total crypto market cap, as of Jul 17, 2023. Source: Coinmarketcap
Let’s expand based on the above logic.
- Considering the current lack of external liquidity entering the crypto market, we assume that the future price of BTC depends entirely on changes in interest rates and market expectations and is reflected in changes in market share.
- With the continuation of high interest rates and the lack of external liquidity, it isn’t easy to see a significant increase in the total market capitalization of the crypto market before Jan 2024. Even if “buying in expectations” happen, in the most optimistic scenario, the expected increase in the crypto market capitalization will not exceed $500b.
- The total supply of BTC is about 19.43m, and the total supply will not change significantly by more than 5% in a year.
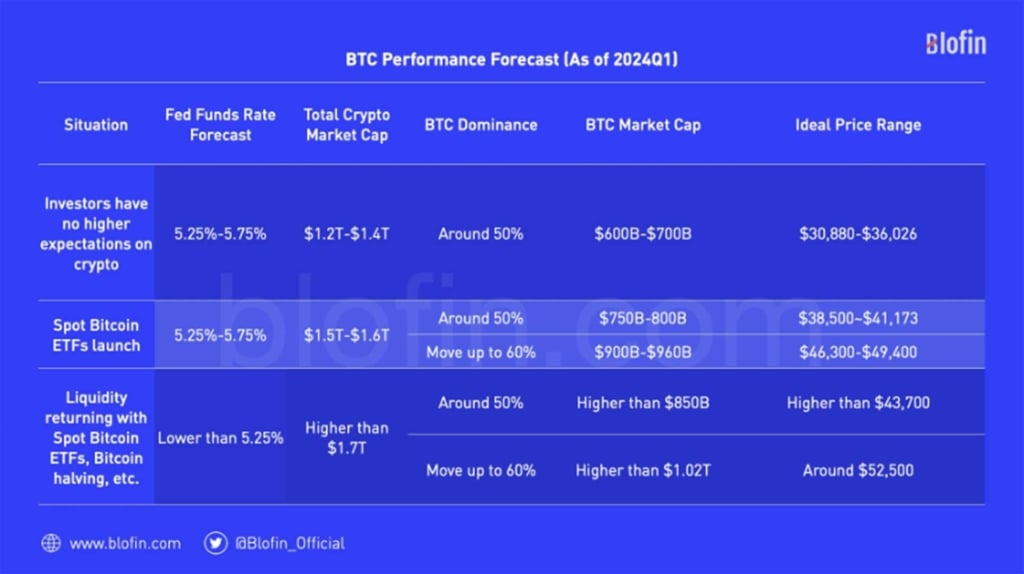
Briefly consider 3 situations below:
1. Investors have no better expectations, and the crypto market capitalization is limited. The total market cap will stabilize between $1.20T and $1.40T, and the market share of BTC will not change much, remaining around 50%. The above means that the market capitalization of BTC will fluctuate between $600-$700b, and the price will fluctuate between $30,880-$36,026.
2. The Spot Bitcoin ETF passed, giving investors good expectations. The crypto market capitalization rebounded to around $1.50T – $1.60T.
- If the market share of BTC does not increase, the market cap of BTC will stabilize at around $750b to $800b, and the price will reach $41,173 at the highest point. Even if the rebound is not strong enough, the price of BTC will be higher than $38,500.
- If a spot ETF passes and pushes BTC’s market share up to 60%. In the best case, BTC’s market cap will reach $960b with a unit price of over $49,400. Even if the overall crypto market rally is not dramatic enough, BTC’s market cap will rise to $900b with a unit price of $46,300.
3. Interest rate cuts are expected to be superimposed with positive expectations such as spot Bitcoin ETFs and Bitcoin halving, promoting the flooding return of liquidity in the crypto market, and the crypto market capitalization rebounded to more than $1.70T.
- If the market share of BTC does not increase, the market cap of BTC will reach more than $850b, and the price will rebound to more than $43,700.
- If the market share of BTC rises to 60%, the market cap of BTC will reach more than $1.02T, and the price will reach around $52,500.
In conclusion, macro factors are relatively favorable for BTC, and the peak of the BTC price mainly depends on interest rates and market expectations.
ETH: “How to Be a More Profitable Company”
Considering that BTC has become the protagonist of the macro narrative, it may be more sensible for ETH to make efforts in its application. Therefore, for ETH, the factors affecting its price mainly come from its new narrative and whether it can be widely used. Since these factors will be reflected in the net income of the Ethereum network, we can get the possible price movement of ETH based on the changes in the P/E Ratio.
Similarly, simply consider 3 situations below:
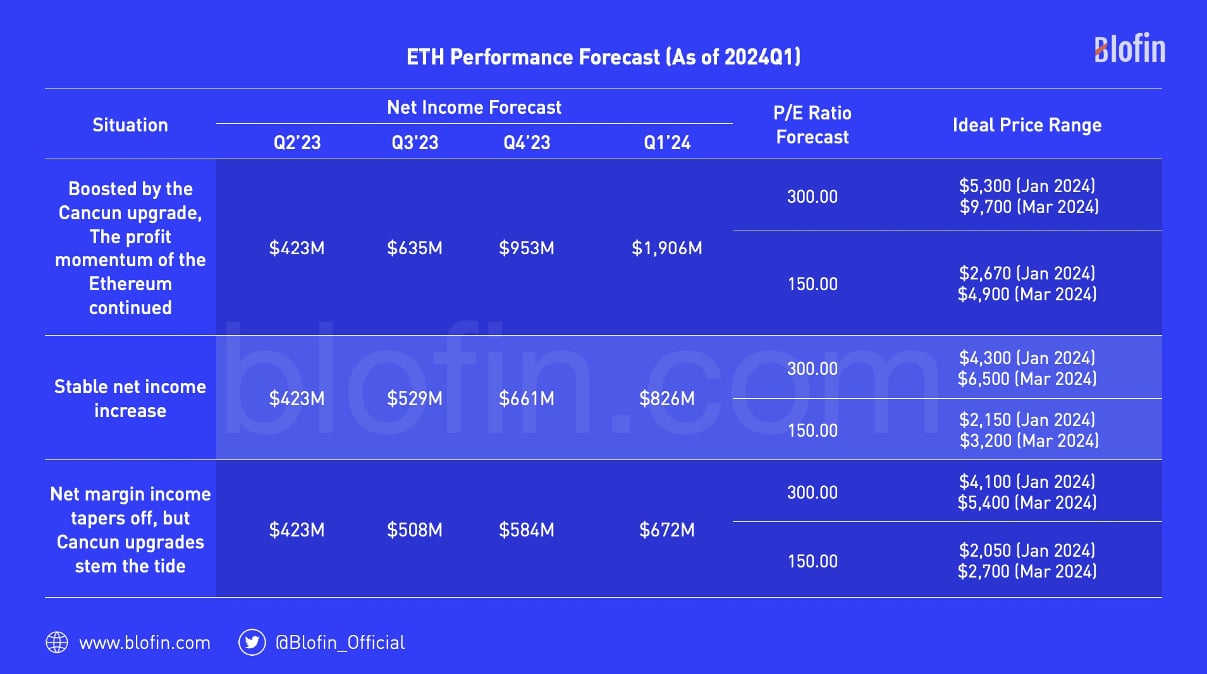
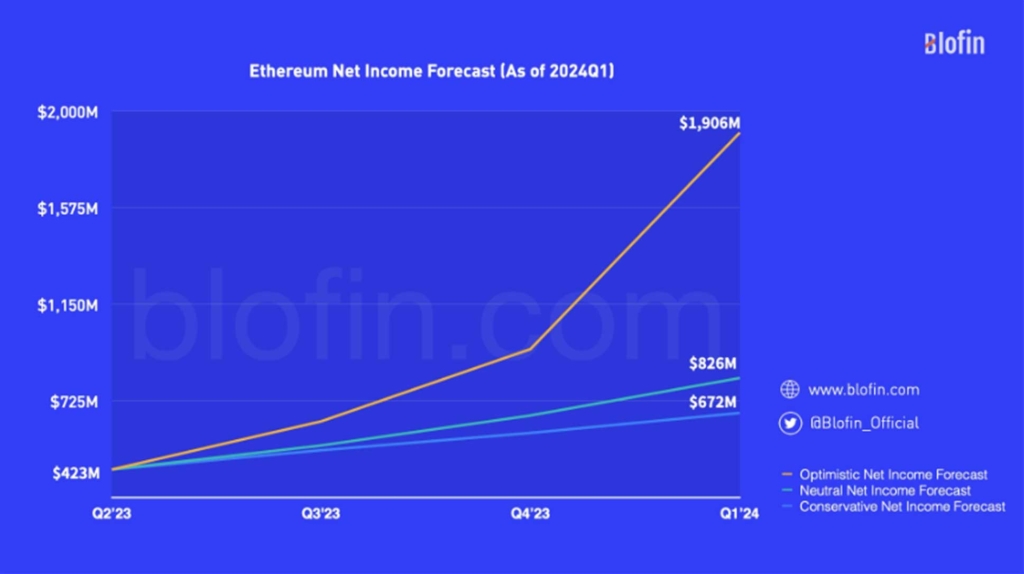
1. The Cancun upgrade significantly improved the Layer2 speed of Ethereum, reduced transaction costs, and promoted the outbreak of the Ethereum Layer2 ecosystem. The profitability of the Ethereum network continued, with net income increasing by 50% per quarter before the Cancun upgrade and net income doubling per quarter after that.
- Assuming no significant change in the ETH P/E Ratio, strong investor expectations drive the P/E Ratio to remain around 300. In 2023, the Net Income is $423m in Q2, $635m in Q3, and $953m in Q4. In this scenario, the total revenue of the ETH network in 2023 would reach $2.137b. Considering that ETH deflation will cause the total supply of ETH to fall to around 120m, the average price of ETH may exceed $5,300 in early 2024 and $9,700 in the first quarter after the Cancun upgrade.
- Assuming that investor expectations are more neutral, causing the ETH P/E Ratio to fall back to around 150 (close to comparable companies such as AMZN), in this scenario, the average price of ETH will reach about $2,670 in early 2024 and close to $4,900 in the first quarter after the Cancun upgrade.
2. The profit of the Ethereum network is relatively stable, with a 25% increase in net income per quarter. After the Cancun upgrade, the net income in 2024Q1 increased by 50% compared with 2023Q4.
- Assuming no significant change in the ETH P/E Ratio, strong investor expectations drive the P/E Ratio to remain around 300. In 2023, the net income is $423m in Q2, $529m in Q3, and $661m in Q4. In this scenario, the total net income of the ETH network in 2023 will reach $1.739b, and the average price of ETH may exceed $4,300 at the beginning of 2024 and $6,500 in 2024Q1. If the P/E Ratio falls back to around 150, the ETH price could average around $2,150 in early 2024 and break above $3,200 in 2024Q1.
3. The profit of the Ethereum network showed a marginal decline. The net income increase in Q3 and Q4 was 20% and 15%, respectively. The benefits from the Cancun upgrade only curbed the marginal profit reduction in 2024Q1.
- Assuming no significant change in the ETH P/E Ratio, strong investor expectations drive the P/E Ratio to remain around 300. In 2023, the net income is $423m in Q2, $508m in Q3, and $584m in Q4. In this scenario, the total profit of the ETH network in 2023 will reach $1.641 b, and the average price of ETH may exceed $4,100 at the beginning of 2024 and $5,400 in 2024Q1. If the P/E Ratio falls back to around 150, ETH could average around $2,050 in early 2024 and break above $2,700 in 2024Q1.
To sum up, the future of ETH is highly related to its profitability. The blessing of narrative, combined with sustainable and growing profitability, is the key to driving the price of ETH up, which is far different from BTC.
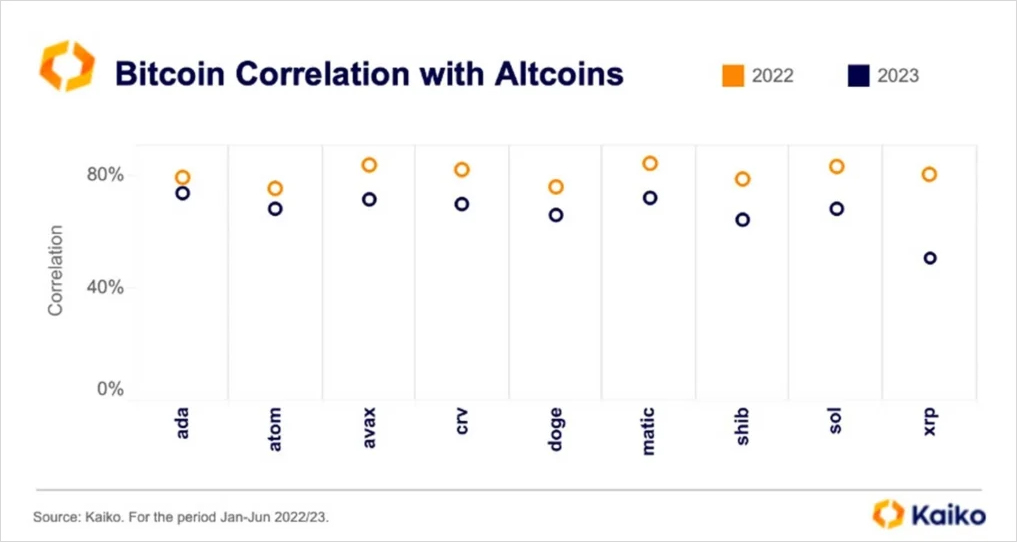
Changes in the correlation between BTC and mainstream cryptocurrencies other than ETH, as of June 2023. Source: Kaiko
Junction
In fact, the “divergence” already exists not only in theory and between BTC and ETH. According to statistics, in 2023, the correlation between BTC and ETH decreased significantly, and between BTC and mainstream altcoins also decreased significantly. BTC seems to be going its own way, and the correlation between ETH and different types of coins, such as XRP, LTC, and BNB, is also weakening, but it still correlates with public chain coins and project tokens more, such as ADA and CRV.
As the correlation among cryptos weakens, the analytical logic and trading strategies previously available to reuse wholly or partially become ineffective. Pair trading no longer profits from the desired correlation regression, and the general investment framework based on market cap and tracks are no longer applicable to some extent, which means that further analysis based on the fundamentals of the project itself becomes more important.
Changes in the correlation between BTC and mainstream cryptocurrencies other than ETH, as of June 2023. Source: Kaiko
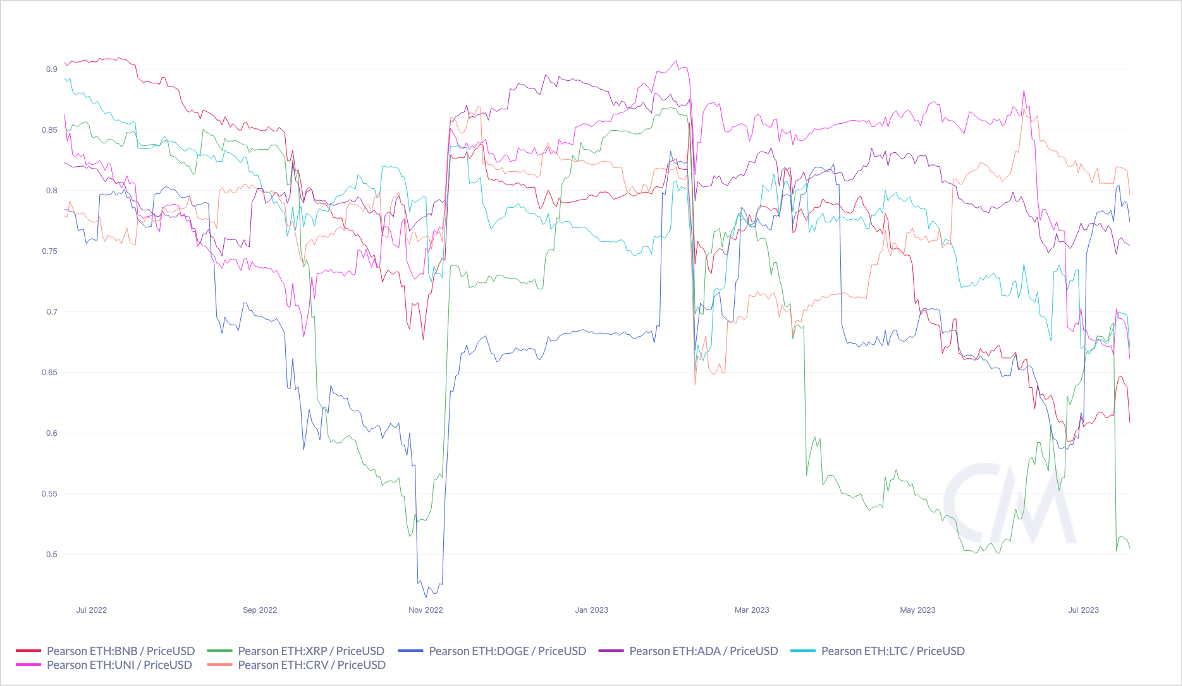
ETH correlation movement with mainstream cryptocurrencies other than BTC, as of Jul 2023. Source: CoinMetrics
It’s time to analyze the crypto market by adopting two or more methods. Crypto 3.0 is here; the times are moving forward. Bitcoin will be more closely integrated with the macro economy and traditional markets, while Ethereum needs to become a “great company,” and other cryptocurrencies have to go their own way. In the crypto market, where macro and microstructures are rapidly changing, we need to keep up with the pace of the times.
This report is based on public sources considered to be reliable, but Blofin does not guarantee the accuracy or completeness of any information contained herein. The report had been prepared for informative proposes only and does not constitute an offer or a recommendation to purchase, hold, or sell cryptocurrencies (tokens) or to engage in any investment activities. Any opinions or expressions herein reflect a judgment made as of the date of publication, and Blofin reserves the right to withdraw or amend its acknowledgement at any time in its sole discretion. Blofin will periodically pr irregularly track the subjects of the reports to determine whether to adjust the acknowledgement and will publish them in a timely manner. Blofin takes its due diligence to ensure the report provides a true and fair view without potential influences of any third parties. There is no association between Blofin and the subject referred in the report which would harm the objectivity, independence, and impartiality of the report.
Trading and investing in cryptocurrencies (tokens) may involve significant risks including price volatility and illiquidity. Investors should fully aware the potential risks and are not to construe the content of the report as the only information for investment activities. None of the products or Blofin Inc, nor any of its authors or employees shall be liable to any party for its direct or indirect losses alleged to have been suffer on account thereof.
All rights reserved to Blofin.