

Crypto Sees Muted Reaction to War in the Middle East
The conflict between Israel and Palestine that kicked off over the weekend has raised geopolitical concerns in the Middle East, and fears of escalation if other nations like Iran and the US were to get involved. Thus far, BTC and ETH have shown a restrained response to the initial days of conflict. Should the situation intensify into a wider regional clash, we might witness sustained surges in Oil prices, potentially driving inflation up mid-term or risks of global risk-averse sentiment.
Presently, there’s a virtually non-existent correlation between cryptocurrencies and traditional finance assets such as equities or bonds. This situation might remind some of the Russia/Ukraine conflict that erupted in February 2022, which saw BTC spike by nearly 30% in its initial days. Yet, this surge was largely attributed to sanctions imposed on Russia and the subsequent asset freezes.
Two key events concerning macro this week, which are unlikely to act as short-term catalysts for $BTC, include: Firstly, the US CPI data on Thursday, which might validate or challenge the current pricing projections in the US rate markets. And second, the SEC’s appeal over the Grayscale verdict, potentially influencing the probability and schedule of a spot BTC ETF.
Zooming out, Bitcoin’s dominance and the ETH/BTC chart breaking down suggest that BTC is poised to outperform most Alts as we approach Q4’s end. It’s crucial to recognize that pivotal catalysts for BTC, such as spot ETF decisions, the halving occurrence, and possible economic upheavals in the US as we head into 2024, are all converging in a tightening window.
ETH Carry Deeply Negative
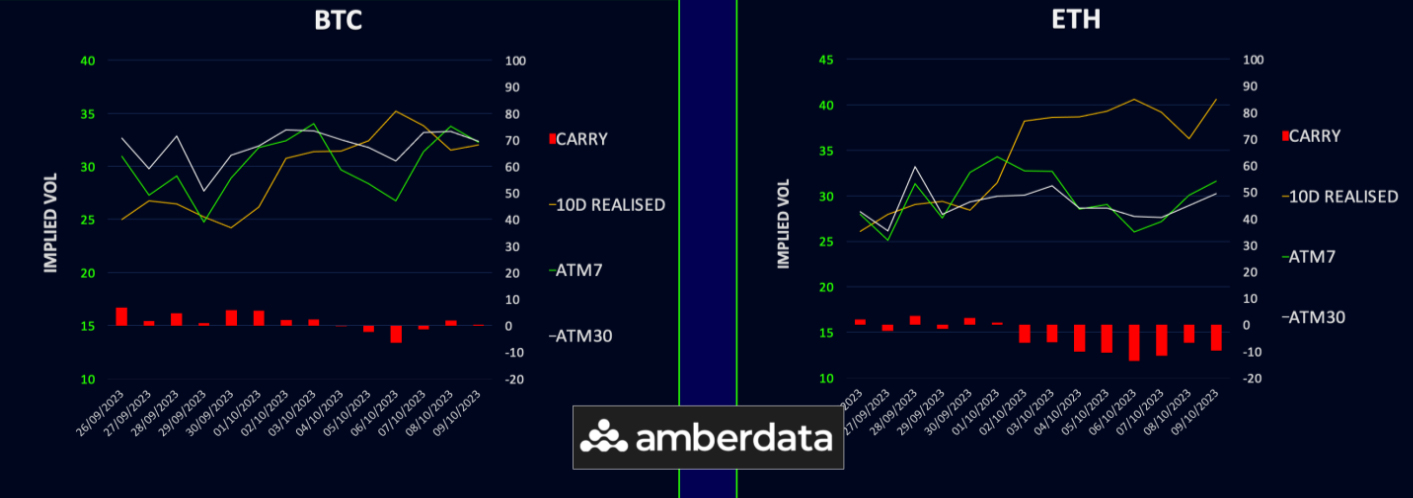
Over the week, BTC’s realized volatility remained consistent, hovering around 32%, whereas ETH experienced more pronounced fluctuations, realizing up to 40.5% (translating to an average daily movement exceeding 2%).
Implied volatilities had their usual sell-off as the weekend approached but have now recovered off the lows and are nearly flat for the week.
While BTC’s implied volatility now aligns with its realized vol, making the carry neutral, ETH’s carry shows a significant negative of -10 vols due to an excess of gamma supply suppressing ETH implied vol. This has proven beneficial for those ready to engage in owning short-term options and paying the decay.
Although the US CPI is poised to be this week’s standout macro event, the connection between crypto and traditional finance has notably weakened. Thus, we anticipate that crypto-specific news will be the predominant catalyst for volatility shifts, if we see any.
Term Structures Come Under Pressure
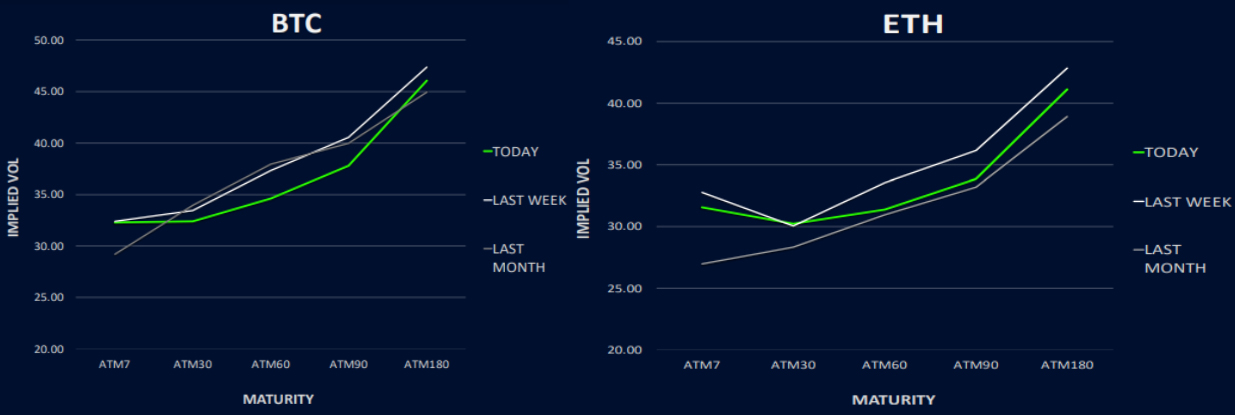
The BTC term structure is coming under pressure, notably from its mid-curve. While the Oct23 maturities held steady throughout the week, durations between Nov23 and Mar24 faced sell-offs, dipping by 2-3 vols. The selling was less pronounced for Jun24 and beyond, with call selling being concentrated more towards the latter part of 2023.
ETH’s term structure mirrors the dynamics seen in BTC. The VEGA segment of the curve, from Nov23 forward, is shifting downward, with even the furthest maturity, Sep23, down by 1 vol. Oct23 durations garnered a slightly better demand as GAMMA has been working well.
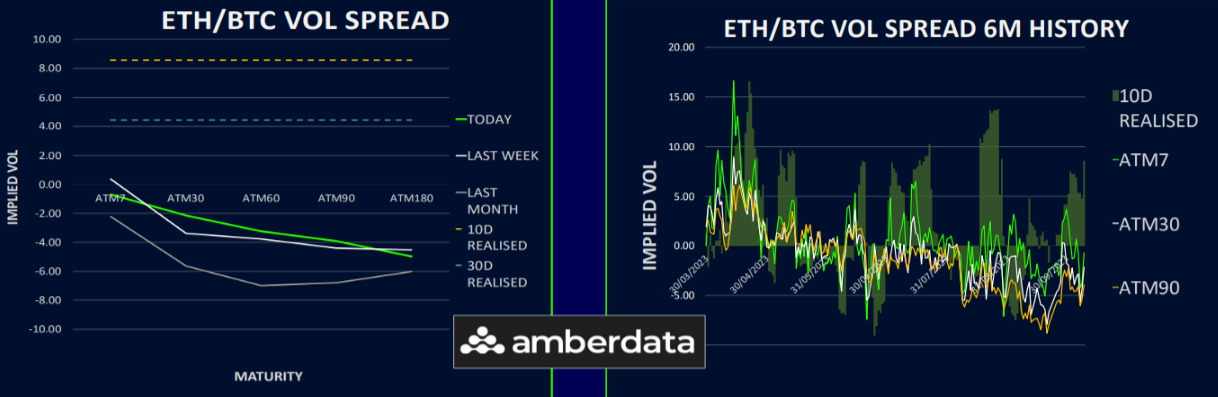
ETH/BTC Vol Spread Trades Stable
The ETH/BTC volatility differential has been fairly stable this week, with a slight rise in the middle of the curve due to BTC experiencing more pressure than ETH. The forefront remains near flat, with ETH gamma performing quite well, followed by a gradual decline to approximately -5 vols towards the long end.
Notably, even with ETH’s realized volatility consistently higher over recent weeks, the most the spread achieves is an equilibrium in the front-end GAMMA segments. This highlights the prevailing influence of supply and demand factors on the current implied volatility in crypto right now. For those expecting realized volatility to perform as it has, there’s value in the current ETH volatility, given that option sellers are clearly not that price-sensitive.
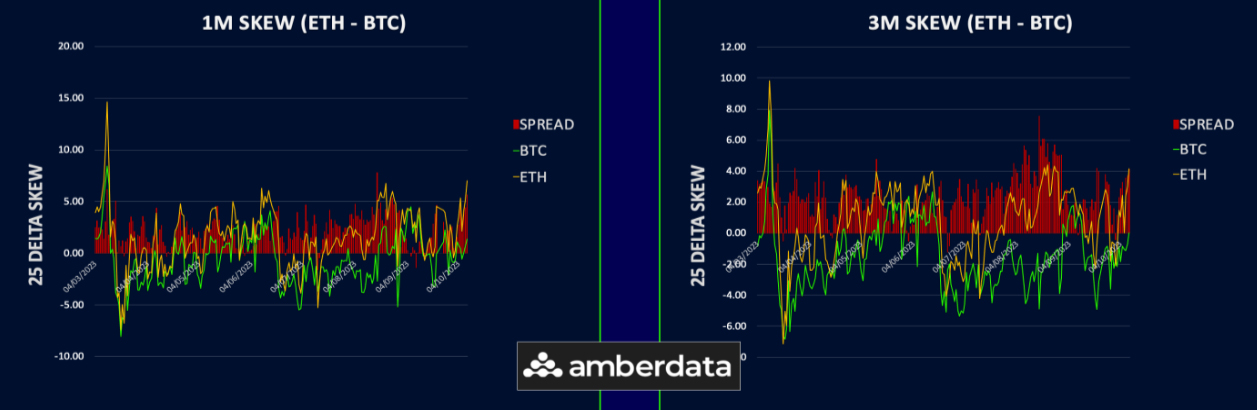
Front End Skews Shift to Put Preference
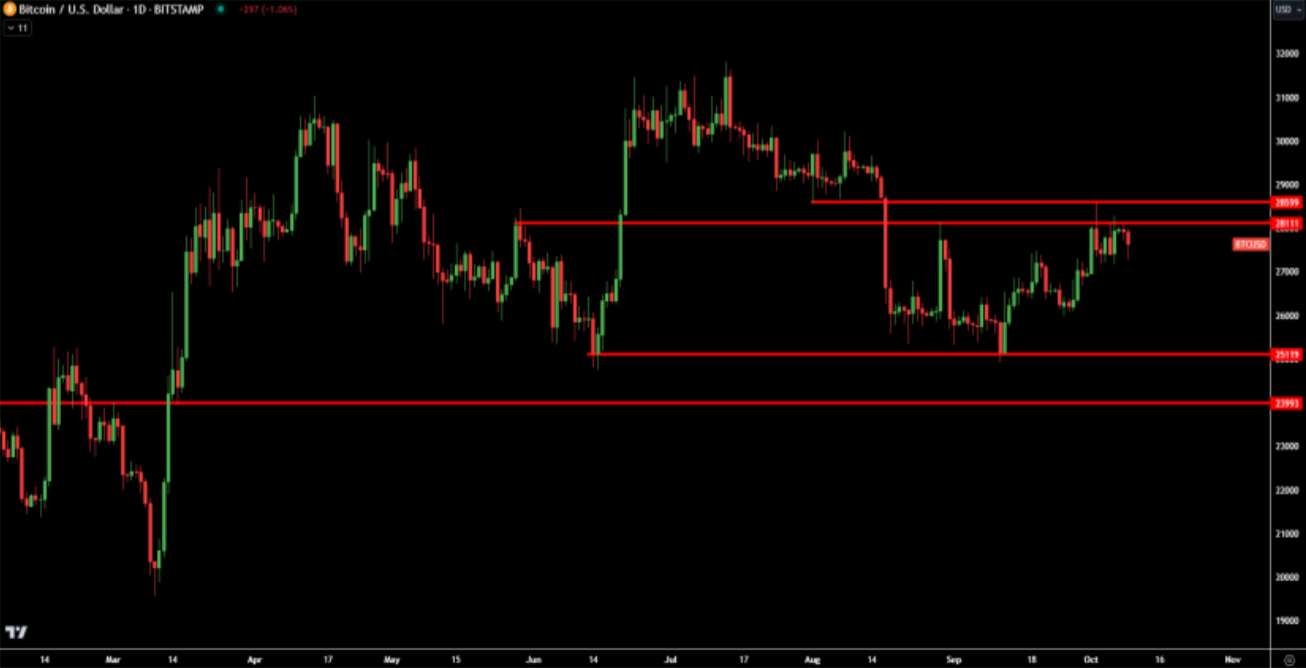
After yet another unsuccessful effort to surpass the 28500 mark, BTC skew has shifted towards a put preference across all durations up to 3 months. However, the skew for longer terms consistently favours calls, a trend that’s been persistent for several months.
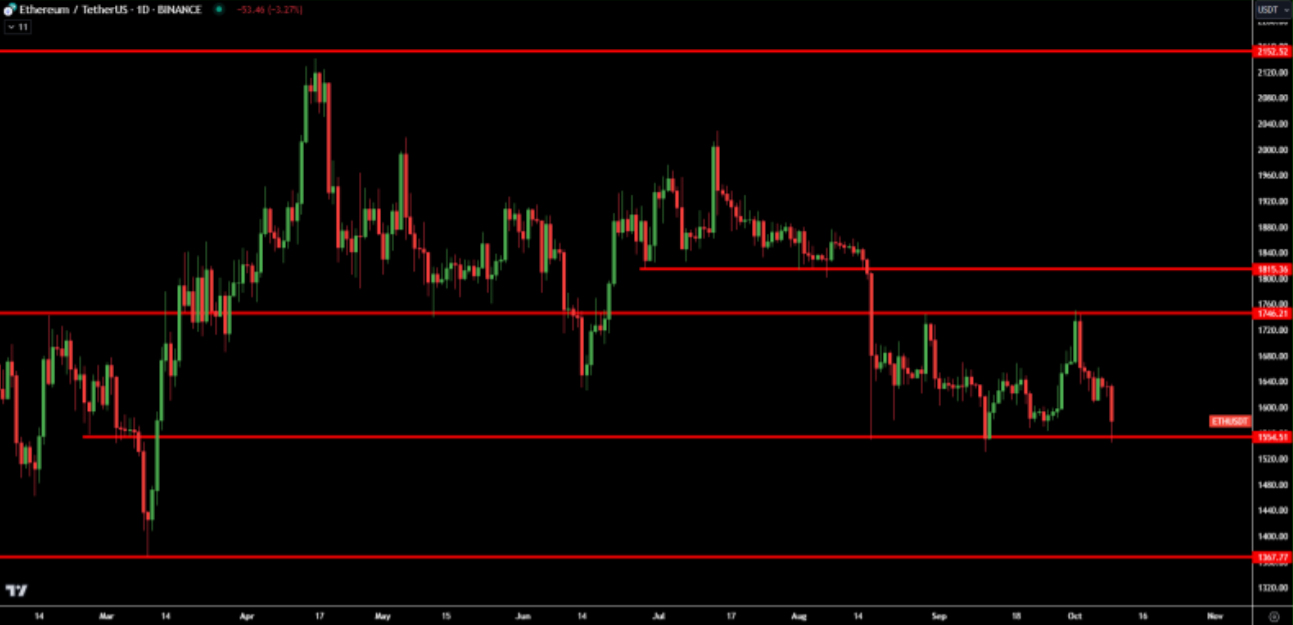
The surge in call bids for ETH skew witnessed last week was short-lived, as puts made a strong comeback this week (coupled with the return of call sellers). The curve, stretching to 3 months, is heavily tilted towards puts, with the 1-month duration showing a stark inclination at 7 vols. While the longer durations still lean towards a call bias, it’s much less than BTC’s.
The swift pullback in skew, following ETH’s price dip after a failed breakout, once again, underscores the fickle nature of crypto skew and the speculative use of out-of-the-money options. Another compelling reason for the growing demand for ETH puts is the breakout lower in the ETH/BTC chart, which has opened up more potential downside for ETH.
Option Flows And Dealer Gamma Positioning
Trading volumes for BTC options have seen a 15% drop as the spot market hovers within its range. A prominent overwriter rolled Oct23 29k short calls into Dec23 30k strike. Dec23 21k puts were sold (delta hedged), while 31k/37k call spreads were bought outright.
Volumes on ETH options took a significant plunge, falling by 30%, as the upside breakout in spot failed. The most substantial transactions were observed from a Nov23 1700 & 1750 call overwriter involving 60k options. Some Oct23/Nov23 call calendar spreads were bought.
As per the position of BTC dealer gamma, it has been progressively trending downwards, revealing a definitive bias to the upside. Should the spot price break the 30k barrier, the existing short position could nearly double. This estimation doesn’t factor in potential new call buying that may be stimulated by such a move.
In contrast, ETH dealer gamma showcases dynamics divergent to BTC, steadily climbing higher. If the spot remains under 1600, the net gamma will stay relatively neutral. However, a surge towards 1700 or beyond would tilt the position quite positive due to the sizable 1700 Oct23 long strike that dealers own. This pattern, observed most of this year, implies that ETH faces greater hurdles in rallies vs BTC.
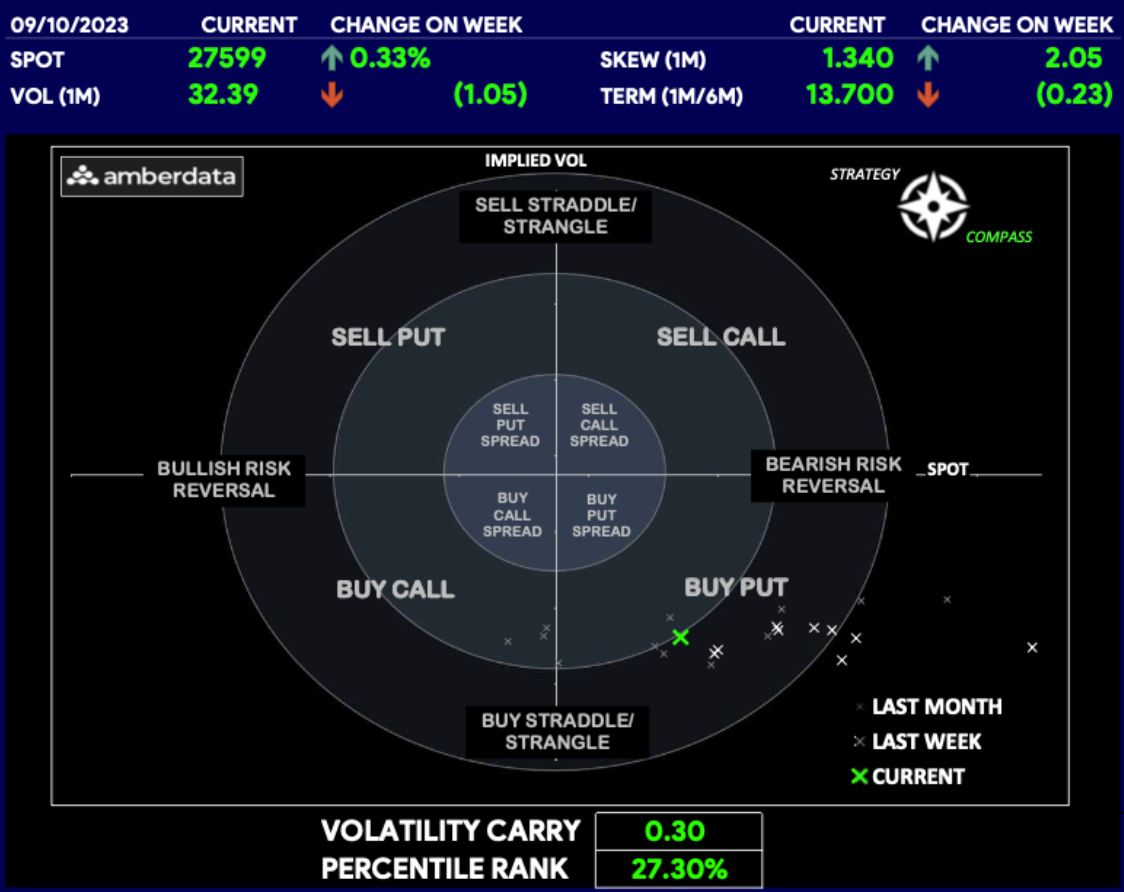
Strategy Compass: Where Does The Opportunity Lie?
With BTC back near the top of the range and looking like it’s failed to break once again. Those wanting to protect against a revisit of the lower end of the range near 25k could use short term puts or put spreads. We volatility still well supplied these options structures don’t look expensive to play directional views. We have seen hedging activity like this in block trades this week.
To get full access to Options Insight Research including our proprietary crypto volatility dashboards, options flows, gamma positioning analysis, crypto stocks screener and much more, Visit Options Insights here.
Disclaimer
This article reflects the personal views of its author, not Deribit or its affiliates. Deribit has neither reviewed nor endorsed its content.
Deribit does not offer investment advice or endorsements. The information herein is informational and shouldn’t be seen as financial advice. Always do your own research and consult professionals before investing.
Financial investments carry risks, including capital loss. Neither Deribit nor the article’s author assumes liability for decisions based on this content.
AUTHOR(S)
Imran Lakha is an expert at using institutional options strategies to capitalize on investment opportunities across global macro asset classes. Learn more here.