
As we approach the next Halving day, the price of Bitcoin stays in range, not seeking new highs or lows. This type of scenario is normal while large investors seek to accumulate Bitcoins for the next bull run.
But… what does the price do during these lateralizations?
The price seeks market liquidity, repeating the liquidation cycles over and over again. Through these cycles, money flows from weak hands to strong hands, flows from retail operators to institutional funds.
These cycles, where they liquidate all the leveraged positions, can be seen below.
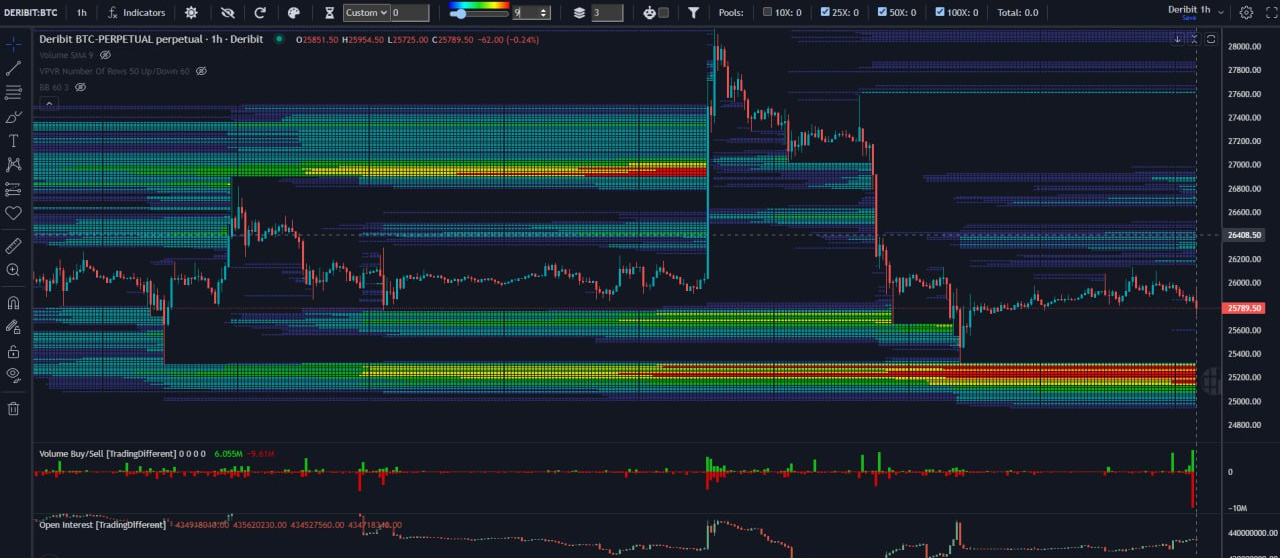
Figure 1
The Liquidation Heatmap graph shows us the Liquidation Pools, which indicate, through a mathematical algorithm, where all traders who enter the market over-leveraged could lose. This algorithm, developed by the Trading Different team, shows us where the price would be most likely to go, forced by high-frequency bots. These high-frequency bots take advantage of market failures, force the price in one direction, and use Stop Loss zones and Liquidation Points to close out their large-volume winning positions.
In the area of USD 26,400 we can see a new Liquidation Pool, which the price will look for in the coming days to get the short 100x and 50x leveraged out of the game.
In order to observe how the bots operate in real time, it is important to have the High Frequency graph (figure 2). It shows the Buy and Sell trades that enter the market, at the millisecond level. In this way, the algorithm identifies the bots and translates it into an HF indicator.
In the last hours, the High Frequency bots have been operating in Sell, executing more than 50 trades per second. In order to see an upside manipulation and liquidate those Pools at $26,400, we will need to see large Buy Orders at millisecond speeds executed by the bots.
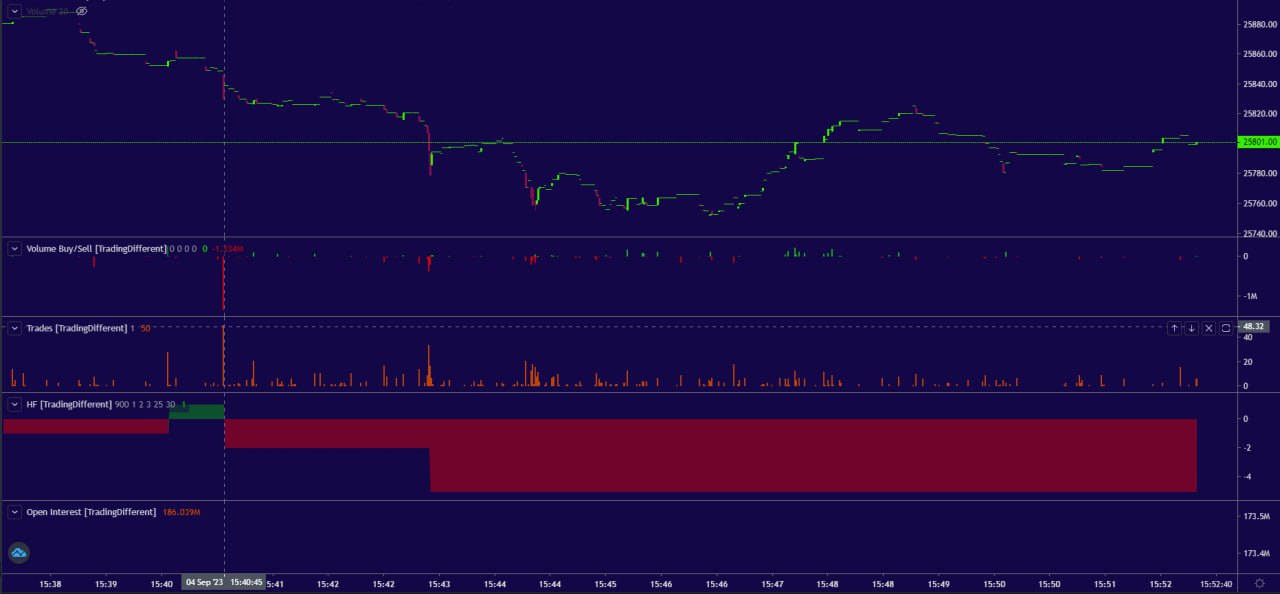
Figure 2
AUTHOR(S)
Trading Different, provides traders with unique tools and indicators in the crypto ecosystem, making their trading systems more efficient. Our Liquidation Heatmap indicates, through a mathematical algorithm, where all the over-leveraged traders lose based on their liquidation points and their Stop Losses. Learn more about Trading Different here.