
The price of Bitcoin currently remains in the range of 30,500 USD. It has had a good recovery, after visiting the area of 24,800 USD where it liquidated all long positions.
From those liquidations, the price began to rise strongly, liquidating each Pool that we see in the Liquidation Heatmap graph.
The last important liquidation occurred when the price reached USD 31,400 (graph 1) where it took out of the game all the positions that had been looking for shorts in the market. After that the price began to lateralize.
The Liquidation Heatmap graph shows us the Liquidation Pools, which indicate, through a mathematical algorithm, where all traders who enter the market over-leveraged could lose. This algorithm, developed by the Trading Different team, shows us where the price would be most likely to go, forced by high-frequency bots. These high-frequency bots take advantage of market failures, force the price in one direction, and use Stop Loss zones and Liquidation Points to close out their large-volume winning positions.
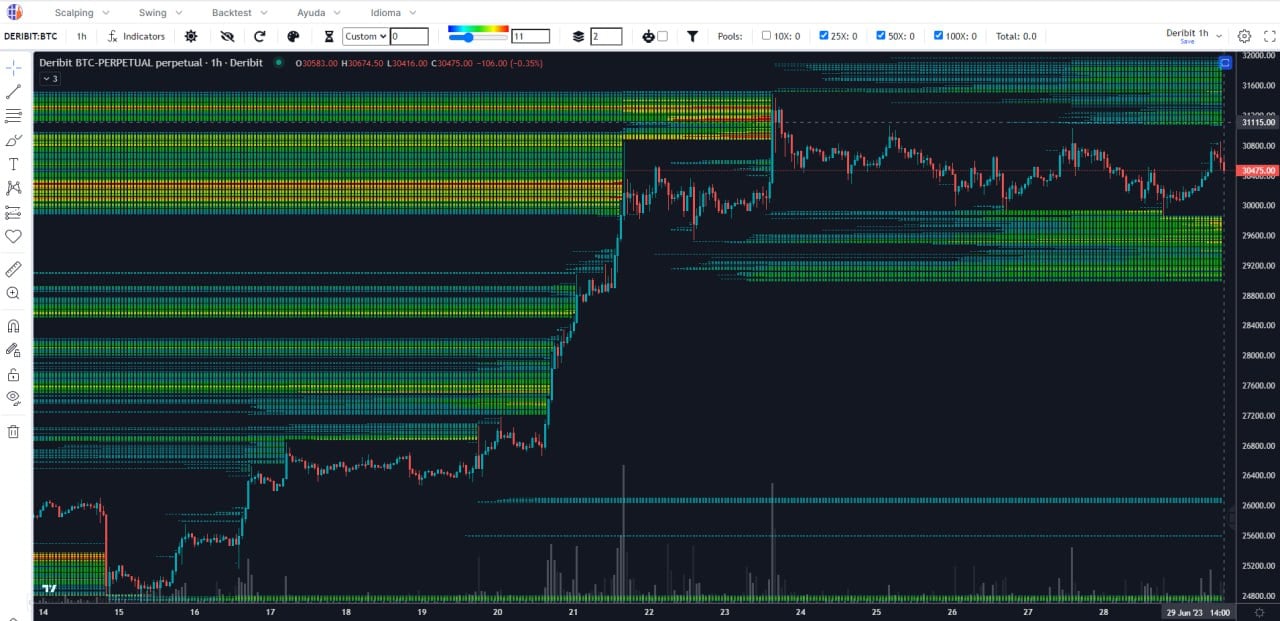
Graph 1
In order to observe how high frequency bots operate in real time, it is important to have the High Frequency graph (graph 2). It shows the Buy and Sell trades that enter the market, at millisecond level. In this way, the algorithm identifies the bots and translates it into a HF indicator.
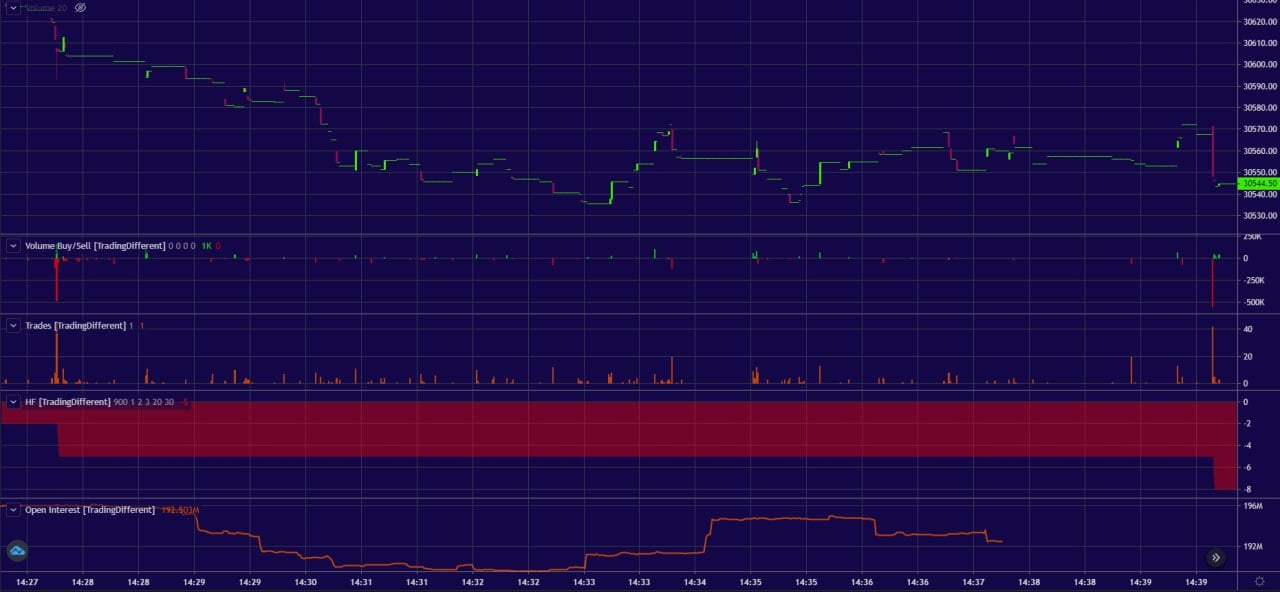
Graph 2
What can we expect for Bitcoin?
Since it was in range, the price has had several rejections in the area of 30,900 USD. As time goes by, that zone fills up more and more with liquidity, forming a block of Pools from 31,000 to 31,800 USD. It is not yet enough accumulated liquidity to break up, but as days go by and the price remains in a range, it will increase and these Pools will be the vehicle to seek new highs.
So, in the short term, we could expect long positions to be taken out of the market, that is to liquidate the Pools that are below USD 29,800. In this case we cannot expect a complete liquidation of all the Pools at the bottom, because the main trend is bullish and they will manipulate the price as far as they can, probably liquidating 50x leveraged.
Try for Free the Liquidation Heatmap and the High Frecuency Graph here.
AUTHOR(S)
Trading Different, provides traders with unique tools and indicators in the crypto ecosystem, making their trading systems more efficient. Our Liquidation Heatmap indicates, through a mathematical algorithm, where all the over-leveraged traders lose based on their liquidation points and their Stop Losses. Learn more about Trading Different here.