

BTC Pulls Back Driven by Futures Liquidation
Bitcoin and other cryptocurrencies finally experienced a meaningful correction, triggered by the latest proposed ‘anti-crypto’ bill from US Senator Warren, which was amplified by an overleveraged perpetual futures market, particularly in Bitcoin. Before this downturn, open interest in all Bitcoin exchanges had reached about $12 billion, a level at which historical patterns suggest a likelihood of increased volatility, especially when the market is imbalanced, as it was recently the case.
Back in November, the market hit the same levels of leverage, but the sentiment was more divided, and we didn’t reach the same extreme funding rates, like those observed recently. In spot markets, it’s common for the majority to favour one direction, but perpetual markets are designed to balance themselves, as each short position is matched by a long one, resulting in a zero-sum game.
Therefore, through funding rates and liquidation mechanics, the futures market tends to self-correct. This correction, however, is considered a healthy response given the ongoing positive catalysts lined up for Bitcoin later next year, namely the ETF approval, halving, Fed’s pivot…
It’s also worth noting that Bitcoin had recently doubled in value over just two months without any significant corrections. Corrections weed out “weak hands” and allow for a stronger foundation to resume the trend up. The vol is an inherent aspect of BTC’s market dynamics, not a flaw.
Looking at the macro picture, this week’s US CPI failed to move the needle pricing-wise and the Federal Open Market Committee (FOMC) decision, which will help Mr. Market to further understand the Fed’s stance on rates, is not expected to be a vol event either. Nonetheless, crypto has recently shown a tendency to remain largely unaffected by these broader macroeconomic factors.

Vol Carry Evaporates as Realized Spikes
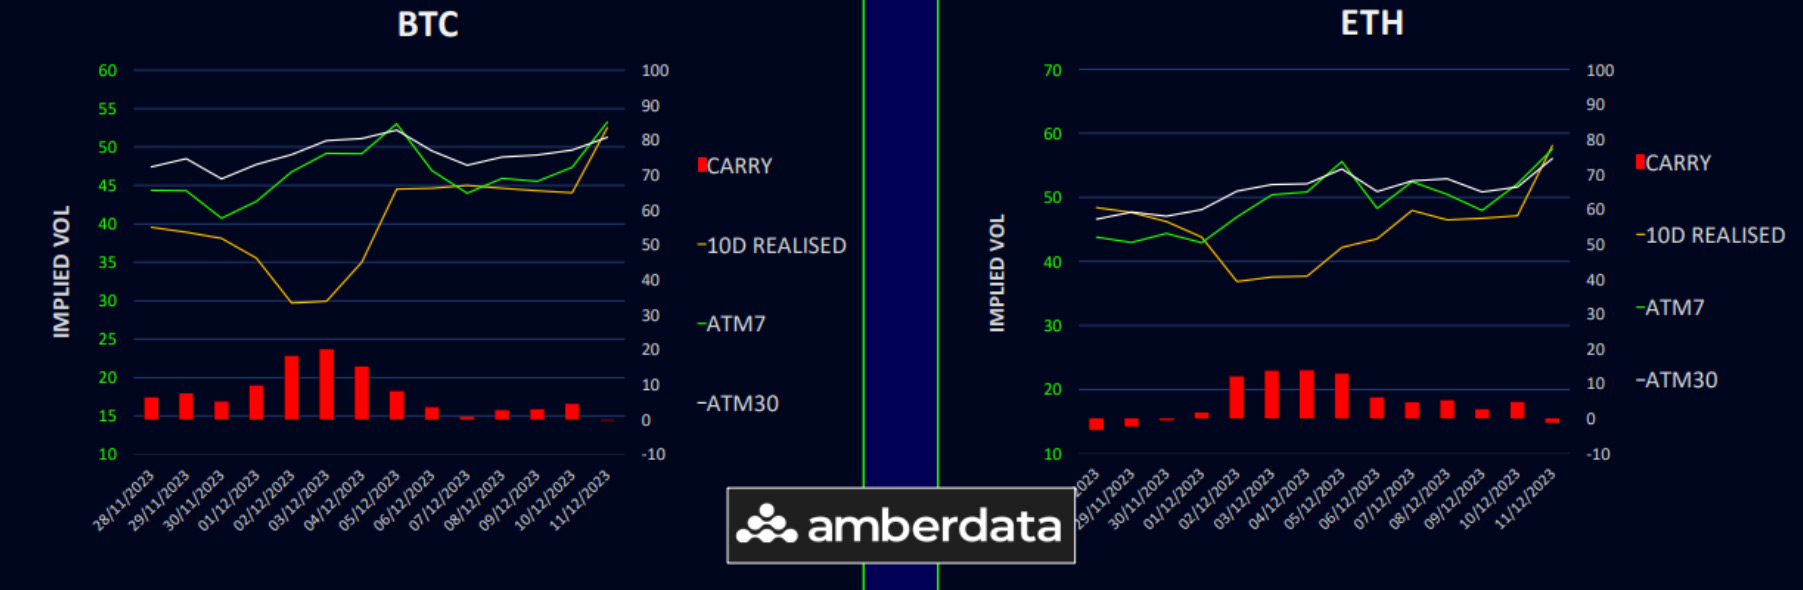
This week, both Bitcoin and Ethereum experienced a significant increase in realized volatility, reaching into the 50s, primarily driven by a sharp 6% sell-off on Monday. This drop was a result of overleveraged long positions being liquidated, following the introduction of an anti-cryptocurrency bill by Senator Warren. Implied volatilities returned to last week’s highs after a period of decline, particularly as Bitcoin traded near $44,000. The previously positive volatility carry has now evaporated to nearly zero due to the actual market movements being more abrupt than anticipated.
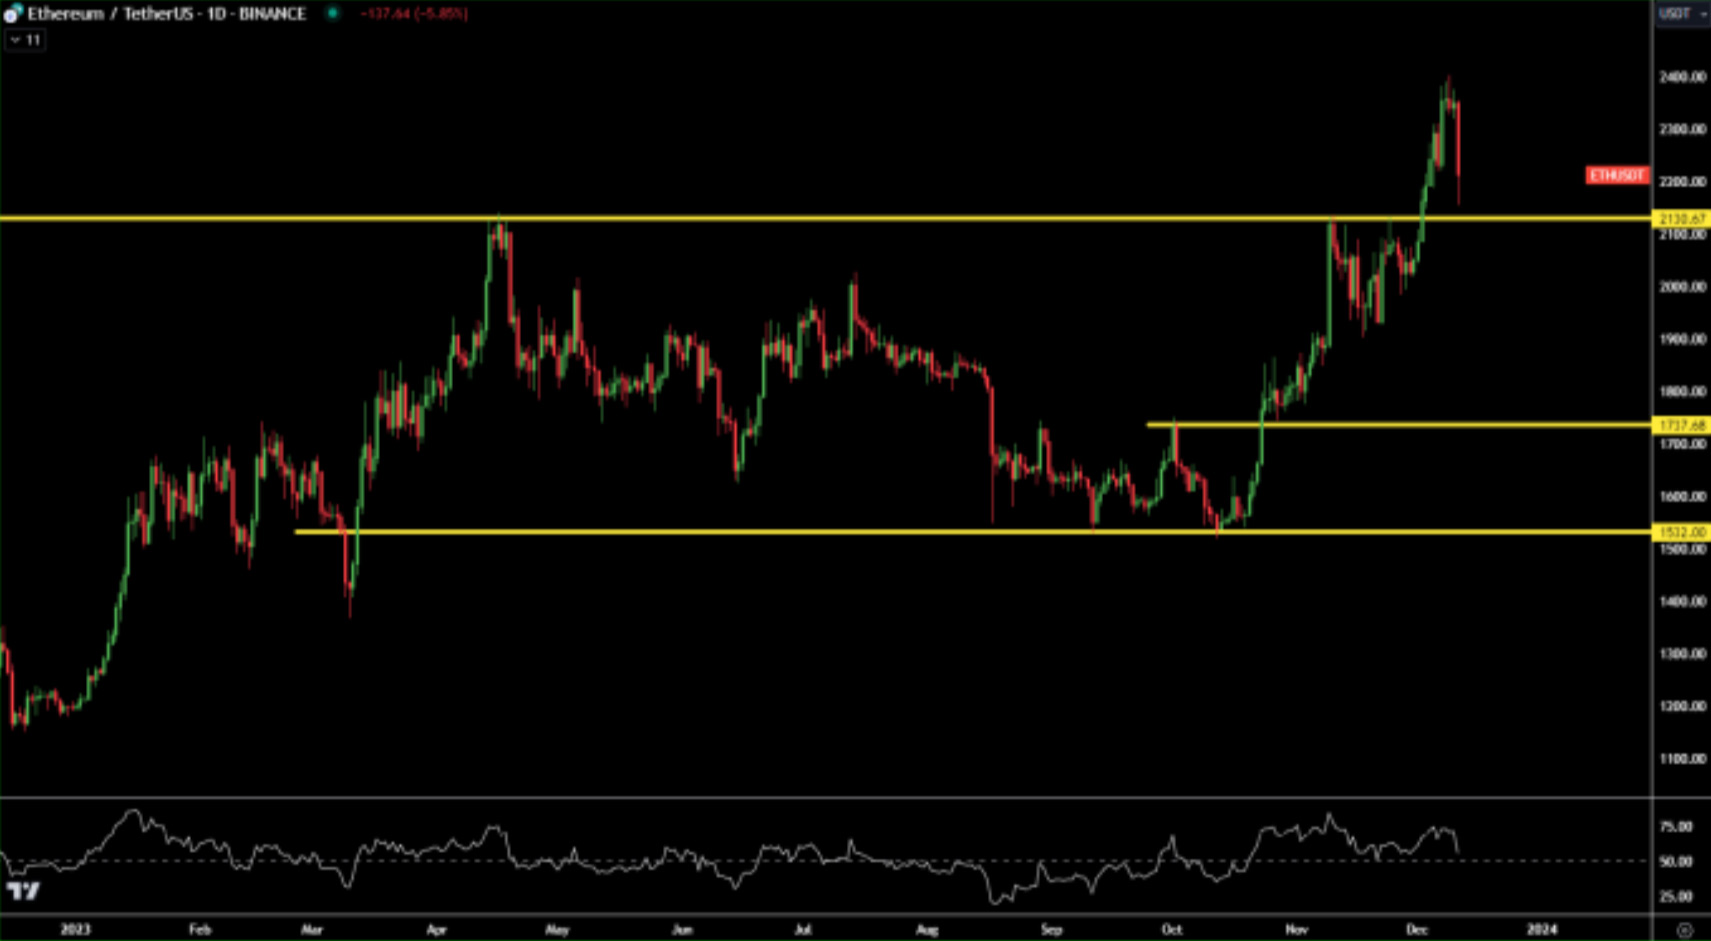
If Bitcoin maintains its bullish stance above the crucial $38,000 zone, this correction could be a healthy one. We anticipate volatility to return to average levels over the coming weeks, provided Bitcoin can gradually recover and stabilize within the $40,000 to $45,000 range. Utilizing this downturn to sell puts against underweight positions makes sense. Selling some upside for the 29th of December (maybe after a bounce) is also a viable strategy, especially considering the unlikely event of breaking that level before the ETF announcements scheduled for early January.
BTC Term Structure Pops in the Front-End
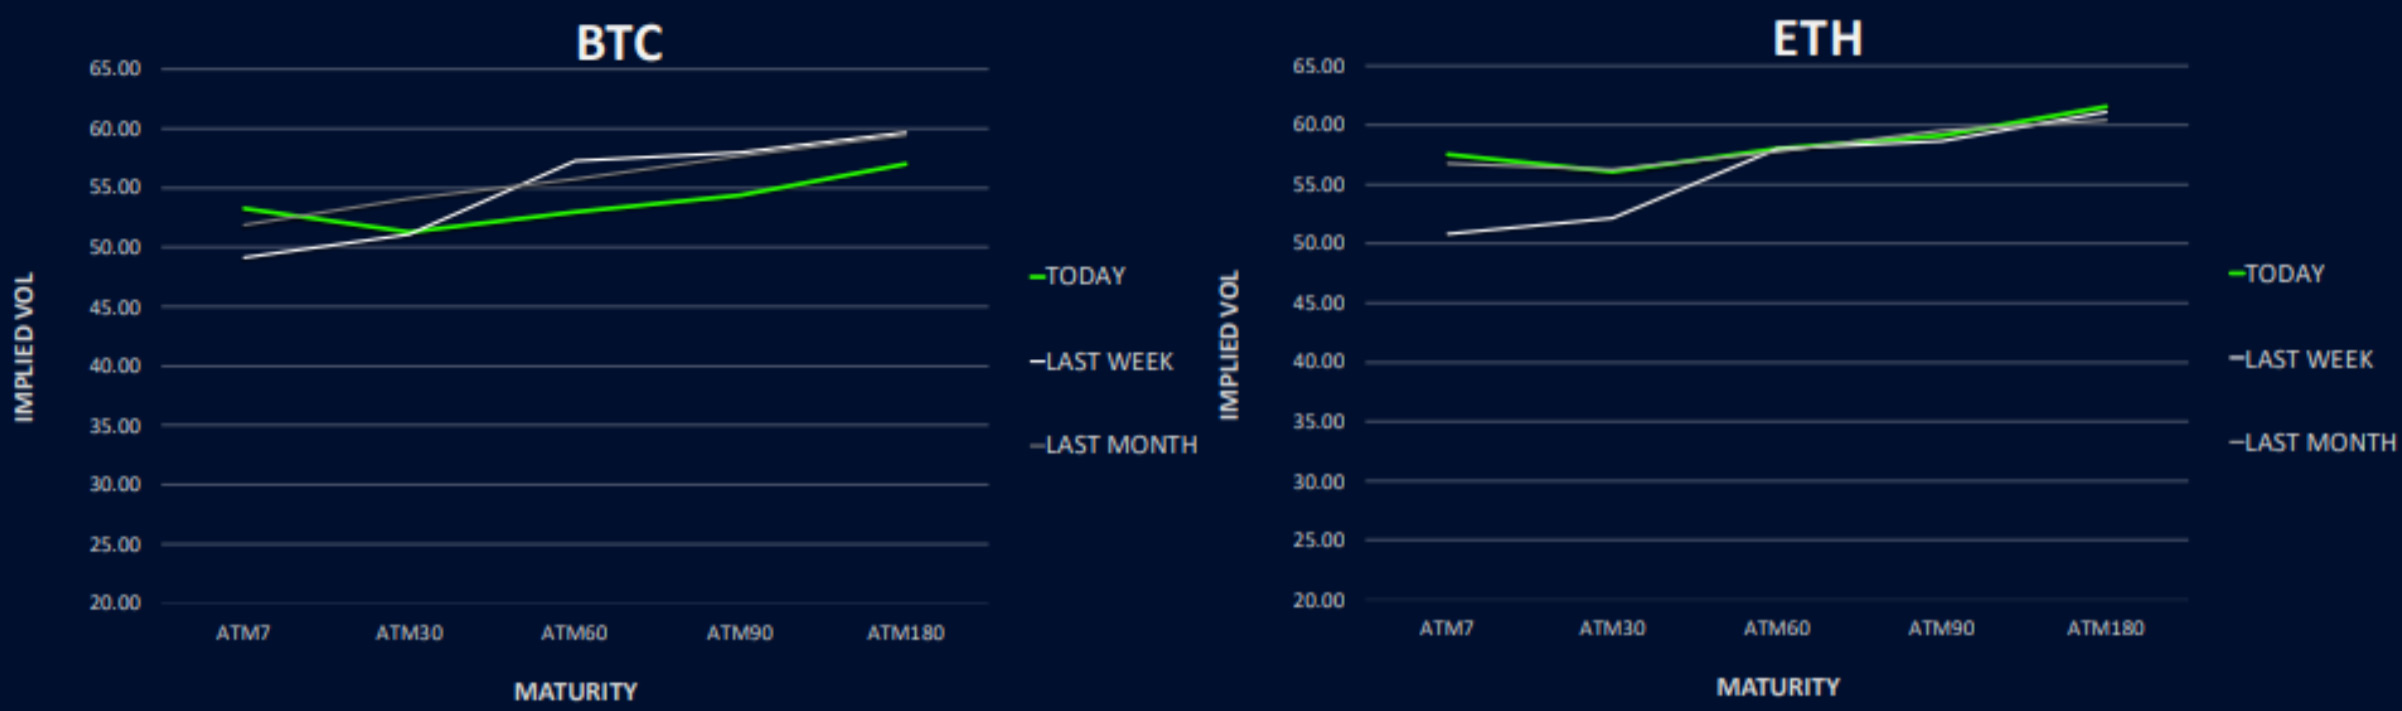
The BTC term structure experienced a sudden increase at the front end due to the sharp sell-off yesterday, but it’s already showing signs of reverting lower. The GAMMA buckets, extending to the 29th of December, remained mostly unchanged or slightly down over the week. However, the rest of the curve suffered declines of 2-4 volatilities, with February 24th experiencing the most pressure.
In contrast, the ETH term structure flattened as the front end gained momentum. The GAMMA buckets for ETH increased by about 3 vol points as the spot price dropped. The rest of the curve showed minimal changes, except for February 24th, which saw a slight decrease of 0.5 vol. Once again, ETH’s long-term volatility performance exceeded BTC’s, aligning with expectations.
ETH/BTC Vol Spread Shifts Higher
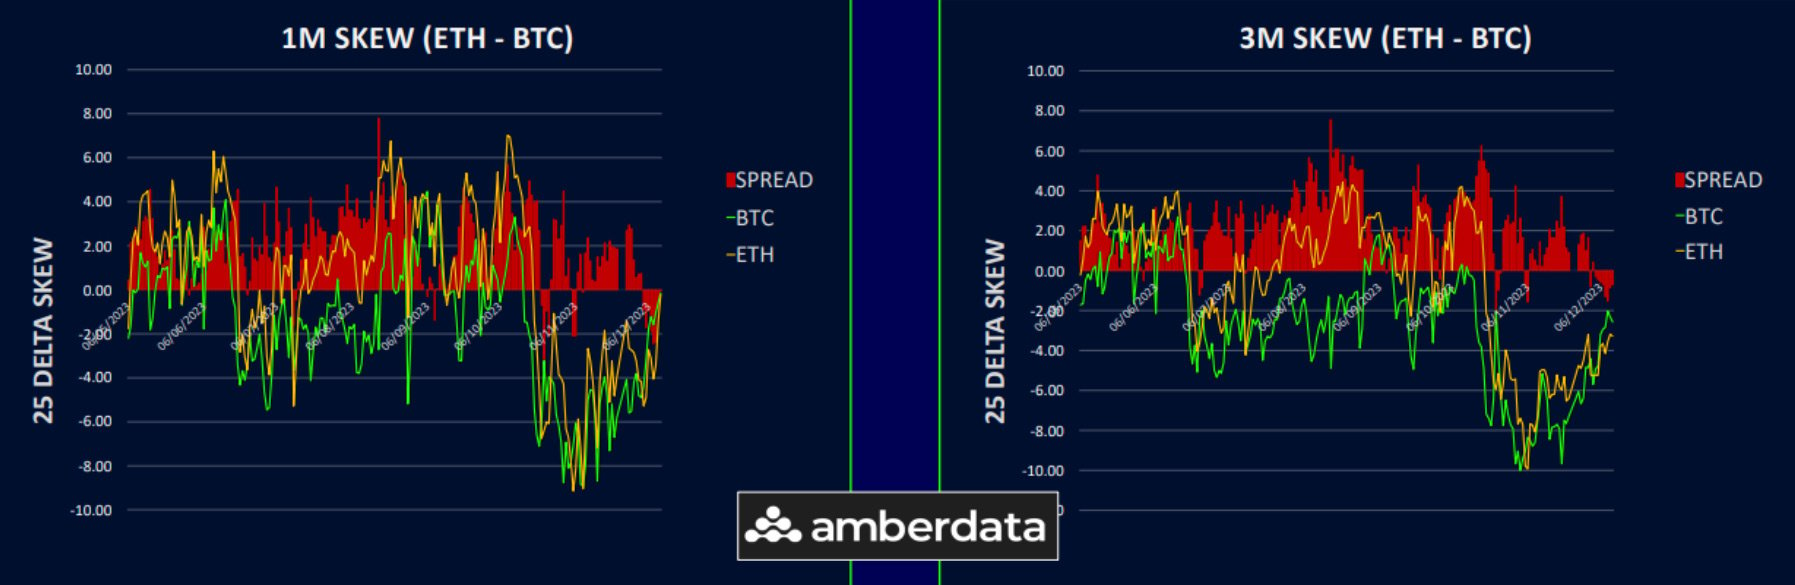
The volatility spread between ETH and BTC is widening again, with BTC volatility decreasing while ETH remains firm. This change has pushed the volatility spread to 4-5 volatilities (in favour of ETH) across the entire curve. The ETH/BTC spot chart saw a significant recovery from support last week but is now drifting lower again. The realized volatility spread is currently about 6 vols in favour of ETH, and the implied spread is converging towards this level.
The recent drop indicated that ETH might be more susceptible to downside movements, and with potential ETF narratives next year, the volatility distribution for ETH could expand. This could result in consistently higher implied volatility for ETH, reminiscent of when ETH volatility was 10-15 volatilities above BTC’s.

Big Repricing of Skew
This week saw a major adjustment in skew, driven by a surge in demand for short-dated downside protection, causing put skew to increase in front-end expiries. The weekly skew has shifted to a 3-4 volatility put premium, reflecting investors’ sudden realization of the downside potential short term, even as they anticipate ETF approvals. Last week, we observed a flattening of short-end call skew, suggesting at least a temporary market pause.
Long-end skew continues to show a call premium, indicating the options market’s view that this correction is a healthy adjustment within a strong uptrend, and the potential for upside next year remains dominant in traders’ minds. As we look further along the curve, ETH call skew is slightly higher than BTC’s, suggesting that the market anticipates ETH may gain more attention following ETF approvals next year.
Leveraging the spike in short-term volatility and put skew to sell puts can be a sensible strategy for those looking to capitalize on dips. As always, the size of these positions is crucial, as the recent market dynamics have shown how quickly positions can be liquidated.
Option Flows And Dealer Gamma Positioning
Last week, BTC options volumes surged by 68%, reaching around $10 billion. This increase was mainly due to profit-taking in calls, particularly for the 29th of Dec at the 40,000 and 42,000 strike. Straddles were sold at the 29th of December 44,000 strike, balanced by the buys of 45,000 calls.
ETH volumes increased by 30% to $3.3 billion. Activity was observed in buying ETH volatility for the 29th of December and 26th of January in the 2400-2600 strike range. Investors continued to roll March 24th 2300 calls into June 24th.
In terms of dealer gamma positioning, BTC became more negative as put buyers emerged on the 15th of Dec, anticipating further downside. For ETH, dealer gamma is moving towards a neutral position, as dealers appear to be short on local strikes for the 29th of December but long on distant strikes against it. This positioning indicates that ETH might not experience movements as dramatic as BTC’s, though yesterday’s volatility suggests that other factors beyond options may be at play.
Strategy Compass: Where Does The Opportunity Lie?
Once this correction reaches its conclusion, we suspect the markets to drift back up into late December. The gamma sellers are likely to return and so selling 29Dec options vs owning 26Jan looks like a sensible way to earn some premium over the holiday period as term structure is unlikely to stay so flat. The real action should be coming in January!
We also like using this dip to enter more long dated call exposures in ETH as the call skew is signalling some bullish longer term potential, which we think will gain more traction after the ETF approvals for BTC have passed.
To get full access to Options Insight Research including our proprietary crypto volatility dashboards, options flows, gamma positioning analysis, crypto stocks screener and much more, Visit Options Insights here.
Disclaimer
This article reflects the personal views of its author, not Deribit or its affiliates. Deribit has neither reviewed nor endorsed its content.
Deribit does not offer investment advice or endorsements. The information herein is informational and shouldn’t be seen as financial advice. Always do your own research and consult professionals before investing.
Financial investments carry risks, including capital loss. Neither Deribit nor the article’s author assumes liability for decisions based on this content.
AUTHOR(S)
Imran Lakha is an expert at using institutional options strategies to capitalize on investment opportunities across global macro asset classes. Learn more here.