
As we revisit the topic of delta hedging we are going to study the interplay of realised and implied volatility against pnl as well as the impact of hedging frequency on pnl. In order to keep this piece easily digestible and not scare off those less mathematically inclined, my quants have mercifully agreed to create some charts to help visualise my senseless ramblings thereby allowing me to omit the otherwise monstrous equations you might find in these writeups.
To begin with let’s recount the principle of delta hedging that we touched on in the first writeup. Options grant users exposure to leveraged returns; both the good kind (positive) and the not so welcome kind (negative). While it’s permissible to simply buy/sell an option and take a punt on a move higher or lower, many traders opt to simultaneously sell/buy a representative portion of the underlying asset, thereby apparently mitigating the chance to generate pnl. While this might seem counterintuitive, it turns out there is a method to the madness: rather than trade directional risk, volatility itself becomes the focus- the magnitude in difference between daily returns.
Remember that volatility is the unknown element when pricing an option. We know all other parameters but have to estimate what volatility the underlying will experience over the given tenor. And just how is this done? Well, this might not prove a satisfactory answer but the truth is we deduct vol by reverse engineering the market price i.e. given that the market as a whole has priced this option at value x, we deduce that the corresponding vol level is y.
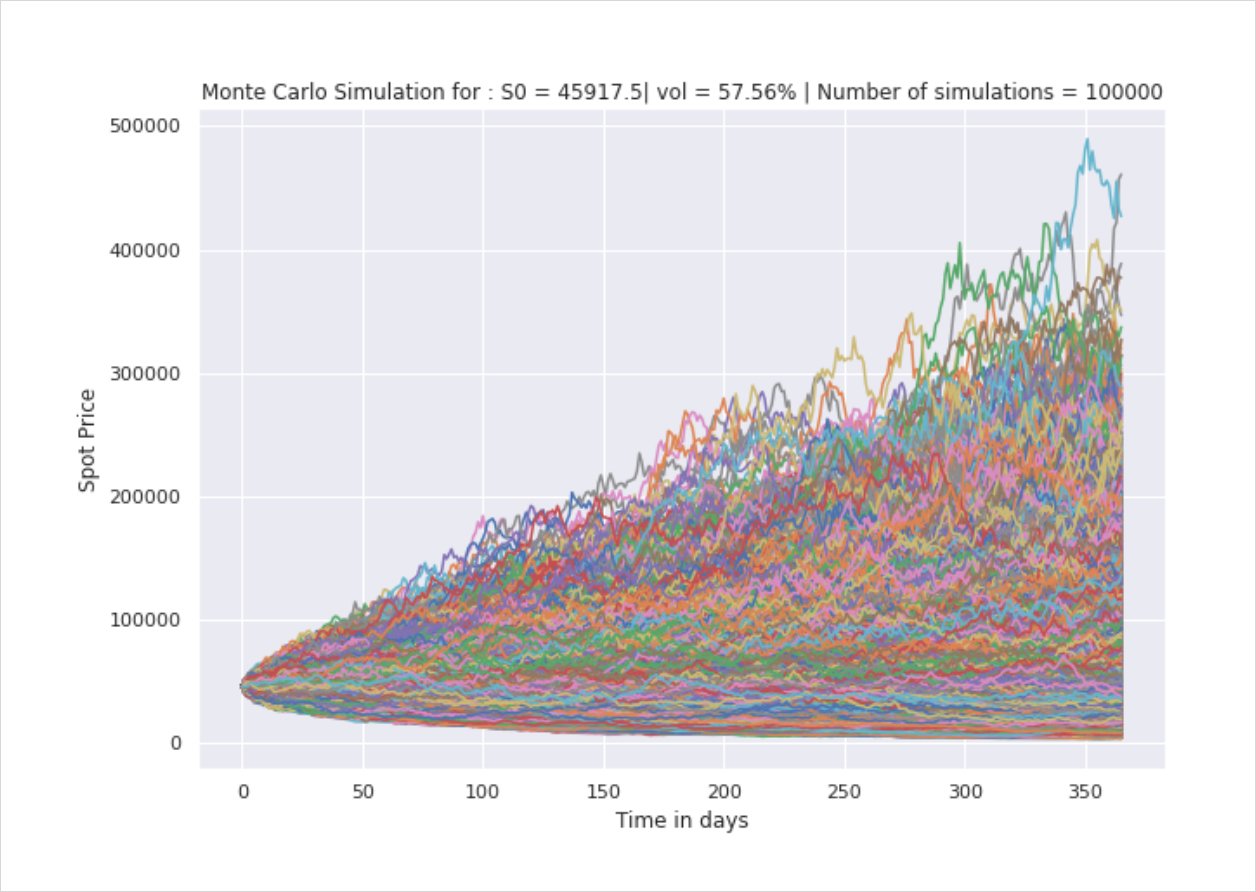
‘Good to know but what do we do with this?’ I hear you ask. Great question, let’s consider the following: below are a series of paths generated with the same vol. As you can see, there are a handful of errant paths but most generally cluster between 0 and 300,000.
Let’s buy a call option and delta hedge accordingly i.e. buy low and sell high. Yay! We always make money!? Right? Well yes and no. Let’s assume we buy a Call, we will immediately sell the delta equivalent in the underlying. Suppose the market rallies, the idea of delta hedging is that we remain directionally neutral therefore as our calls becomes ITM, our short position in the underlying suffers a loss so in effect the pnl from the Call nets the pnl from our underlying. Importantly, now that the market has risen, our delta value has changed. We will need to sell even more of the underlying to remain delta neutral. If the market drops, our delta value will fall, and as such, we buy back some of the underlying.
So yes it seems this process generates pnl but do remember you have a handful of factors working against you:
- You paid a premium for the option.
- Time is constantly eroding which means you have fewer opportunities to rebalance with each passing moment.
- The magnitude of movements (up and down) may be meager and therefore won’t deliver significant pnl. So yes, you make money on your delta hedge but it is not guaranteed to outweigh your expenditure.
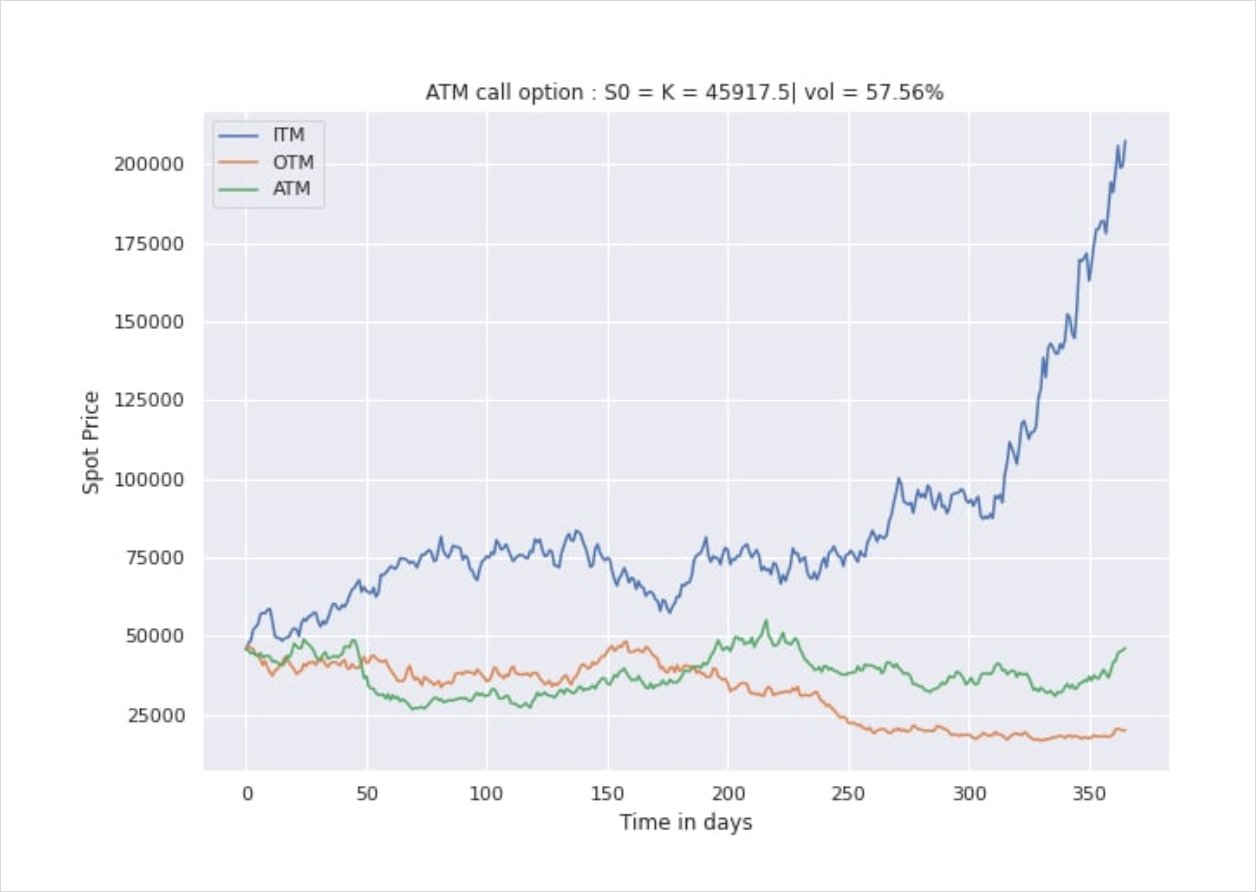
Take the above instance for example, while the ATM and OTM paths clearly would not result in an ITM expiry, there stands the possibility to recoup at least part of the premium paid for the option should the magnitude of daily movements generate enough opportunities to rebalance. The ITM expiry clearly presents a favourable outcome for the holder, in this instance you might want to consider amending your hedging vol. Re Vol estimate and Gamma exposure, this was discussed in Pt 1.
Now for the fun part, if you rebalance your deltas and realised volatility turns out to be equal to the initial implied volatility, your pnl distribution should resemble the below.
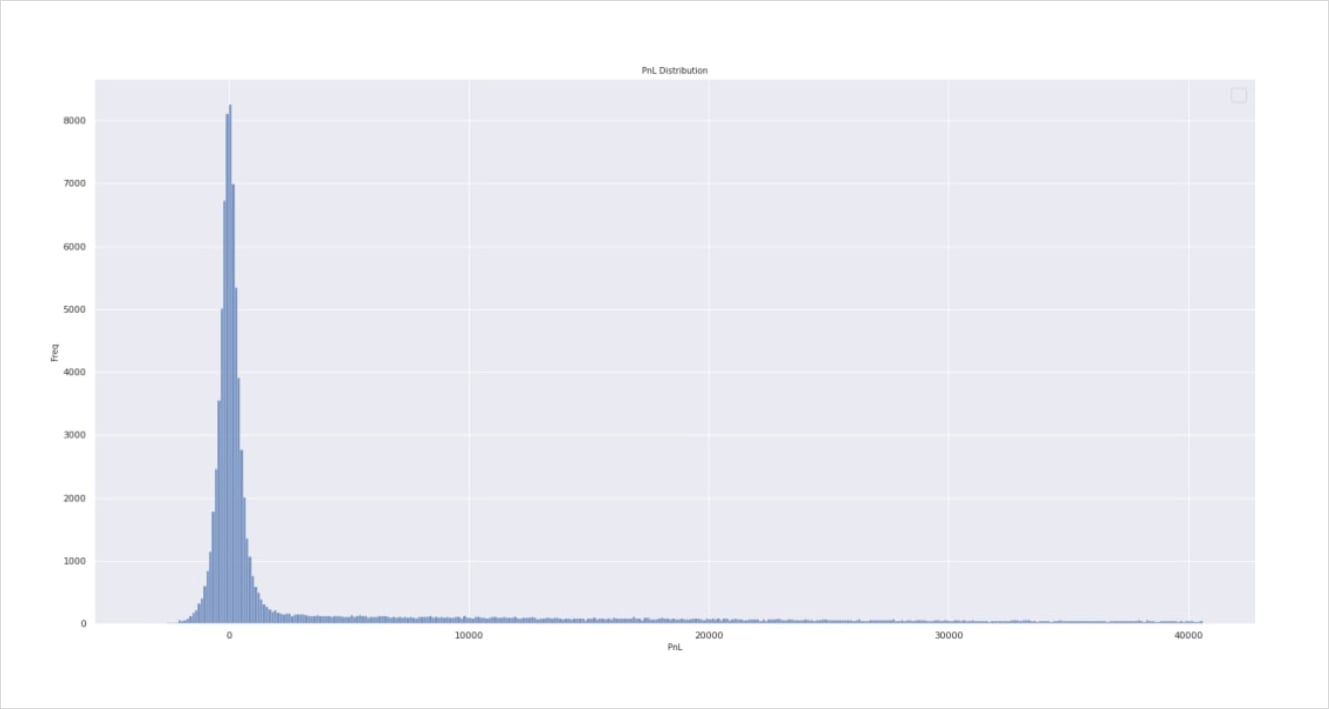
That is to say, on average, you will break-even e.g. Yup, it literally took me close to 600 words to tell you that you’ll finish right where you started but do this enough times and you will recuperate the premium paid and that’s it. However due to the path dependent nature of options, some paths will rocket well beyond your strike, resulting in a deep ITM position.
As a side note, translating the resultant pnl distribution into expiry price by pnl will give you something that looks a little familiar.
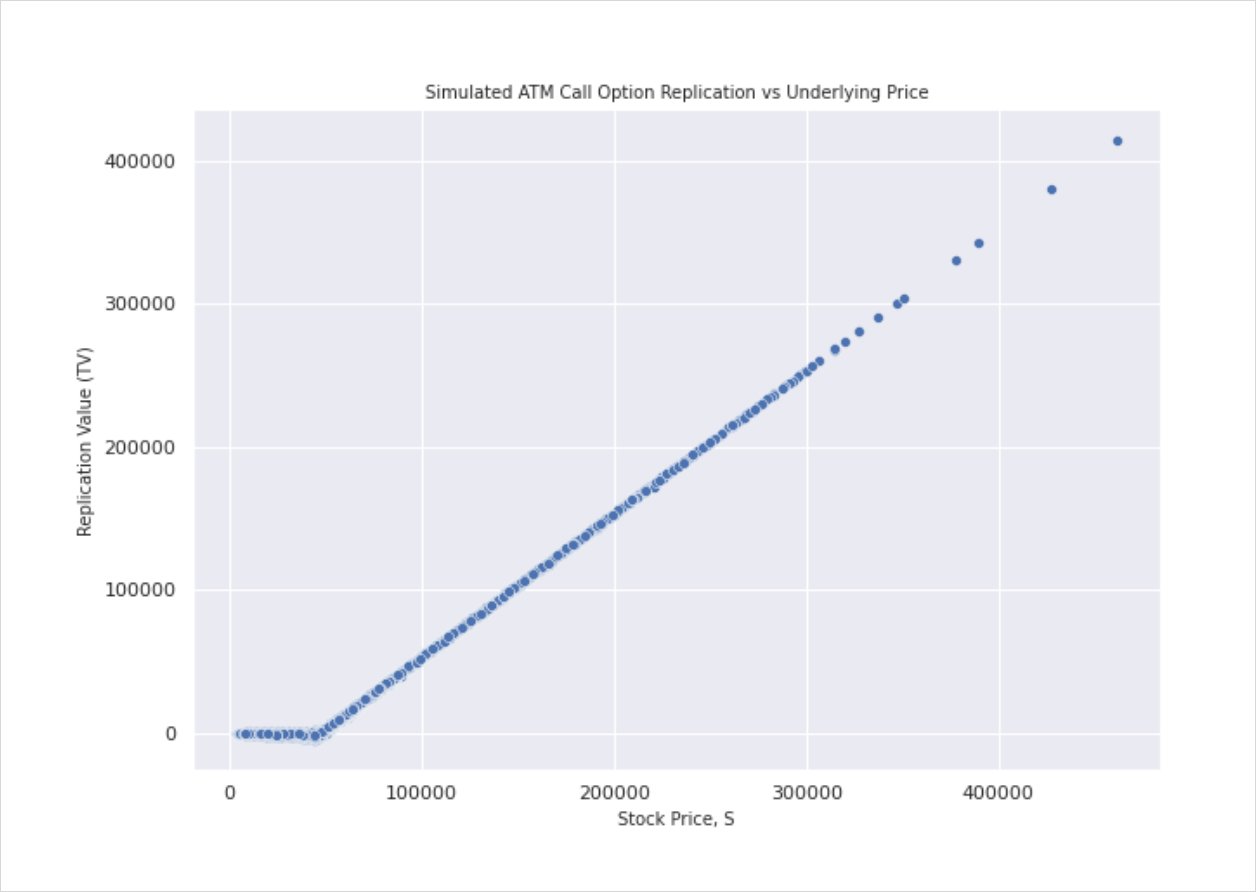
Yup! Conducted over enough instances, your pnl will, intuitively, plot out the payoff of the traded product.
Now that’s established, let’s add in the component of implied vs realised. In the above scenario, our hedging volatility (realised vol) was equal to the option’s implied vol, hence we broke even. But remember when I said volatility is the unknown that is deducted via reverse engineering. What if the vol implied by the market price is wrong and in fact the vol realised over the next x weeks/months is uncharacteristically wild. If you bought an option when IV is forecast to be low but the realised vol turns out to be high, and you delta hedge at your initial IV (or close enough), you should generate returns in excess of what was forecast i.e. positive returns (less transaction fees, spread, premium etc).
Below are a series of charts comparing pnl distribution of implied vs realised vol with implied held constant at 57.56%.
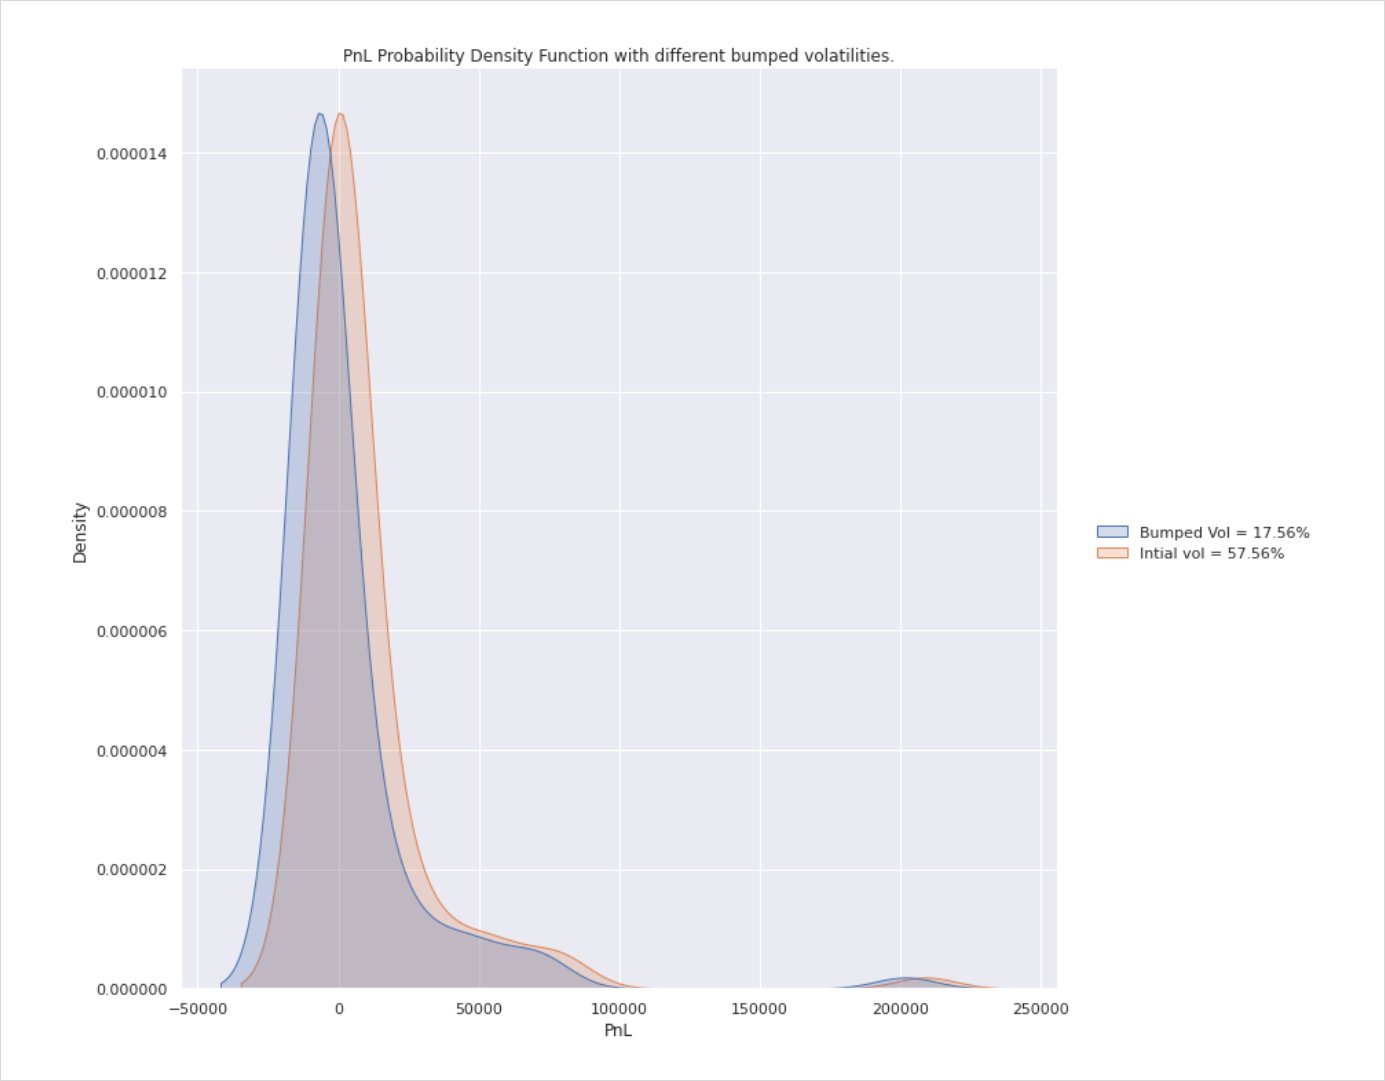
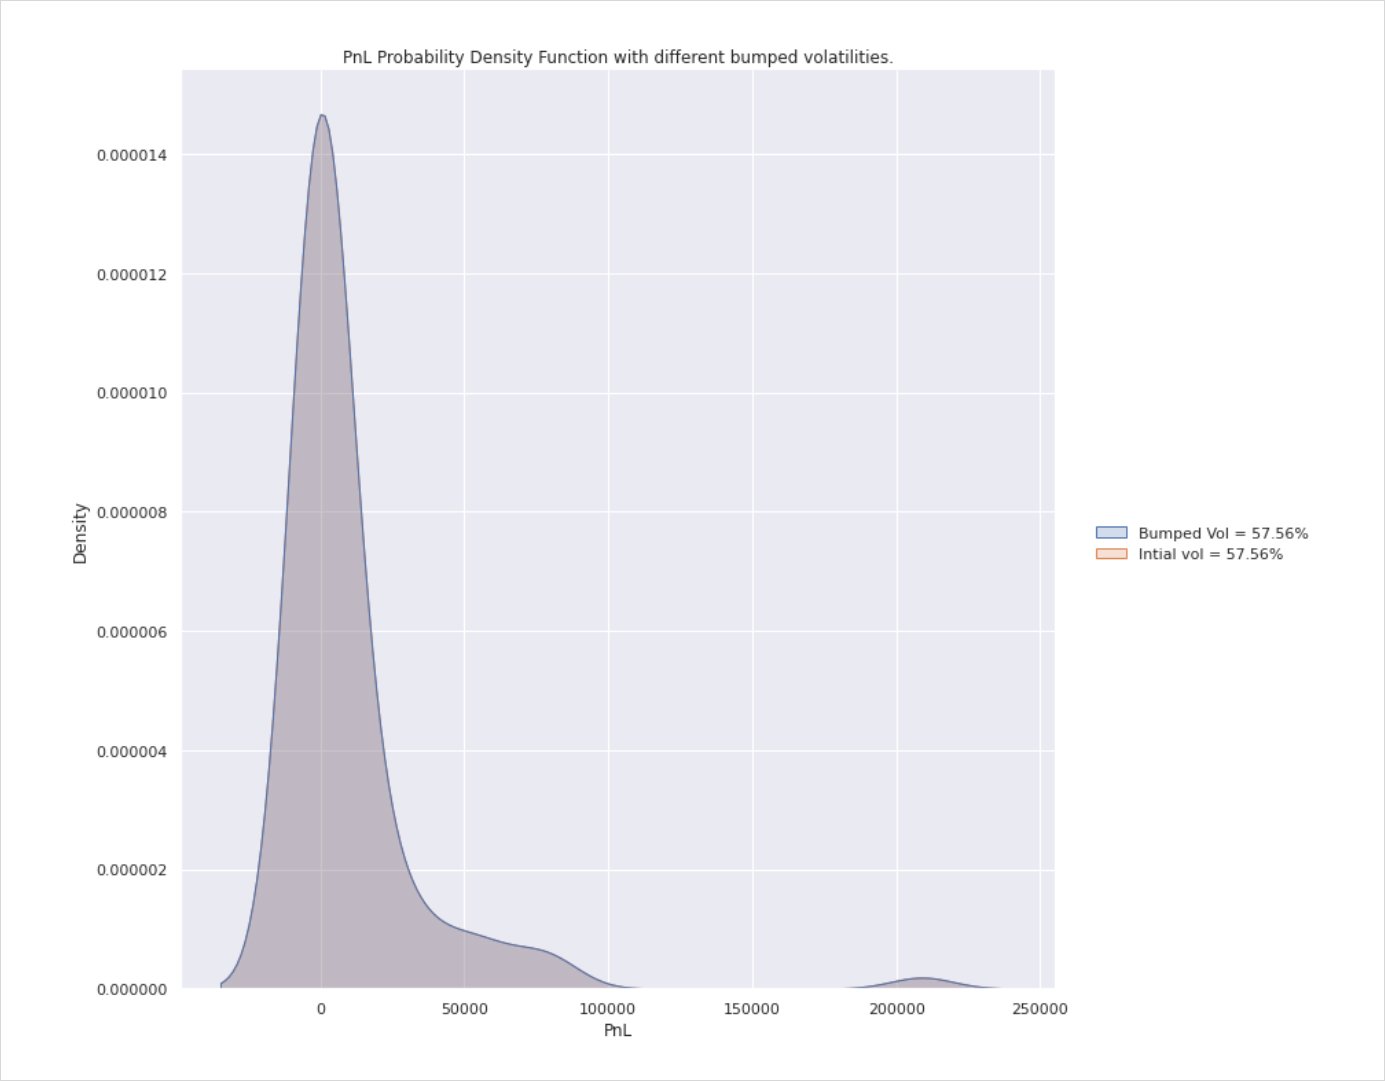
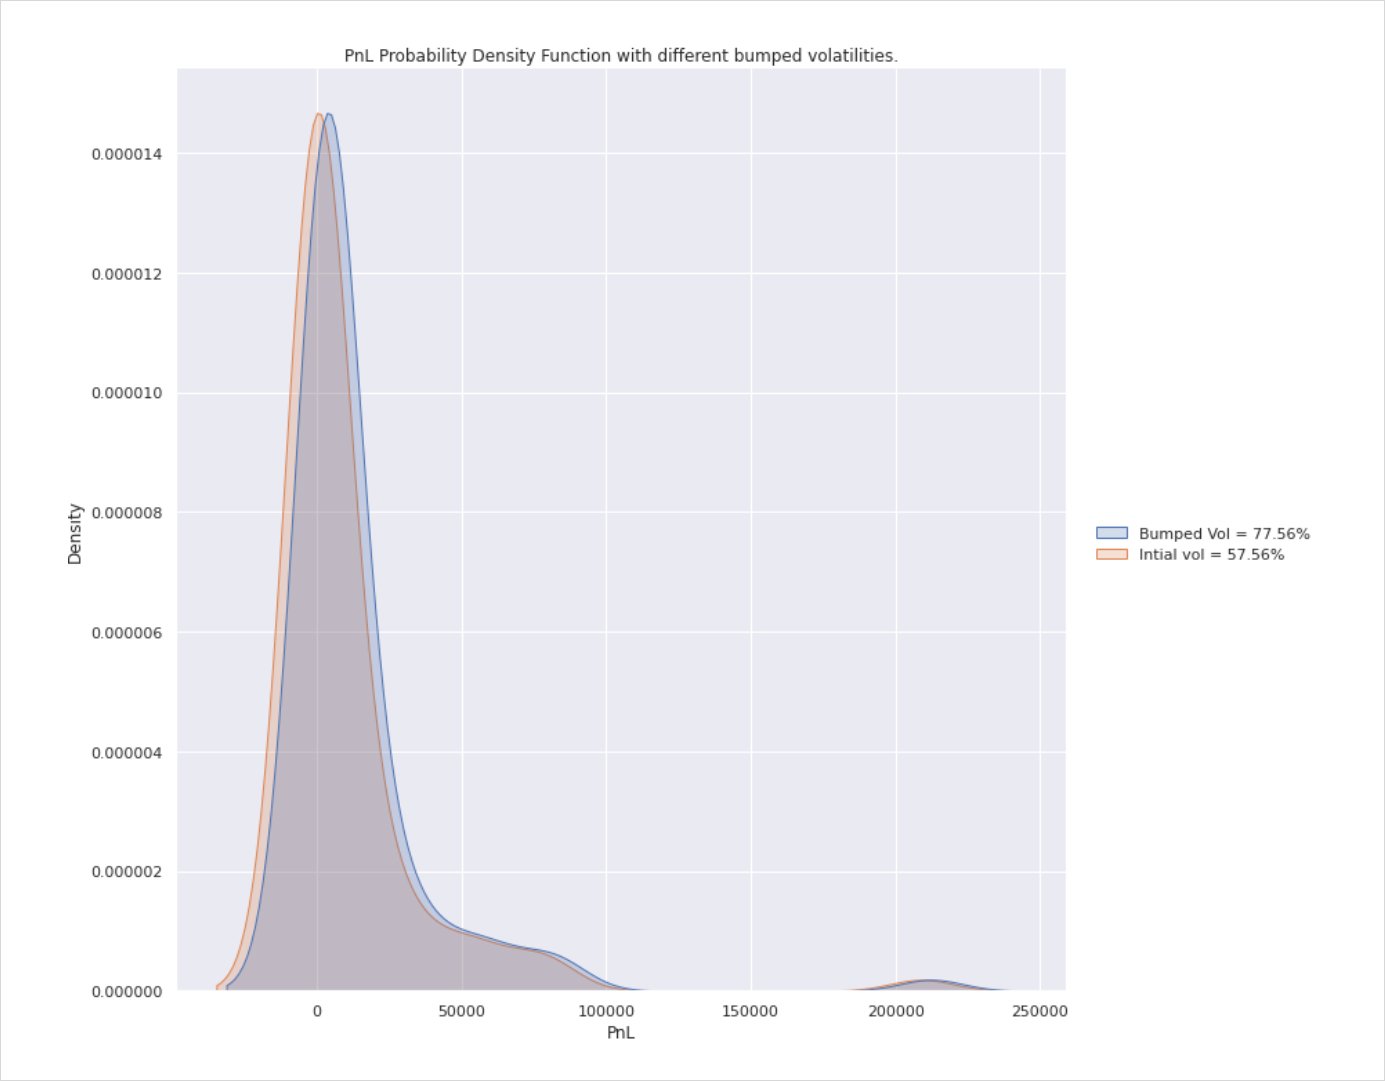
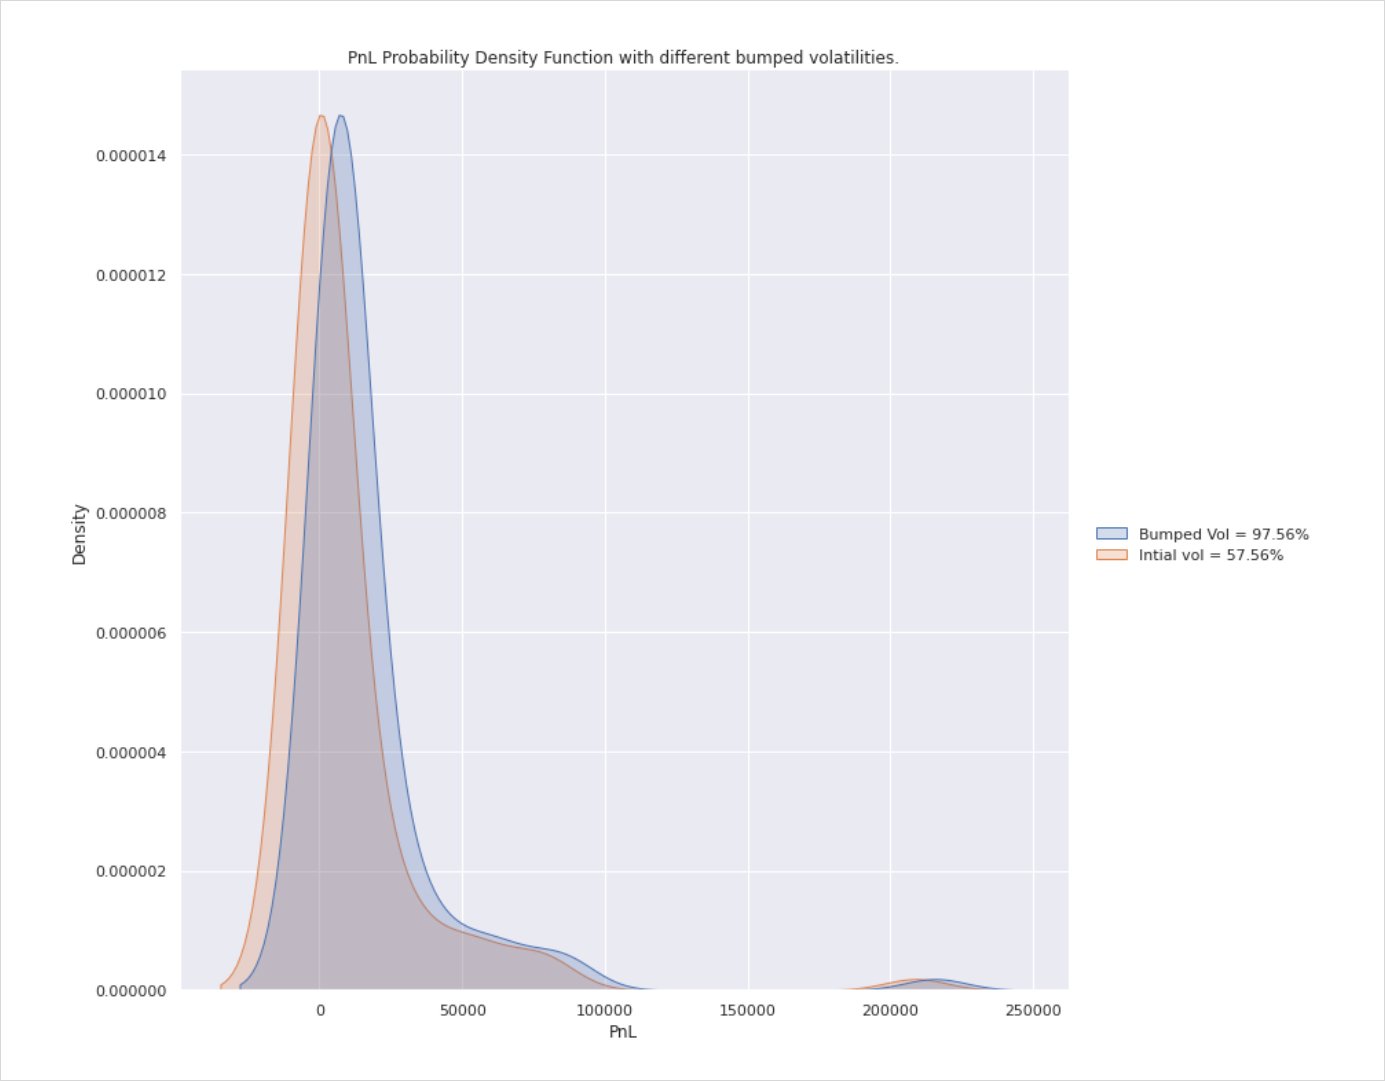
Points of note here are that your pnl is always distributed either side of 0 i.e. some trades will lose you money (max loss is premium paid in this instance) while in others you will make profit in excess of anything CT ever promised you. The tail is skewed to the right as there is no upside cap on price action and so although rare, some expiries will warrant celebration.
The charts show four different instances ranging from RV<IV, RV=IV and the last scenarios in which RV>IV.
In the last two instances, while pnl is still distributed either side of breakeven (you don’t always end up in the black), there is a clearly visible skew suggesting that the favourable volatility mismatch will result in a greater pnl distribution in the hedger’s favour if done over enough instances i.e. the peak (mean) of the curve sits to the right of 0 meaning on average you’ll make a profit.
Now onto the question of hedging frequency. Now that we understand how volatility risk can lead to pnl generation, how often should we delta hedge?
Take a look at this table displaying pnl for a 1yr 56.7% vol Call struck at 46k. Using our options calculator you will see the option’s price is close to 10.3k which is the value shown in the annual hedge column at the same Volatility level.

An initial glance of the table reveals two clear characteristics: as RV increases, so does pnl. Also, as hedging frequency decreases, pnl also increases. One thing this table betrays to show is the fact that the standard deviation of your pnl is inversely proportional to hedging frequency which is to say that the more frequently you hedge, the less ‘noise’ your pnl will suffer but also, the lower your perceived eventual sum.
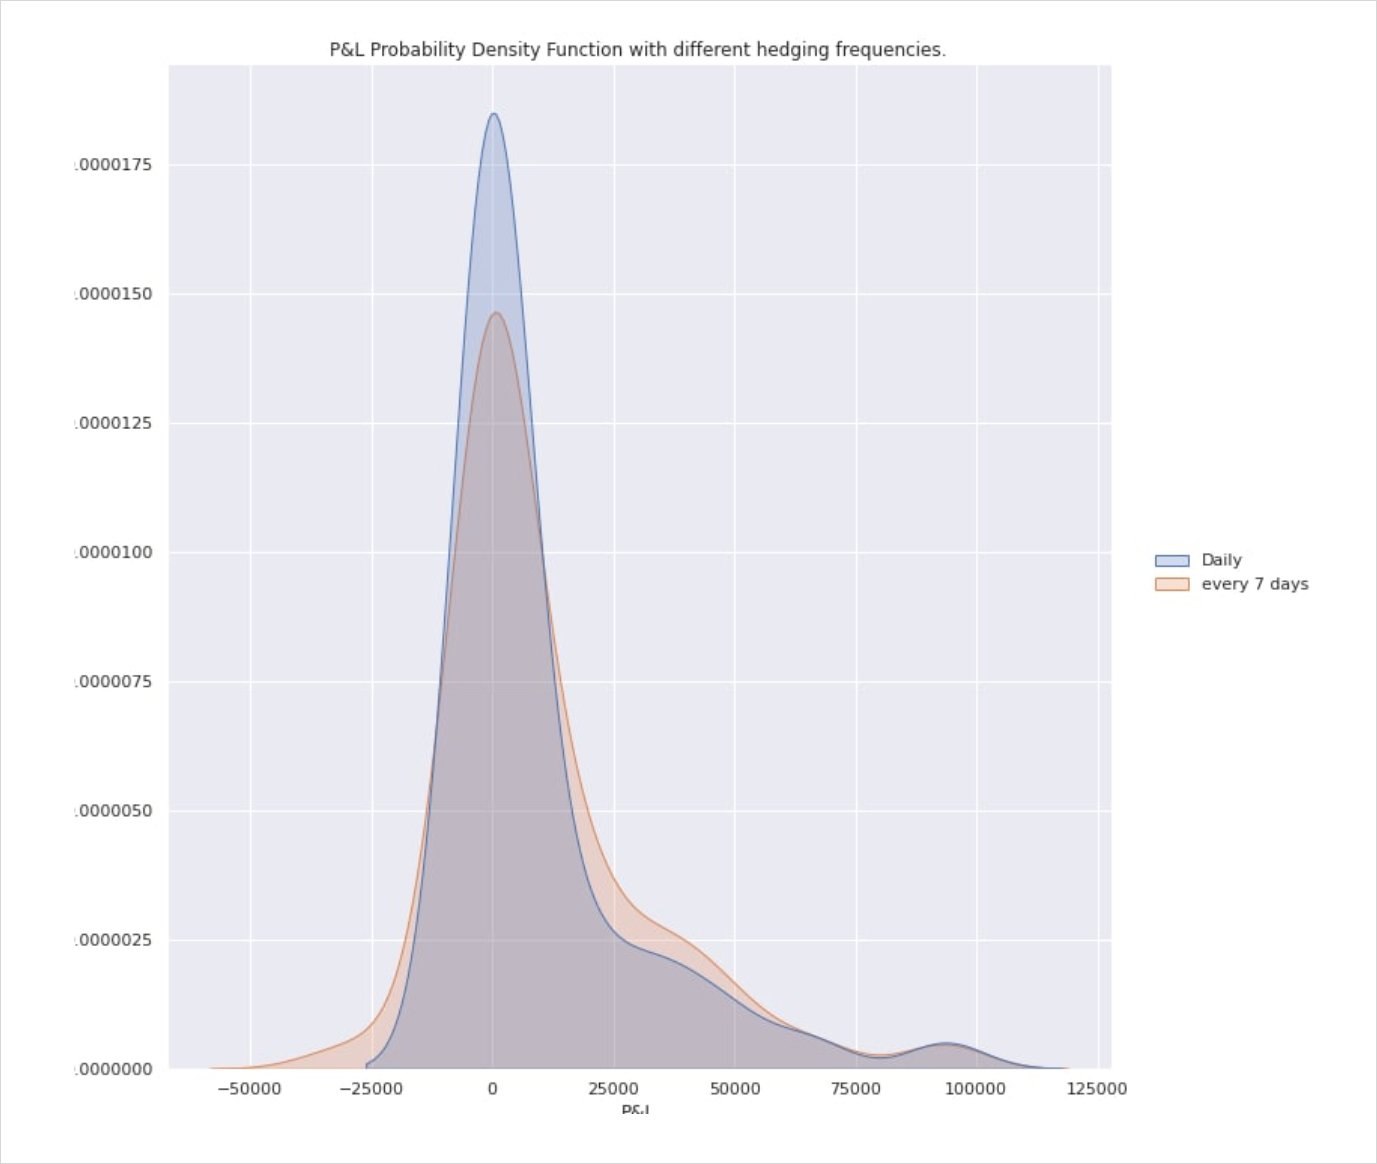
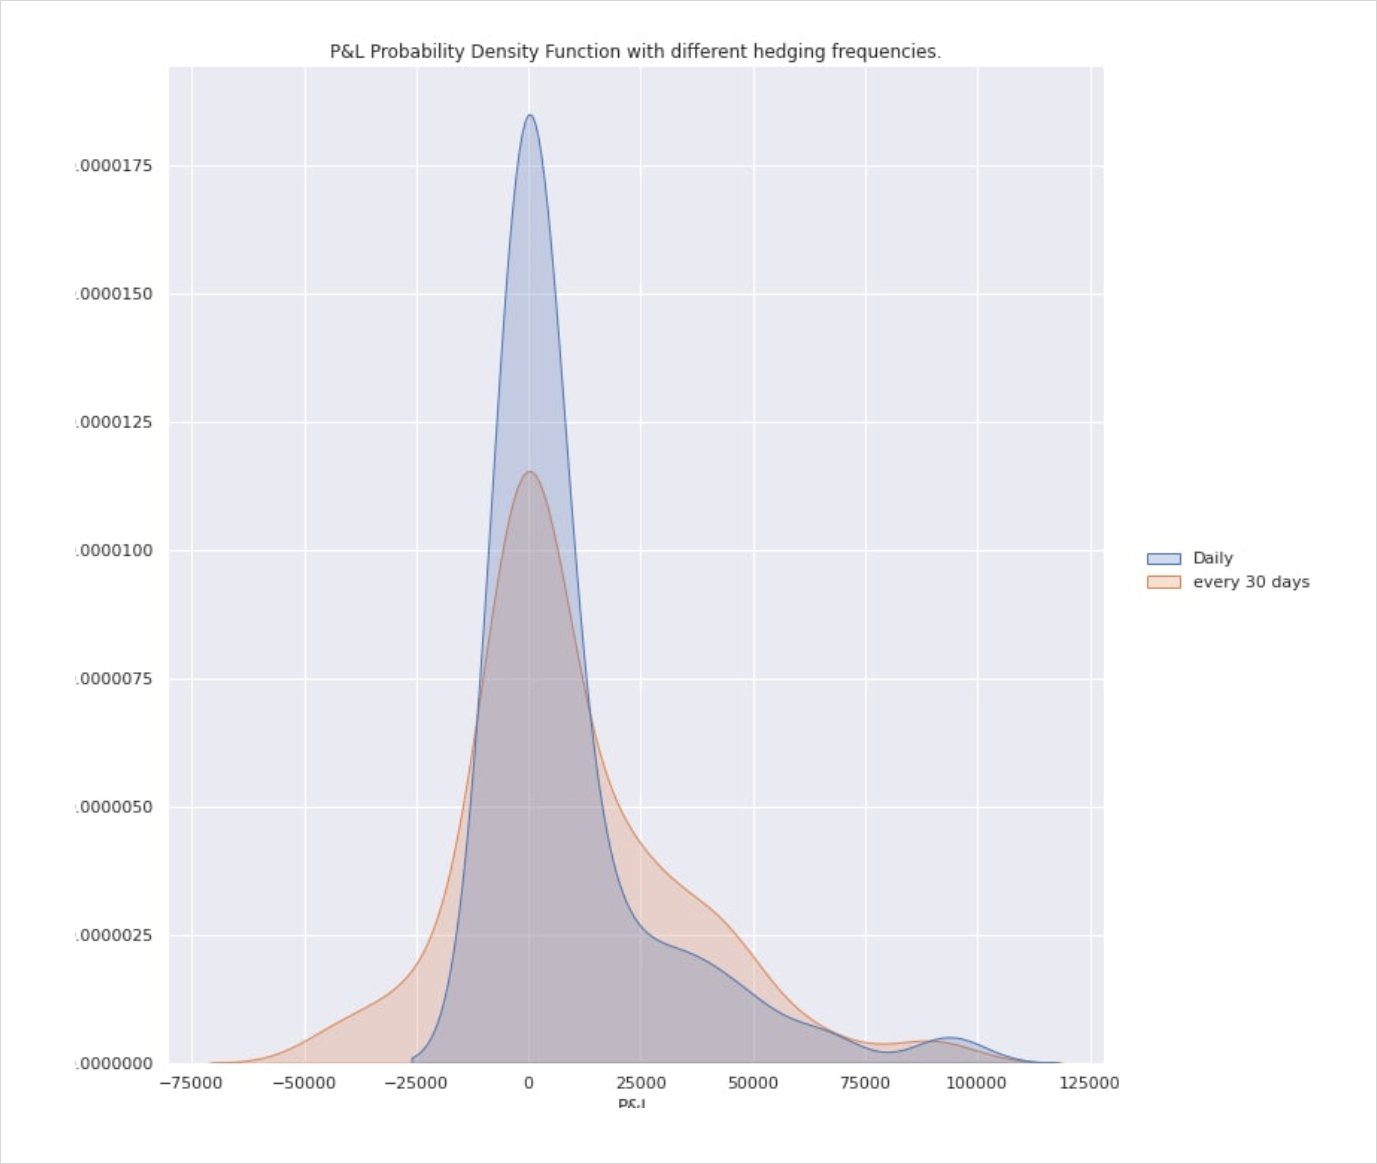
As a caveat I need to make it abundantly clear that hedged positions are entirely path dependent and that even correctly predicting realised Vol does not guarantee profit. The above examples have been generated using discrete observations which introduce sampling error. The fact that you will not be able to hedge continuously without incurring obscene hedging costs pretty much renders the concept of a perfect hedge the stuff of fairytale.
AUTHOR(S)
